Bitcoin on the Rise — But the Bat Hasn't Flown Yet
---
🚀 **!** 🦇
We're anticipating a continued bullish move in Bitcoin until it completes the **Bat Pattern** at the key level of **$118,469**. 📈
From there, we expect a reversal — a drop toward **$113,800**. 📉
Stay tuned, drop your thoughts below, and let’s decode the market together.
#Bitcoin #CryptoAnalysis #BatPattern #TechnicalAnalysis #LearnThenTrade
---
BTCUSD trade ideas

BTCUSDSell Call Risky Trade
Conditional trade sell on retest support
Rejected from the trendline if breakes support then open sell position
Weekend volume in mind !
SL TP EP all in charts

Final Leg Bitcoin just broke out of a wave 4 channel (bullish flag) and it's expected to surge to a new ATH.

BTCUSD: Will Go Down! Short!
My dear friends,
Today we will analyse BTCUSD together☺️
The in-trend continuation seems likely as the current long-term trend appears to be strong, and price is holding below a key level of 118,171.98 So a bearish continuation seems plausible, targeting the next low. We should enter on confirmation, and place a stop-loss beyond the recent swing level.
❤️Sending you lots of Love and Hugs❤️

BTC - about to go full retardo - $135kI think the title says it all. BTC is about to go into a massive rally. We need to finish out the last little bits of this correction, and go all in. $135k is going to be an easy next target before the next area of Consolidation. That level of consolidation is unlikely to give much back, which will then unleash full retardo mode taking us to near $164,200. Time line is about 6-8 months or so as how it is looking to me today. I will update as we climb. Good Luck. Especially to the traders holding short positions. Ouch.

BITCOIN BEARISH GARTLEY SETUP A bearish Gartley harmonic pattern has completed on the 4 hour timeframe of Bitcoin suggesting a potential pullback. The pattern also has some indicators divergence as a confluence. Short position opened at the lower high has downside targets at the 38.2% and 61.8% Fibonacci retracements. Stop loss placed just above the lower high to protect against invalidation.
Cheers my fellow traders.

BTCUSD – Bullish Momentum Targeting Supply ZoneBitcoin (BTCUSD) is showing strong bullish momentum after bouncing from the $115,321 – $115,383 support level. Price is now aiming toward the supply zone between $120,428 – $120,492.
🔹 Key Levels:
Supply Zone (Resistance): $120,428 – $120,492
Current Price: ~$118,380
Support Zone: $115,321 – $115,383
Demand Zone: $113,250 – $112,130
🔹 Analysis:
Price has formed a solid rally after retesting key support, confirming bullish strength. As long as price holds above $116,984, the next target remains the supply zone near $120,492. If bulls break above this zone, further upside could be seen.
🔹 Bullish Scenario:
Entry: Above $116,984 support
Target 1: $120,428 – $120,492
Target 2: Potential breakout above $121,000
Stop loss below $115,321
🔹 Bearish Scenario:
Failure to hold above $116,984 could trigger a retracement toward $115,321 and possibly the demand zone at $113,250.
📍 Bias: Bullish toward $120,492 unless support is broken.


$BTC Finally Historical Profit Done at $122K & Now $123K of ATH CRYPTOCAP:BTC tying to push price upward movement and if it's Breakout the $120K-$122K Price Level area than it could be reached $128K - $136K price level area.
I'm guess it will be happened. Always Pattern indicate and say price movement of Bitcoin. I was many Prediction of popular coin and i will succeed in 2025. I'm long term analyst of long term investment of Traders.
🚦From News: Bitcoin Holds Firm Above $115K Support as Charts Point Toward $150K Target
Bitcoin holds above $115K support with charts pointing to a potential $150K Elliott Wave target.
Hashrate hits all-time high as energy value model places BTC valuation 45% above current price.
U.S. policy shift enables 401(k) crypto access, opening a $9 trillion market for Bitcoin adoption.
Bitcoin has held firm above the $115,000 support and is now showing signs of a large move on the charts. Price patterns and rising adoption trends are aligning as BTC prepares for a possible rally. At the time of writing, BTC was trading at $116,620, showing steady upward momentum.
Technical Structure Points Toward Upside Continuation
According to an analysis prepared by Lau, Bitcoin has taken the $115,000 support and may be preparing to break its all-time high. On Binance, the BTC/USDT daily chart displays a breakout from resistance near $116,438.79. The price reached a new high before retracing to $111,917.37, where it found support.
BTC’s price structure continues to show higher lows, aligning with the Elliott Wave pattern that targets $150,000. Key support levels remain at $98,385.45 and $89,326.51, confirming a strong technical base. According to Daan Crypto Trades, Bitcoin is steadily rising toward the $120,000 zone, where a cluster of stop losses and liquidation points may fuel further upside.
The current bullish flag formation is still intact, supported by the 50-day SMA at $113,154. The RSI has moved to 54, indicating recovering momentum without being overbought. Analysts view a break above $117,350 as a key signal for another upward push.
On-Chain Metrics and Market Drivers Support Growth
Bitcoin’s energy value stands at $167,800, which is around 45% above the current market price. According to Charles Edwards, founder of Capriole Investments, “Hash rates are flying and Bitcoin Energy Value just hit $145K.”
This model links BTC’s value to miner energy inputs and network security. Bitcoin’s hashrate reached an all-time high of 1.031 ZH/s on August 4, based on data from Glassnode. Alongside this, adoption is growing in the U.S. market.
President Trump’s policy allowing 401(k) crypto inclusion has opened a $9 trillion market. Crypto-linked equities and ETFs have also seen strong inflows, supporting long-term price action.
#highlights #everyone #premium #BinanceSquareFamily #Binance #BTC☀ #SUBROOFFICIAL
Disclaimer: This article is for informational purposes only and does not constitute financial advice. Always conduct your own research before making any investment decisions. Digital asset prices are subject to high market risk and price volatility. The value of your investment may go down or up, and you may not get back the amount invested. You are solely responsible for your investment decisions and Binance is not available for any losses you may incur. Past performance is not a reliable predictor of future performance. You should only invest in products you are familiar with and where you understand the risks. You should carefully consider your investment experience, financial situation, investment objectives and risk tolerance and consult an independent financial adviser prior to making any investment.


BTCUSD SCALP Bitcoin scalp,I will be following the trend and keeping it simple with no indicators used for all these trades, will keep taking profits
BTCUSD Long SetupHi everyone.
These two areas are good to set orders. But please consider the risk management for each..
I'll update TPs later..
Tradingview.com Platform Description:
Dear traders, please support my ideas with your likes and comments to motivate me to publish more signals and analysis for you.
Best Regards
Navid Nazarian

BTCUSD Bullish Flag continuation support at 115,580The BTCUSD remains in a bullish trend, with recent price action showing signs of a corrective pullback within the broader uptrend.
Support Zone: 115,580 – a key level from previous consolidation. Price is currently testing or approaching this level.
A bullish rebound from 115,580 would confirm ongoing upside momentum, with potential targets at:
122,334 – initial resistance
123,550 – psychological and structural level
126,054 – extended resistance on the longer-term chart
Bearish Scenario:
A confirmed break and daily close below 115,580 would weaken the bullish outlook and suggest deeper downside risk toward:
113,530 – minor support
110,530 – stronger support and potential demand zone
Outlook:
Bullish bias remains intact while the BTCUSD holds above 115,580 A sustained break below this level could shift momentum to the downside in the short term.
This communication is for informational purposes only and should not be viewed as any form of recommendation as to a particular course of action or as investment advice. It is not intended as an offer or solicitation for the purchase or sale of any financial instrument or as an official confirmation of any transaction. Opinions, estimates and assumptions expressed herein are made as of the date of this communication and are subject to change without notice. This communication has been prepared based upon information, including market prices, data and other information, believed to be reliable; however, Trade Nation does not warrant its completeness or accuracy. All market prices and market data contained in or attached to this communication are indicative and subject to change without notice.

Bitcoin showing insane upside to come to $146,942June we were waiting for the brim breakout.
10 July 2025, we got it.
Then it formed a small Pennant formation, testing the brim breakout and then it went above the pattern.
So, now we are en route to the initial target since June.
MAJOR Cup and Handle forming.
Price> 20 and 200MA
Target 146,942
Disclosure: I am part of Trade Nation's Influencer program and receive a monthly fee for using their TradingView charts in my analysis.

Bitcoin Holds Key Support at $115,826 — Eyes on Volatility AheadBitcoin’s bullish structure is now anchored at $115,826.55, a level that has shown strong buying interest on the daily timeframe. With significant U.S. dollar news ahead, be aware — such events often lead to a break of recent daily highs or lows.
Over the next 48 hours, key U.S. dollar data could trigger sharp moves across crypto. If BTC holds this level, the path toward $123,231.07 remains open.
Watch the DXY index alongside Bitcoin for clues during the news releases.

$BTC Daily UpdateCRYPTOCAP:BTC #Bitcoin $122,809 resistance test rejected, $118,168 current support, 1D closed with bearish pin bar, Previous 4h also bearish with current 4H forming bearish engulfing, $116,908 next support from here, Current support test likely, if followed thru on a bearish engulfing then expect next support test.

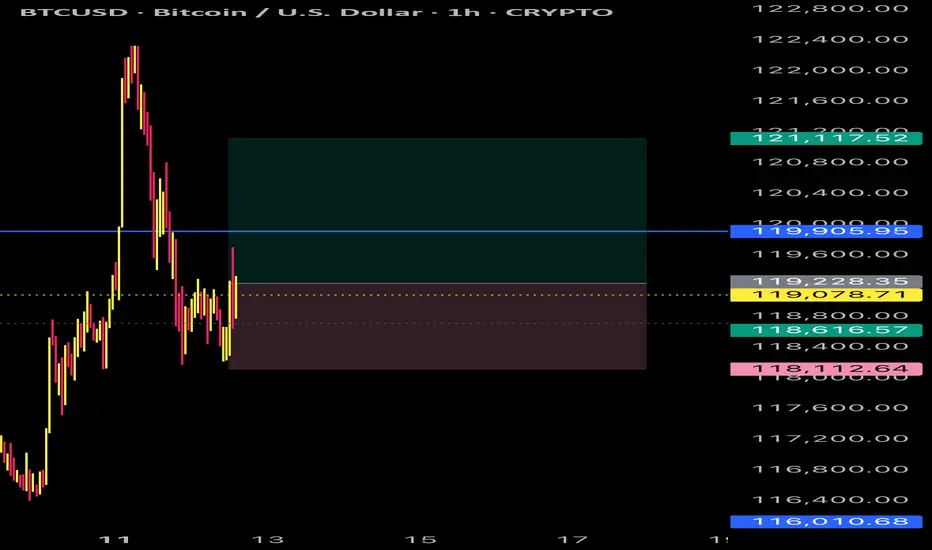
BTC/USD – Key Support Retest & Potential Breakout Zone | Current Price Action:
Trading near 118,543, price has broken below the yellow consolidation zone (~119,000) and is showing short-term weakness.
Resistance Levels:
Immediate resistance at 119,284, then 119,841, with stronger supply zones at 120,900 and 121,545.
Support Levels:
First support at 117,923, followed by 116,495. A breakdown of 117,923 could accelerate selling pressure.
Trend Outlook:
Short-term bias is bearish after repeated rejections from 119,284–119,841 zone; lower highs are forming.
Trading Bias:
Bullish: Break & hold above 119,284 → targets 119,841 / 120,900.
Bearish: Sustained trade below 117,923 → opens path to 116,495.

BTC Upside Momentum Trend & Structure
• BTC remains in a broader uptrend after retesting $118K.
• Holding above both 50 EMA and 200 EMA indicates trend strength .
Support Levels
• $118,000–$119,000 (current pivot and demand zone)
• $116,500–$117,000 (secondary support, aligns with MicroStrategy buys)
Resistance Levels
• $122,000–$123,200 (near all-time high zone)
• $125,000–$128,000 (upside breakout range)
Indicators
• Volume: Declining slightly on recent dips, showing weak sell pressure.
• RSI: Near neutral (≈50), providing room for further bullish momentum.
• MACD: Normalizing but still favoring bulls near EMA support.

Bitcoin Soars Past $122K, But a "Digital Fort Knox" Threat LoomsThe cryptocurrency market is in the throes of a historic rally, a tidal wave of capital and confidence that has propelled Bitcoin beyond the formidable $122,000 mark. Now trading within 1% of its all-time high, the world’s premier digital asset is riding a powerful current shaped by two monumental events: a surprisingly favorable executive order from the White House and a relentless cascade of inflows into spot Bitcoin ETFs. This surge has ignited euphoria across the financial world, with even the second-largest cryptocurrency, Ether, touching highs not seen since its 2021 peak.
Yet, beneath the glittering surface of this bull run, a profound and unsettling question is taking shape. As institutional giants and corporate treasuries embrace Bitcoin, some of its most astute observers are sounding an alarm. They warn that this corporate adoption boom is creating a path that looks eerily similar to the one gold traveled in the 20th century—a path that ended with its effective nationalization and centralization in the vaults of Fort Knox. This growing concern posits that Bitcoin’s greatest triumph, its integration into the mainstream financial system, could become its ultimate vulnerability, presenting a new and potent centralization threat that challenges the asset's very soul. The market is now caught between the thrill of unprecedented price discovery and the chilling possibility that it is witnessing the rise of a digital Fort Knox.
The Anatomy of a Rally: A Perfect Bullish Storm
The recent price explosion was not a random event but the result of a powerful confluence of factors that have systematically validated Bitcoin’s role in the global financial landscape. The market sentiment has been overwhelmingly positive, driven by a one-two punch of regulatory encouragement and undeniable institutional demand.
First, a landmark executive order from the White House sent a clear signal that the United States is moving towards a framework of integration rather than opposition for digital assets. The order, widely seen as pro-crypto, has initiated a formal exploration of how to safely incorporate cryptocurrencies into the bedrock of American wealth: 401(k) retirement plans. For years, regulatory uncertainty has been the single greatest barrier holding back a true institutional deluge. This directive acts as a powerful de-risking event, providing a level of clarity and legitimacy that large-scale investors have been desperately seeking. The potential to unlock even a small fraction of the trillions of dollars held in retirement accounts has sent a jolt of optimism through the market, assuring corporations and funds that they are investing in an asset class with a government-acknowledged future.
Second, while the executive order provided the strategic tailwind, the tactical buying pressure has come directly from spot Bitcoin ETFs. These regulated financial products, which allow investors to gain exposure to Bitcoin through a traditional brokerage account, have been an unprecedented success. In a stunning display of demand over the last week, these funds have absorbed hundreds of millions of dollars in net inflows on consecutive days. To issue new shares, these ETFs must purchase the underlying Bitcoin from the open market, creating a massive and constant source of demand. This dynamic acts like a supply shock; as billions of dollars from mainstream investors flow through ETFs to chase a finite number of available coins, the price is algorithmically forced upward. The flow of funds into these products has become one of the most closely watched metrics, serving as a real-time indicator of institutional appetite and a direct driver of price action.
The Ghost of Gold: A Historical Warning for a Digital Age
Even as investors celebrate this new era of institutional acceptance, a chilling historical parallel offers a cautionary tale. The concern, articulated by prominent on-chain analysts, is that Bitcoin’s current trajectory is mirroring the centralization of gold that occurred in the United States, a process that ultimately subjected the precious metal to complete state control.
To grasp the gravity of this comparison, one must look back to President Franklin D. Roosevelt's Executive Order 6102, signed in 1933. Amidst the Great Depression, the order made it illegal for U.S. citizens to privately hold significant amounts of gold coins or bullion, compelling them to turn over their holdings to the Federal Reserve. The stated goal was to stabilize the economy, but the result was the mass transfer of a decentralized monetary asset from the hands of the people into the centralized vaults of the U.S. government. The nation's gold was consolidated, most famously at Fort Knox, giving the state absolute control over the physical supply.
Decades later, in 1971, President Richard Nixon delivered the final blow. With the "Nixon Shock," he unilaterally severed the U.S. dollar's convertibility to gold, effectively ending the Bretton Woods system that had anchored global finance. Having already secured control of the physical asset, the government was then free to change the rules of the system it underpinned.
The argument today is that Bitcoin could face a similar, albeit modern, fate. A 21st-century "nationalization" would not involve government agents seizing hardware wallets. It would be a far more sophisticated and systemic takeover, executed through the very financial instruments and institutions that are currently being praised for driving the bull market. The end result could be a scenario where a significant portion of the Bitcoin supply, while technically on a decentralized network, is effectively controlled by a handful of state-sanctioned entities.
This digital "Fort Knox" could be constructed through several vectors. The majority of Bitcoin purchased by ETFs and large corporations is not held in self-custody. Instead, it is entrusted to a small number of large, regulated custodians. These firms represent centralized points of control. A government could easily exert legal and regulatory pressure on these few custodians, compelling them to freeze, block, or even seize the assets they manage on behalf of millions of investors.
The ETFs themselves are a primary vehicle for this potential centralization. By concentrating hundreds of thousands of Bitcoin under the management of a few powerful financial firms like BlackRock and Fidelity, they make the asset supply vastly easier to regulate and control. It is far more efficient for a state to influence a handful of ETF issuers than to police millions of individual Bitcoin holders around the world.
Finally, the public companies that have famously added Bitcoin to their balance sheets are also part of this equation. As regulated entities, they must comply with government mandates. A state could enact policies that influence or dictate how these systemically important corporate treasuries are managed, effectively bringing them under state influence without ever formally seizing the assets.
Bitcoin’s Inherent Defense: Can Decentralization Hold the Line?
While the historical parallel to gold is compelling and sobering, it is not a perfect one. Bitcoin possesses unique technological attributes that provide a powerful defense against the kind of centralization that befell gold.
The most fundamental defense is the power of self-custody. Unlike gold, which is a physical object that is cumbersome to store and move securely, Bitcoin is pure information. An individual or entity that controls their own private keys holds a sovereign asset that is incredibly difficult to confiscate without their cooperation. This ability to "be your own bank" remains a powerful counter-force to the trend of custodial reliance.
Furthermore, the Bitcoin network is a globally distributed system. Miners, nodes, developers, and users are spread across dozens of countries, operating under a multitude of legal jurisdictions. No single government can unilaterally control the network or dictate its rules. An attempt by one major nation to implement draconian controls would likely trigger a mass exodus of capital and talent to more favorable jurisdictions, a powerful economic disincentive against overreach. The current global competition among nations to become "crypto hubs" demonstrates that governments are aware of this dynamic and are incentivized to create attractive, rather than punitive, regulatory environments.
This tension may ultimately lead to the bifurcation of the Bitcoin market. One tier could consist of the regulated, "paper" Bitcoin—held in ETFs and by public corporations, fully compliant, but subject to the rules and potential control of the traditional financial system. The other tier would be the sovereign, "physical" Bitcoin—held in self-custody by those who prioritize censorship resistance and decentralization above all else.
A Future Forged in Conflict
As Bitcoin knocks on the door of a new all-time high, the market is caught in a powerful paradox. The institutional adoption that has legitimized Bitcoin and driven its price to stratospheric levels is the very same force that introduces a systemic risk to its core principles. The celebration of the current rally is, in essence, a celebration of the construction of the very infrastructure that could be used to co-opt it.
The journey to $122,000 was paved with institutional capital and regulatory acceptance. The journey forward will be defined by a fundamental conflict: the battle between mainstream financial integration and the preservation of the decentralized ethos that made Bitcoin a revolutionary technology. The future of the world's most important digital asset will be forged in the crucible of this tension, determining whether it remains a truly sovereign asset for the people or becomes another tool in the arsenal of the centralized systems it was designed to disrupt.

BITCOIN Will Move Lower! Short!
Take a look at our analysis for BITCOIN.
Time Frame: 4h
Current Trend: Bearish
Sentiment: Overbought (based on 7-period RSI)
Forecast: Bearish
The price is testing a key resistance 116,484.20.
Taking into consideration the current market trend & overbought RSI, chances will be high to see a bearish movement to the downside at least to 114,249.78 level.
P.S
The term oversold refers to a condition where an asset has traded lower in price and has the potential for a price bounce.
Overbought refers to market scenarios where the instrument is traded considerably higher than its fair value. Overvaluation is caused by market sentiments when there is positive news.
Disclosure: I am part of Trade Nation's Influencer program and receive a monthly fee for using their TradingView charts in my analysis.
Like and subscribe and comment my ideas if you enjoy them!

BTC Technical Structure: Cup & Handle BreakoutBitcoin just broke out of a Cup & Handle formation, a pattern often associated with bullish continuation.
Pattern target based on cup depth: ~125,500 USD (projection only, not a guarantee).
Breakout came with increased trading volume and a short consolidation period.
Whether you trade or invest, identifying repeating patterns like this is a core skill for market analysis.
👉 What’s your take? Could this momentum carry into Q4?

Bitcoin Pushes On A SundayBitcoin’s daily chart delivered what can only be described as the easiest trade of the bull market – a textbook retest of $112K as support. Price respected the former resistance level perfectly, bouncing cleanly and confirming it as a launchpad for the next leg higher.
The move has been technically sound from start to finish. Price reclaimed and held the 50-day moving average, grinding upward in orderly fashion before Sunday’s strong push through $120K. .
Today’s session is key – after a weekend breakout, follow-through is essential to confirm strength. If bulls can sustain this move and close firmly above $120K, the door opens for a retest of the $123K–$124K range highs. Failure to do so risks another round of consolidation beneath resistance, but for now, the trend remains firmly in the bulls’ favor.

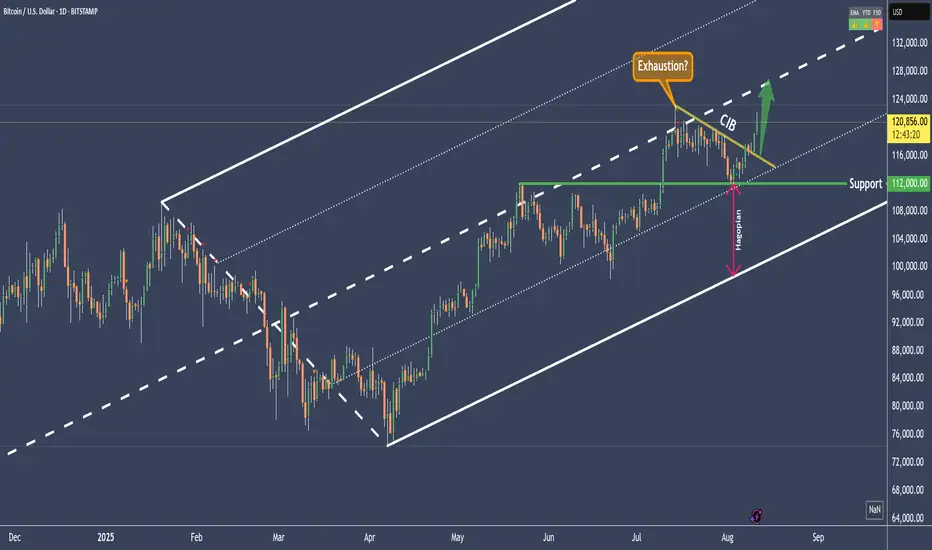
BTCUSD - Bitcoin potential at least 125'400Bitcoin is trading within the Pendulum Fork.
After the CL was reached, the price should have gone to the L-MLH.
However, this was not achieved, and instead a HAGOPIAN was left behind.
In most cases, this HAGOPIAN will drive the price higher than where it came from.
Since we know that in about 80% of all cases the market moves to the CL, we also have a good chance this time of reaching the high of at least 125,400. Personally, I see the target quite a bit higher, but let’s see what BTCUSD has in store for us.
Thanks for the likes peeps §8-)