BTC UpdateETF outflows seem to be really hurting shitcoin, it keeps dropping during US market hours. Flipped some IBIT puts today, figured it wouldn't hold the inflation pump.
Daily indicators are still trending down, I'm not gonna go long until daily indicators go oversold again.
Market insights

HELLO TRADERSBTCUSD FOCAST.
It looks like BTCUSD swing corrections goes up to 50% fib level. with that thought in mind all my swing corrections are up to 50% fib retracement as showed on the chart.
REMEMBER THIS IS NOT A TRADING IDEA. SO SHOULD YOU FOLLOW IT, note that i am not going to be liable for your losses. trade safe

Bank of Japan Policy Decision: Global Market Impact AnalysisBank of Japan Interest Rate Decision (December 19)
Introduction : Why Japan’s Interest Rate Policy Matters
Japan’s monetary policy plays a critical role in the global financial system. For decades, the Bank of Japan (BoJ) maintained ultra-loose conditions, turning the Japanese yen into the world’s primary funding currency. Global investors borrow cheaply in JPY and deploy capital into higher-yielding assets such as equities, bonds, and cryptocurrencies.
Because of this structure, even a small shift in BoJ policy can trigger large cross-market reactions. The BoJ’s interest rate decision on December 19 is therefore a high-impact macro event with potential consequences for forex, global equities, bonds, gold, and crypto markets.
Scenario 1: If the Bank of Japan Raises Interest Rates
A rate hike would represent a historic policy shift and signal the early stages of monetary normalization.
Impact on Forex (USD/JPY & JPY Pairs)
* The Japanese yen (JPY) is likely to strengthen due to improved yield appeal
* USD/JPY may face strong bearish pressure
* Carry trades funded in JPY could unwind rapidly, increasing volatility
JPY crosses such as EUR/JPY, GBP/JPY, and AUD/JPY may also decline as risk exposure is reduced.
Impact on Global Equity Markets
* Japanese equities: Mixed to bearish bias due to a stronger yen hurting exporters
* Asian markets: Short-term weakness as financial conditions tighten
* US & European equities: Increased volatility and pressure on growth stocks
Overall, a rate hike may trigger a short-term global risk-off reaction driven by liquidity repricing rather than economic deterioration.
Impact on Crypto Markets (Bitcoin & Altcoins)
* Bitcoin: Short-term bearish pressure and higher volatility
* Altcoins: Likely underperformance due to higher risk sensitivity
* Macro-driven selling could create longer-term accumulation zones once volatility settles
Impact on Bonds, Gold & Risk Sentiment
* Bonds: Japanese and global yields may rise
* Gold: Short-term pressure from higher yields, medium-term support if risk aversion increases
* Risk sentiment: Shift toward defensive positioning and reduced leverage
Scenario 2: If the Bank of Japan Does NOT Raise Interest Rates
If rates remain unchanged, markets may view the decision as continued policy caution.
Expected Market Reactions
* JPY: Continued weakness
* USD/JPY: Bullish continuation
* Global equities & crypto: Supported by ongoing liquidity
* Risk sentiment: Risk-on behaviour likely to persist
Short-Term vs Medium-Term Outlook
Short-Term
* Rate hike: Sharp volatility, risk-off moves
* No hike: Relief rally in risk assets
Medium-Term
* Gradual tightening allows controlled market adjustment
* Continued loose policy supports assets but increases structural risks over time
Markets typically shift from news reaction to trend confirmation within weeks.
Educational Entry–Exit Examples (Not Financial Advice)
USD/JPY (Rate Hike):
* Bias: Bearish
* Concept: Breakdown → pullback → continuation
* Invalidation: Above recent swing high
Bitcoin (No Hike):
* Bias: Bullish
* Concept: Pullback after impulse
* Risk Note: Reduced size during news volatility
US Indices:
* Rate hike: Sell rallies near resistance
* No hike: Buy dips in confirmed trend
Conclusion: Key Takeaways for Traders
The Bank of Japan’s December 19 interest rate decision is a major global liquidity event. A rate hike would favour the yen while pressuring risk assets, whereas a no-change policy would support equities, cryptocurrencies, and carry trades. Traders should prioritise volatility management, confirmation from price action, and cross-market correlations over predictions and forecasts.
Stay tuned!
@Money_Dictators
Thank you :)

BTCUSD: Holding Wave X or Slipping Lower?24 Nov 2025
27 Nov 2025
1 Dec 2025
17 Dec 2025
Bitcoin is still trading inside a falling channel, and the overall structure remains corrective. The recent bounce from lower levels lacks momentum and is overlapping, which signals consolidation rather than a trend reversal. Price continues to respect channel resistance, keeping the broader bias weak.
Wave X is acting as an important support zone around 83,822 , and as long as price holds above this level, further consolidation remains possible. This area is currently absorbing selling pressure and preventing immediate continuation to the downside.
However, a decisive breakdown below Wave X would signal that the correction is not complete. In that scenario, downside momentum is likely to expand, opening the path toward the 79,650 - 75,655 zone.
Stay Tuned
@Money_Dictators
RD :)

Bitcoin Toying With Emotions, Manipulation?Bitcoin appears set to play with the minds of longs and shorts. 21 November appears to have been a cycle low, price recovered the dotted green line a signal to longs, then we got a backtest which was a higher low. Bulls would love this kind of setup and might be accumulating. This setup though is dangerous, a break below the dotted green line will see many longs trapped & create a selling frenzy. Bitcoin seems to be manipulated both ways. I am watching for a break below, Bitcoin miners will be good to buy cheaper if this plays out. Perhaps the coming of ETFs has put Bitcoin in the position gold found itself, being toyed with much to exasperation of bugs.

BTC/USD pair reversal from the fear value gap.BTCUSD (Bitcoin / U.S. Dollar) – 30 Min.
Price recently swept liquidity near the support zone and reacted strongly, indicating buyer interest at lower levels.
The move created a bullish displacement, leaving behind a Fair Value Gap (FVG) that now acts as a key support area.
Market structure shows a shift to short-term bullish (CHOCH) after the strong impulsive candle.
The marked reversal area is valid as long as price holds above the FVG and higher lows are maintained.
Upside potential is toward the major resistance zone near the previous strong high, where sell-side pressure is expected.
A rejection from resistance could lead to another pullback into the FVG for continuation.
Bias:
Bullish above the FVG, targeting the resistance / buy-side liquidity.
Invalidation if price breaks below the FVG and support zone.
This setup favours buy-on-dips until resistance is reached.

Elise | BTCUSD | 30M – Range Expansion SetupBITSTAMP:BTCUSD
After rejecting from the 93,500 resistance area, BTCUSD experienced a strong impulsive drop, sweeping sell-side liquidity before stabilizing at a key support level. The current structure shows consolidation above support, suggesting short-term accumulation. Buyers are active, but price still trades below major resistance, meaning confirmation is required.
This is a reaction-based trade, not a trend trade.
Key Scenarios
✅ Bullish Case 🚀
Condition: Hold above 86,200–85,100
🎯 Target 1: 88,800
🎯 Target 2: 90,000
🎯 Target 3: 92,000–93,500 resistance zone
❌ Bearish Case 📉
Condition: Breakdown & close below 85,000
🎯 Downside Target 1: 83,800
🎯 Downside Target 2: 82,000
Current Levels to Watch
Resistance 🔴: 90,000 – 93,500
Support 🟢: 86,200 – 85,100
⚠️ Disclaimer: This analysis is for educational purposes only. It is not financial advice

BTCUSD|Bearish Below 88K as CPI and Quantum Talk Shape SentimentBTCUSD | Short Technical Overview
Bitcoin is trading around the 88,000 pivot line, showing continued weakness below the major resistance zone at 95,449–100,873. The structure remains bearish as long as price stays under this pivot, with a potential move toward 84,000 and then the deeper 76,600 support zone highlighted on your chart.
Today’s U.S. CPI will be a major volatility driver.
A higher-than-expected CPI reading would strengthen the USD and typically pressure Bitcoin downward, supporting the bearish structure already visible on the chart.
Beyond short-term volatility, a new narrative is emerging: a growing group of Bitcoin advocates and crypto fund managers is pushing for faster adoption of quantum-resistant signatures. They warn that even the perception of a future quantum threat could create market risk long before quantum attacks become technologically feasible. This could influence long-term sentiment and development priorities across the ecosystem.
Key Levels:
Pivot: 88,000
Resistance: 95,449 → 100,873
Support: 84,000 → 76,600
Bias: Bearish below pivot; CPI adds downside risk.

Bitcoin - Dawn of the Dark with some LightI posted a similiar chart as private idea some days ago. ()
This idea here is an updated slightly adjusted version.
If i look at the big rise from 2017/2018 and our current swing i see certain similarities.
1. We created a top.
2. Downtrend and retest of the 50% of the swing.
3. Uptrend from the 50% and creating a swing high that takes out the big upper resistance
4. Again going towards 50% but this time no big buying showing up.
5. Fall under the 50% and heading towards the 23% - this is where we are now in the current swing
If both swings move similiar we should see the following happening now:
1. Move to the 23% level.
2. Buyers show up push price again towards the 50% level - but no clean retake
3. Price falling down again to the 23.60
Additional: In Both times we had Engulfs or SFPs of the High.
Problems with this analysis:
We cant deny that the retest of the 50% level on the second swing generated a Higher High (red line) - however its a weak Higher High as it barely went above the recent swinghigh. Besides the similiarities with the shakeout and retest of 2017. I classified it even as divergence or engulf in my recent analysis.

Bitcoin Price Correction: Heading Toward $70,000As of December 17, 2025, Bitcoin is trading around $87,000–$88,000, down from its all-time high of over $126,000 earlier this year. Recent market volatility, driven by macroeconomic factors like potential Bank of Japan rate hikes and profit-taking after the post-election rally, has analysts warning of further downside.
Many technical indicators point to a potential retest of the $70,000–$75,000 support zone. This level has historically acted as strong demand in previous corrections and aligns with key moving averages and Elliott Wave projections from experts. A drop to $70,000 would represent a roughly 20% decline from current prices, which is common in Bitcoin's cyclical patterns during consolidation phases.
While long-term bullish factors remain (institutional adoption, ETF inflows, and scarcity post-halving), short-term bearish pressure could push BTC lower before any rebound. Traders should watch $84,000 as immediate support—if it breaks, $70,000 becomes the next major target.
This is not financial advice; cryptocurrency markets are highly volatile.

Bitcoin & Bullish DIVBitcoin is reputing what it did in the past in 3d timeframe with bullish Divergence + MACD is making bullish cross as well

BITCOIN 107,000 COMING SOONHello Team here we are once more wanting to tell you guys that BITCOIN will be bouncing back up to 107,000 and perhaps more our strategy has said so, which we are very fortunate to have. guys please allocate and DCA into bitcoin as it continues to bleed, but just know that deep down we are actually BULLISH ASF.

BTC/USD Bullish trend breakdown selling strong📉 BTCUSD – SELL SETUP (4H TIMEFRAME)
BTCUSD is showing bearish pressure after a bullish trendline breakdown followed by consolidation breakdown.
Price is reacting lower from the 88,000 zone, confirming short-term downside momentum.
🔻 Entry: Sell from 88,000 area
🎯 Technical Targets:
• 85,700
• 84,700
• 82,200
📊 Timeframe: 4H
🧠 Structure-based trade | Momentum confirmation
⚠️ Risk Management is key
Always use proper position sizing and a well-defined stop-loss.
👍 Like | ➕ Follow | 💬 Comment | 🔁 Share
📌 Trade smart, not emotional

BTCUSD | Yearly Close....What do you call this candle?Hello traders,
BTC is about to close its yearly candle in 12 days and its printing this candle. It looks to me like a perfect bearish pin bar on its own and a bearish harami by chart structure.
I'm not a huge fan of candlestick patterns tbh, I don't trade them. Some do, I don't. But when you see this one on a yearly close, you simply can't ignore it.
Let me know what you think down below
If you like what I share, Please support me with a like

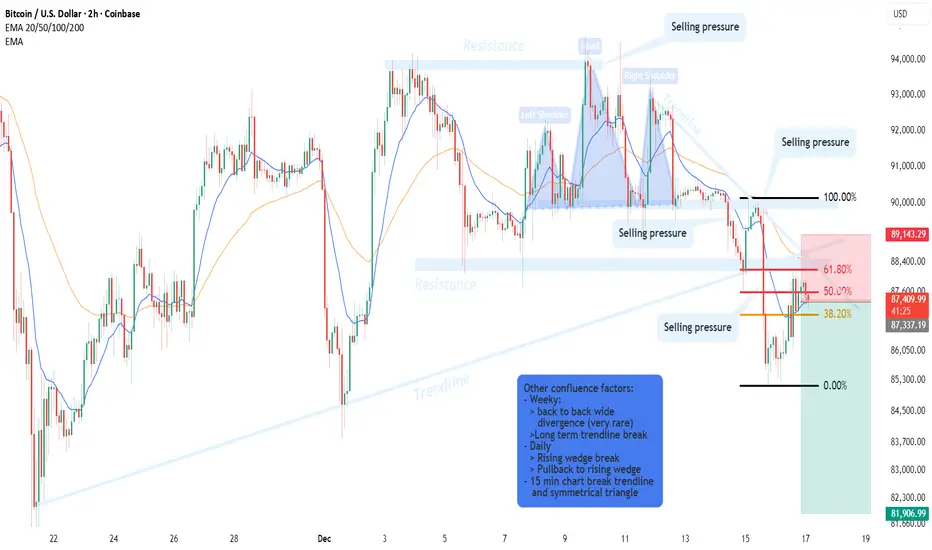
When All Timeframes Align: Weekly to 15m High-Probability SetupMain Timeframe — Weekly (Directional Bias)
Back-to- back wide divergence (very rare occurrence)
Long-term trendline break , shifting market structure
Provides the primary bearish directional bias
🔹 Higher Confirmation — Daily
Rising wedge breakdown
Pullback into the broken wedge structure
Confirms the Weekly bearish bias
🔹 Trade Setup — 2H
Strong resistance zone
--> Multiple rejections (3 clear touches)
--> Recently formed, clearly visible on the left
--> Obvious reaction area (high-probability zone)
Candlestick context
--> Inside bar at resistance
Confluence
--> 50–61.8% Fibonacci retracement
--> Broken trendline acting as resistance
🔹 Entry Timeframe — 15-Minute
Trendline break
Symmetrical triangle breakdown
Entry only after structure confirmation
🛑 Risk Management
Stop-loss above:
Resistance zone
EMA 50
Fibonacci 61.8%
Broken trendline
Descending trendline
➡️ Multi-layer protection
🎯 Target
Minimum R:R = 1:3
Justified by full top-down alignment across all timeframes
💬 Final Note
If you appreciate clean, rule-based, and well-explained market analysis , feel free to follow.
Your thoughts and alternative perspectives are always welcome in the comments.
⚠️ DISCLAIMER
This analysis is provided for educational purposes only and does not constitute financial advice.
Trading involves risk — always conduct your own analysis.
I am not responsible for any decisions or losses based on this idea.
BTCUSD: Anticipating a Strategic Sell OpportunityRecent economic indicators present a challenging landscape for risk assets, with disappointing U.S. employment figures underscoring labor market fragility and cooling inflationary pressures signaling a potential shift in monetary policy expectations. Major U.S. equity indices, such as the Dow Jones Industrial Average (US30) and Nasdaq-100 (NDX), are exhibiting technical patterns suggestive of near-term exhaustion, hinting at a broader market correction. Against this backdrop, Bitcoin (BTC/USD) appears poised for a period of weakness.
From a technical perspective, BTC/USD is approaching a critical juncture. The pair is testing a key ascending resistance trendline (highlighted in orange), which has historically acted as a formidable barrier. A retracement toward this dynamic resistance zone is anticipated, presenting a high-probability selling opportunity. Given that this setup does not align with a classic A-Book liquidity profile, trading volumes may remain subdued, suggesting a less aggressive approach to position sizing.
Traders are advised to monitor price action closely for confirmation of a pullback, with a focus on confluence between the ascending resistance and other technical indicators, such as momentum divergences or elevated selling pressure, to optimize entry timing. Risk management remains paramount in navigating this potentially volatile environment.

Bitcoin (BTCUSD) — Base Forming Ahead of a Bullish BreakoutBitcoin is approaching a critical moment . After a prolonged decline downside momentum has clearly slowed and price is beginning to stabilize , which is a common sign that selling pressure is being gradually absorbed . On the macro side market sentiment has improved slightly as investors grow more comfortable with expectations of easier financial conditions ahead , giving risk assets some room to recover.
On the H1 chart , the technical picture is turning constructive . BTC is forming a double bottom within a descending structure , showing strong buyer participation around the same support zone . At the same time price is pressing against the descending trendline , suggesting that seller control is weakening . This combination typically appears near transition phases rather than during strong bearish continuation.
The key now is confirmation . A clean breakout and close above the descending trendline would activate the double bottom target near 90000 , signaling a shift from corrective price action into a new bullish phase . Until that breakout occurs patience remains essential , but the technical risk to reward is starting to favor the upside .

Btc sell idea Sl above structure and tp below liquidity zoon
Btc is in a down trend on higher time frame so we will follow the trend

Bitcoin ... BITCOIN ... BTCUSD ... Wave 2 comes in Triple Combo / Triple Three Combination manner.
Expecting dip level of W2 = 84444$ - 84500$ ---- Accumulation zone/ Buying zone.
1st wave comes in Leading Diagonal manner.
I believe Massive Positive news support rising the price of Bitcoin next short term period, it could Be from next week, or End of this week trading.
Good 👍 Luck all.

Bitcoin : $77k Still On The TableBitcoin still holding its ground, but is not out of the woods yet because still have one more week of Bearish TIME where will do one of two things or stays in its current stablished range $94500 - $84000 or breaks below that range. Once it finish its Bearish TIME left then probabilities shift to the upside but as of now probabilities still to the DOWNside.
Place your long limit orders (SPOT) below $80k ladies and gentlemen to be ready for a quick liquidation wick of that area.
Remember your buy area is their liquidation area.
Once the Daily Bearish Cycle ends and most important where price is at that point in TIME will dictate how high next bounce will b , Is it in the upper side of the current trading range? (good scenario) or Is below the current trading range (bad scenario) or worst of all broke below current trading range and printed a lower low, well we will find out next week for sure.
Have a good trading weekend ladies and gentlemen.
Buckle up ladies and gentlemen volatility is coming back.
Boost.......Follow.......Comment.

In Bullish Scenario BTC may reach ATH in next few weeksThe market is extremely bearish, and there is a lot of fear right now. This scenario has happened before—BTC surprised everyone and pumped. Then, suddenly, everyone becomes bullish again, and that’s when BTC dumps by around 50% or more.
Not a financial advice. I could be wrong in very next week.

$BITCION BULL RUN (READ CAPTION)Hello Traders! Today is 17 December 2k25 and here is my $BITCION Analysis chart please read it and send me your ideas in comment section for more $bitcion analysis
This Bitcoin chart reflects a classic corrective phase after a bearish impulse, followed by signs of potential bullish recovery from a strong demand area. Price is currently at a critical decision zone, where the next directional move will be defined.
Initially, BTC was trading inside a triangle / consolidation structure, showing. This structure often acts as a liquidity trap, where both sides get positioned before a strong move occurs.
Bullish Scenario:
Pivot point: ($88100)
Target 1: ($90500)
Supply: ($91500)
Resistance: ($93000/$93500)
Please don't forget like and comment for more IG:BITCOIN latest updates.
This analysis for information purposes only. Trade is your own risk

BTC | UPDATE📊 BTC Update — Key Levels in Play
Bitcoin is currently reacting near a critical structure zone. Price holding above support keeps the bullish scenario valid, with momentum favoring a continuation toward the next resistance level. A clean reaction from these levels could confirm further upside.
🔓 Entry: 87,195
❌ Stop Loss: 85,843
🎯 Target: 88,098
Market structure and liquidity around this area make it a level worth watching closely.
What’s your bias from here — continuation or rejection? 👇
Support with a like if this helps your analysis 🚀
⚠️ Disclaimer: This post reflects personal market analysis. Not financial advice.
