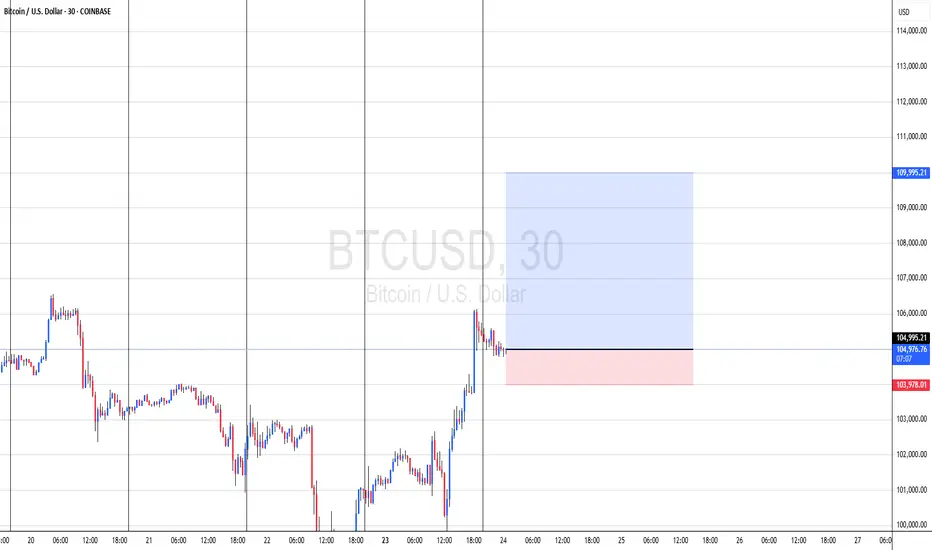
BTCUSD - Liquidity Zone in Focus Ahead of Options ExpiryAnalyst: Mosilar
BTC is trading near $107K with a key liquidity zone around $108,300 – $108,800. Max Pain for tomorrow’s options expiry sits at $102K.
Historically, BTC often gravitates toward Max Pain into expiry. A potential fade from the liquidity zone toward $104K and $102K could be in play.
Key Levels:
Liquidity Zone: 108,300 – 108,800
Volume Profile: 104,000
Max Pain: 102,000
BTCUSD trade ideas

Bitcoin's Podium-Ready 'Bull Flag' Hints at Price Boom to $120KBitcoin's Podium-Ready 'Bull Flag' Hints at Price Boom to $120K
Bitcoin, the pioneering cryptocurrency that has redefined the financial landscape, continues to spark intense debate and fervent speculation about its future price trajectory. Amidst the sea of technical analyses and market predictions, a compelling pattern has emerged on Bitcoin's price chart: the 'bull flag.' This bullish continuation pattern, often seen as a precursor to significant upward price movements, has ignited excitement among Bitcoin proponents, fueling predictions of a potential surge to $120,000.
This article delves into the intricacies of the bull flag pattern, exploring its formation, characteristics, and implications for Bitcoin's price. We will analyze the current market conditions, considering the recent retreat from $108,000 and the overall sentiment of Bitcoin bulls. Furthermore, we will examine the factors that could either validate or invalidate the bull flag pattern, providing a nuanced perspective on the potential for Bitcoin to reach $120,000. By synthesizing these insights, we aim to offer a comprehensive overview of the technical and fundamental factors that could shape Bitcoin's price trajectory in the coming months.
Understanding the Bull Flag Pattern
The bull flag is a technical analysis pattern that signals a continuation of an existing uptrend. It is characterized by two distinct phases:
1. The Flagpole: This represents the initial strong upward movement in price. It is a sharp, almost vertical rally that establishes the overall bullish trend.
2. The Flag: This is a period of consolidation that follows the flagpole. The price moves sideways or slightly downwards, forming a rectangular or parallelogram-shaped pattern that resembles a flag. This consolidation phase allows the market to digest the initial rally and prepare for the next leg up.
The bull flag pattern is considered a bullish signal because it suggests that the initial uptrend is likely to resume after the consolidation phase. Traders often look for a breakout above the upper trendline of the flag as a confirmation signal to enter a long position.
Bitcoin's Bull Flag Formation
Bitcoin's price chart has exhibited a pattern that closely resembles a bull flag. The flagpole can be identified by the significant upward movement that occurred in the months leading up to June 2025. This rally propelled Bitcoin to a high of $108,000, establishing a strong bullish trend.
Following this rally, Bitcoin entered a period of consolidation, with the price moving sideways and slightly downwards. This consolidation phase has formed a flag-like pattern on the chart, characterized by two parallel trendlines that slope gently downwards.
The formation of this bull flag pattern has led many analysts to believe that Bitcoin is poised for another significant upward movement. The target price for this potential breakout is often calculated by measuring the length of the flagpole and adding it to the breakout point on the upper trendline of the flag. In Bitcoin's case, this calculation suggests a potential target price of around $120,000.
Factors Supporting the Bull Flag Pattern
Several factors support the validity of the bull flag pattern and the potential for Bitcoin to reach $120,000:
• Strong Underlying Bullish Trend: The bull flag is a continuation pattern, meaning that it relies on an existing uptrend to be valid. Bitcoin's price has been in a strong uptrend for several years, driven by increasing institutional adoption, growing mainstream adoption, and limited supply.
• Positive Market Sentiment: The overall sentiment among Bitcoin investors remains positive, despite the recent retreat from $108,000. Many analysts believe that Bitcoin is still in the early stages of its adoption curve and that its long-term potential remains significant.
• Increasing Institutional Adoption: Institutional investors, such as hedge funds, pension funds, and corporations, are increasingly allocating capital to Bitcoin. This increased institutional adoption can drive up the price of Bitcoin and provide a more stable foundation for its long-term growth.
• Growing Mainstream Adoption: Bitcoin is becoming increasingly accepted as a form of payment and a store of value by mainstream consumers and businesses. This growing mainstream adoption can increase demand for Bitcoin and drive up its price.
• Limited Supply: Bitcoin has a fixed supply of 21 million coins. This limited supply makes Bitcoin a scarce asset, which can increase its value over time as demand grows.
• Halving Events: Bitcoin's halving events, which occur approximately every four years, reduce the rate at which new Bitcoins are created. These halving events can reduce the supply of Bitcoin and drive up its price. The next halving event is expected to occur in 2028.
• Macroeconomic Factors: Macroeconomic factors, such as inflation, currency devaluation, and geopolitical instability, can increase demand for Bitcoin as a safe haven asset.
Factors Invalidating the Bull Flag Pattern
While the bull flag pattern is a bullish signal, it is not foolproof. Several factors could invalidate the pattern and prevent Bitcoin from reaching $120,000:
• Breakdown Below the Flag: If the price breaks down below the lower trendline of the flag, the bull flag pattern is invalidated. This would suggest that the consolidation phase is not a temporary pause before another rally, but rather a sign of weakening momentum.
• Negative News and Events: Negative news and events, such as regulatory crackdowns, security breaches, or macroeconomic shocks, could dampen investor sentiment and trigger a sell-off in Bitcoin.
• Weakening Market Fundamentals: If Bitcoin's adoption rate slows down, network activity declines, or transaction volume decreases, it could indicate that the underlying fundamentals are weakening, which could invalidate the bull flag pattern.
• Profit-Taking: After a significant rally, some investors may choose to take profits, which could put downward pressure on the price of Bitcoin and prevent it from breaking out of the flag.
• Alternative Investments: The emergence of compelling alternative investments could divert capital away from Bitcoin, reducing demand and potentially invalidating the bull flag.
Bitcoin Retreats From $108K: A Temporary Setback?
As of June 26, 2025, Bitcoin has retreated from its recent high of $108,000. This pullback has sparked concerns among some investors, but Bitcoin bulls remain optimistic about the long-term prospects of the cryptocurrency.
The recent retreat could be attributed to a number of factors, including profit-taking after a significant rally, regulatory concerns, or macroeconomic headwinds. However, it is important to note that Bitcoin has experienced numerous pullbacks throughout its history, and these pullbacks have often been followed by even stronger rallies.
The key question is whether this pullback is a temporary setback within the bull flag pattern or a sign that the pattern is about to be invalidated. If the price can hold above the lower trendline of the flag and eventually break out above the upper trendline, it would confirm the validity of the pattern and increase the likelihood of Bitcoin reaching $120,000.
Trading the Bull Flag Pattern
Traders who are looking to capitalize on the bull flag pattern can consider the following strategies:
• Entry Point: Wait for a confirmed breakout above the upper trendline of the flag before entering a long position. This helps to avoid false breakouts and increases the probability of a successful trade.
• Stop-Loss Order: Place a stop-loss order below the lower trendline of the flag to limit potential losses if the pattern is invalidated.
• Target Price: Calculate the target price by measuring the length of the flagpole and adding it to the breakout point on the upper trendline of the flag.
• Risk Management: Always use proper risk management techniques, such as limiting the amount of capital you risk on any single trade.
Conclusion
Bitcoin's price chart is currently exhibiting a bull flag pattern, which suggests that the cryptocurrency could be poised for another significant upward movement. The potential target price for this breakout is around $120,000.
However, it is important to note that the bull flag pattern is not foolproof, and several factors could invalidate it. Investors should carefully monitor the price action, market sentiment, and underlying fundamentals to assess the likelihood of Bitcoin reaching $120,000.
The recent retreat from $108,000 is a reminder that Bitcoin is a volatile asset and that pullbacks are a normal part of the market cycle. Whether this pullback is a temporary setback within the bull flag pattern or a sign that the pattern is about to be invalidated remains to be seen.
Ultimately, the future of Bitcoin's price will depend on a complex interplay of technical factors, market sentiment, and fundamental developments. By staying informed and using proper risk management techniques, investors can position themselves to potentially profit from Bitcoin's continued growth and success. As always, remember to consult with a qualified financial advisor before making any investment decisions. The bull flag offers a tantalizing glimpse of potential gains, but prudent analysis and risk mitigation are essential for navigating the volatile world of cryptocurrency.
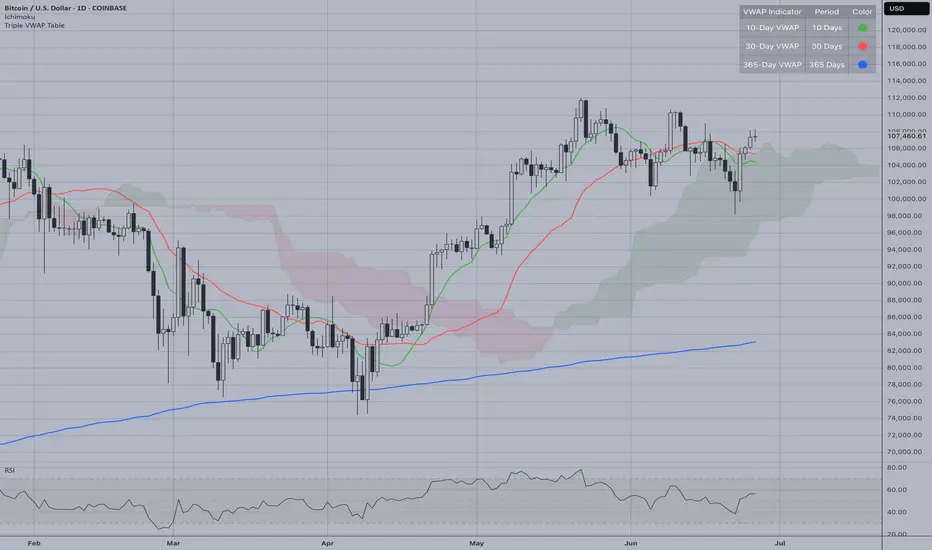
Consolidation Above Key SupportBitcoin (BTCUSD) is currently trading at $107,125 and showing a strong technical setup on the daily timeframe. After the dramatic recovery from March lows around $77,000, BTC has established a solid foundation above the $100,000 psychological level and is now consolidating in a critical resistance zone.
Current Technical Picture:
The price action shows Bitcoin trading above the Ichimoku cloud, which provides strong bullish confirmation. The ascending blue trendline from the March lows remains intact and continues to act as dynamic support around $82,000-85,000. This trendline has been crucial in maintaining the overall upward trajectory.
Key Resistance Levels:
Primary Resistance: $110,000-$112,000 (previous highs)
Secondary Resistance: $115,000 (extension target)
Critical Support Zones:
Immediate Support: $104,000-$105,000 (recent consolidation lows)
Major Support: $100,000 (psychological level + cloud support)
Trendline Support: $82,000-85,000 (ascending blue line)
RSI Analysis:
The RSI is currently hovering around 55-60, indicating neutral to slightly bullish momentum. This suggests there's room for further upside movement without entering overbought conditions.
Trading Outlook:
Bitcoin appears to be setting up for a potential breakout above the $110,000 resistance zone. A sustained break above this level could target $115,000-$118,000. However, failure to break higher and a move below $104,000 could signal a deeper correction toward the $100,000 support zone.
Risk Considerations:
Watch for any breakdown below the ascending trendline or the $100,000 support, as this could invalidate the bullish structure and lead to a retest of lower levels.
index idea number 1 I am indexing an idea for my book. I expect there to be a trade at 22 cm from the control point when the PI cycle closes.

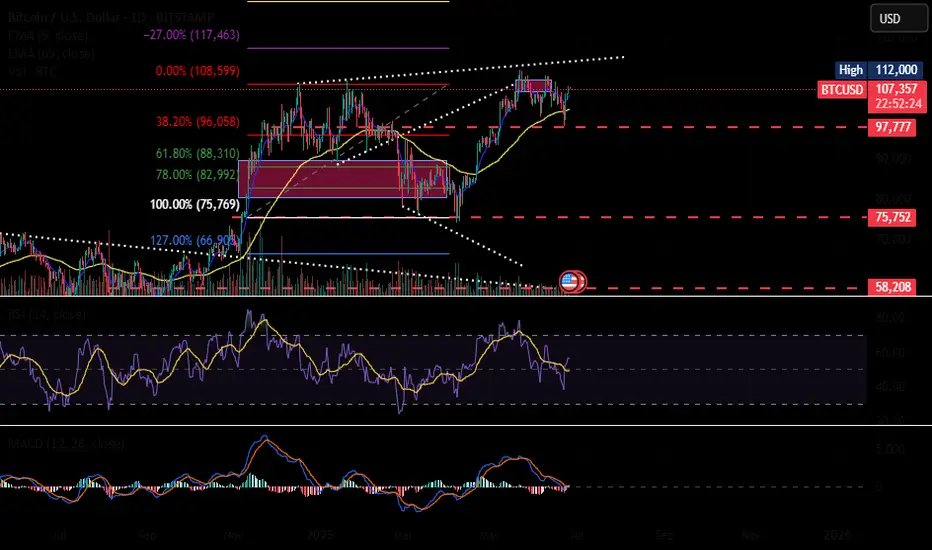
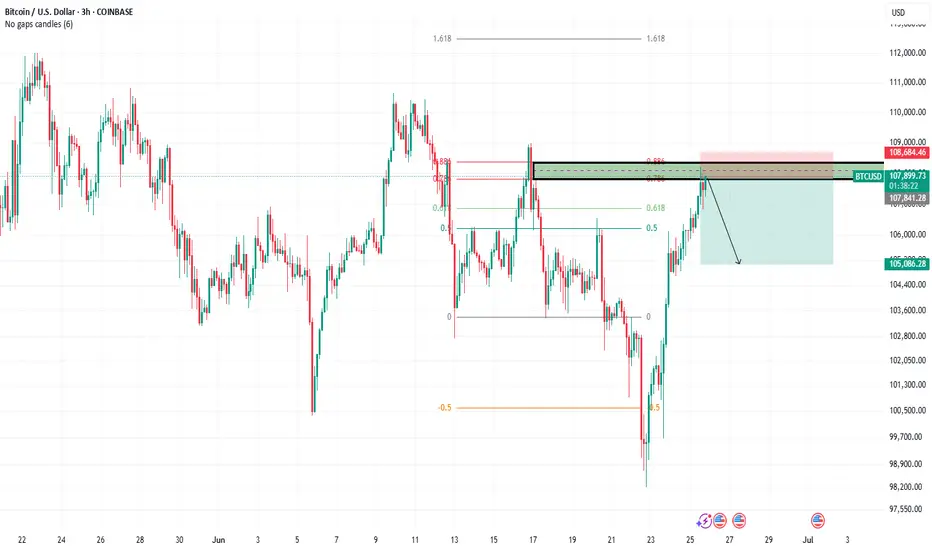
BTC Short Swing Trade Setup with 2.6:1 Risk-Reward RatioBitcoin appears ready for a temporary pullback before another major move toward a new all-time high. This short setup targets a 0.382 Fibonacci retracement and offers a 2.6:1 risk-reward ratio —
Entry at $106,490
Stop Loss at $109,814
Target at $97,700
This is for educational purposes only.

CHECK BTCUSD SIGNAL READ CAPTAIN (sellSetup)
Entry Zone: Around 107500.00\107300.00
Stop Loss: 108450.00
Take Profits:
TP1: ~106500.00
TP2: ~105400.00
Final Target: 104300.00

Signs of Bullish Reversal EmergingAs of today’s close, Bitcoin (BTCUSD) is showing early signs of a potential bullish reversal from a key mid-range Keltner Channel support zone. The recent Heikin Ashi candle reflects a strong recovery after a brief sell-off, with price rejecting lower support levels and closing firmly within the mid-band.
🔹 Key Observations:
Support Zone Respected: Price action respected the mid-Keltner Channel support, suggesting underlying buying interest around the $103k–$104k range.
Momentum Shift: The bullish engulfing nature of the current candle implies a potential shift in momentum, especially after recent consolidation below the upper range.
🔹Trade Idea: TP is near $112k, SL just under $102k.
Continued confirmation above the mid-band and sustained bullish volume will be critical for this move to extend.

Shorts are accumulatingThe number of shorts on the futur market are accumulating ATM . I think The bull flag patern will bring us to the higher high .
this is a testThis is a test am I testing an embed code. this is a test. this is a test. this isa test
BULLISH SENTIMENT ELLIOT WAVE PREDICTION
Wave 2 cannot retrace more than 100% of Wave 1.
It can go deep, but not lower than the start of Wave 1.
Wave 3 cannot be the shortest of the three impulse waves (1, 3, and 5).
Often, Wave 3 is the longest and most powerful.
Wave 4 cannot enter the price territory of Wave 1.
This means no overlap between Waves 1 and 4 in a standard impulse.
Wave 5 must move in the direction of the overall trend.
It completes the five-wave impulse sequence.
BULL FLAG PREDICTION
Strong Uptrend (Flagpole)
Consolidation (Flag)
Measured Move Target - we want to see volume coming out of our consolidation phase. $150k would be a nice ATH CRYPTOCAP:BTC (MAXI)
Market sentiment (IMO) :
The dollar has fallen -10% this year.
- Less Trust in the Dollar. #bitcoin #ethereum #vechain #ada #xrp #ltc
Conflicts overseas usually push prices up because they threaten oil supplies.
-Wars spark spikes in oil, food, gas and metals due to disrupted supply chains. Historically, most commodity prices double during conflicts

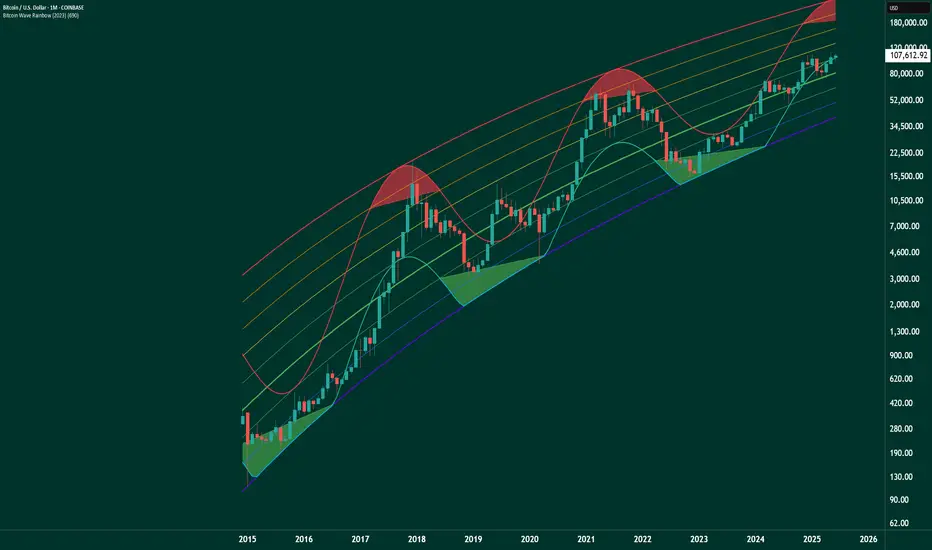
October remains the targetA parabolic move to 200k or higher by October is far from unlikely — we’ve seen it play out before.

BTC?
Hi
BTC HAD moved 10%
I think, very small movement this coming days.
=sideways
It's still bullish , for my trading perspective.
Buyside next week.
G ot to align new setup (if any)
All the best
Not a guru
XRP too..

$BTCCRYPTOCAP:BTC is showing strength as uncertainty grows.
Investors are searching for ways to protect capital and generate yield and crypto liquidity pools are becoming the go-to instrument.
With buyers stepping in above $105K, the momentum could push prices to new highs, drawing more capital into the ecosystem.
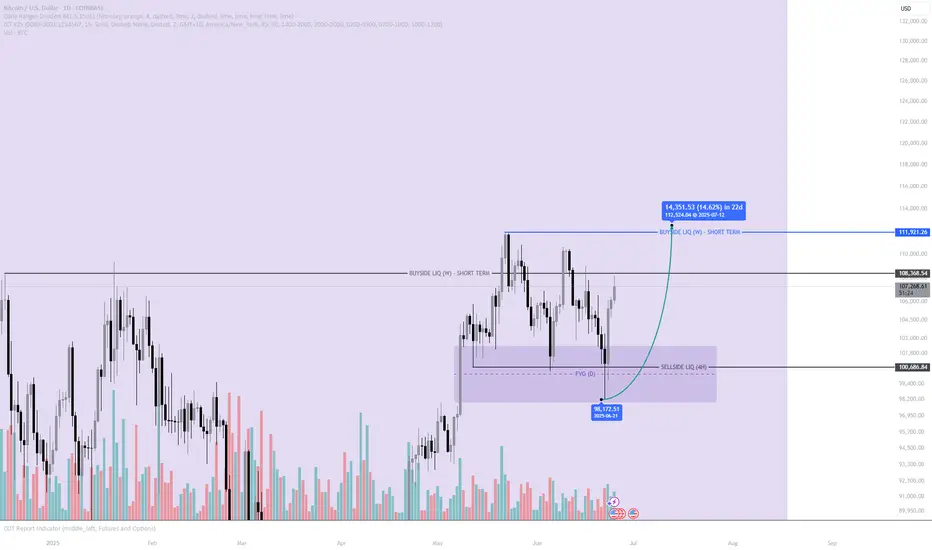
Bitcoin Respecting FVG Again – Is This the Launchpad to 112K+ ?Bitcoin has once again shown strong respect for a key Fair Value Gap (FVG) on the daily timeframe, tapping into a previously identified imbalance around the $98,000 region. This area had earlier acted as a base for bullish structure, and price's return to it suggests re-accumulation by smart money rather than a breakdown. The reaction was swift, rejecting off the FVG and forming a strong bullish daily candle, implying intent for higher prices.
This move into the FVG also swept sell-side liquidity resting below a clear 4-hour equal low. This kind of liquidity grab is a textbook ICT-style move, used to trap retail shorts before a reversal. With that liquidity cleared and institutional interest likely engaged, the structure has shifted bullishly, creating a higher low and showing momentum building to the upside.
The next major upside objective lies at $111,921, which marks short-term weekly buyside liquidity. This area represents a key magnet for price — where many stop-losses and buy-side orders are likely stacked — making it a logical destination for a move upward. The projected move offers a potential 14.6% upside over the next few weeks.
If price can hold above the $106K-$108K zone, the probability increases that we’re witnessing the beginning of a broader impulsive leg toward the $112K region. However, failure to maintain bullish structure here could mean deeper accumulation is still unfolding. As always, this setup should be approached with discipline, and further confirmation should be sought using your own risk model and strategy.
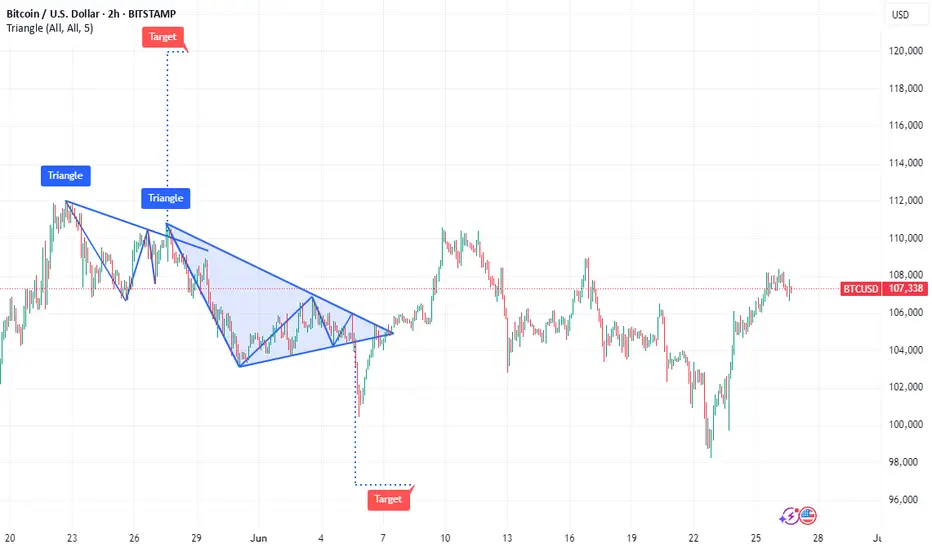
Descending broadening wedge after peak BTC/USD 4hCurrently BTC/USD is in a descending broadening wedge after a peak.
This means high chance of upward breakout. Price increase from breakout point is usually the difference from pattern top to pattern bottom, which would mean a price of $123000.
Not financial advice. There is a chance of this not playing out, even though the chance is small.

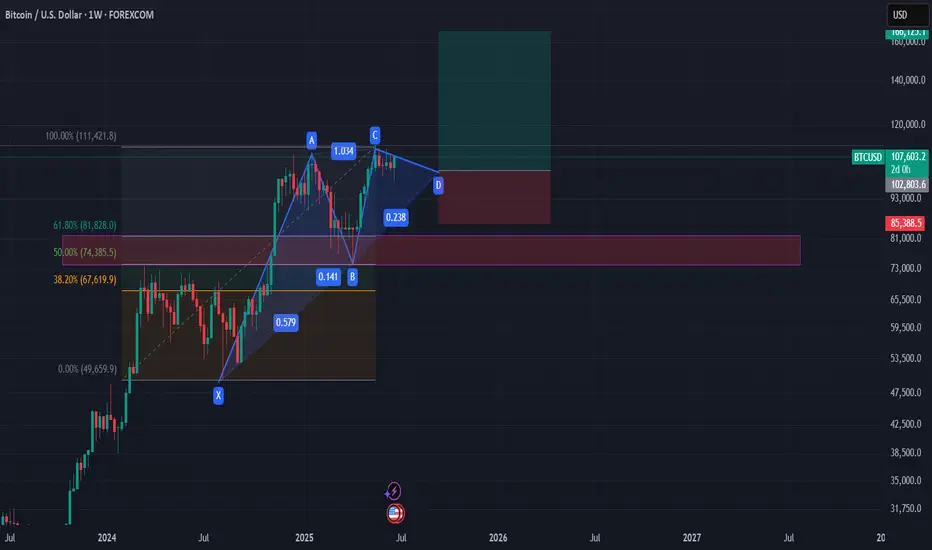
XABCD pattern with strong confirmation on Golden Zone of Fibo?XABCD pattern with strong confirmation on Golden Zone of Fibo?
I im strong bullish i think we are in the D Wave and then we gonna have some Pump IMO
do your own research
btc 5th wave of elliot wave?im still bullish on Btc i think we are in the last and 5th wave that will be in the next 3-4 months , and then blood in the streets for a huge bear market.
DYOR

SELL BTCUSD NOW🚨 TRADE ALERT:
SELL BTCUSD NOW 💥📉
🔻 Market showing bearish signs.
🎯 Set your TP (Take Profit) levels wisely.
🛡️ Use SL (Stop Loss) to manage risk.
📊 Confirm with your strategy before entry.
BTC continues to short at high levels during the day📰 Impact of news:
1. Geopolitical impact
📈 Market analysis:
BTC has reached an intraday high of 108,125, just one step away from the all-time high of 112,000. With the increase in trading volume and institutional sentiment turning bullish, the momentum seems to be in the bulls' favor. In addition to institutional buying, the ceasefire agreement in the Iran-Israel war is also an important factor in Bitcoin's sharp rebound. Trump's announcement of the end of the war almost immediately triggered a surge in the cryptocurrency market. However, the overall pattern has not changed, and the range resistance has not been broken, so we still keep the idea of shorting at high levels.
🏅 Trading strategies:
SELL 108000-107500
TP 104500-103500
If you agree with this view, or have a better idea, please leave a message in the comment area. I look forward to hearing different voices.

CHECK BTCUSD SIGNAL READ CAPTAINbtcusd sell now ✅
entry point (107600.00) (107400.0)
TAKE PROFIT 1: (106600.00)
TAKE PROFIT 2: (105300.00)
LAST TARGET(104200.00)
STOP LOSS (108400.00)

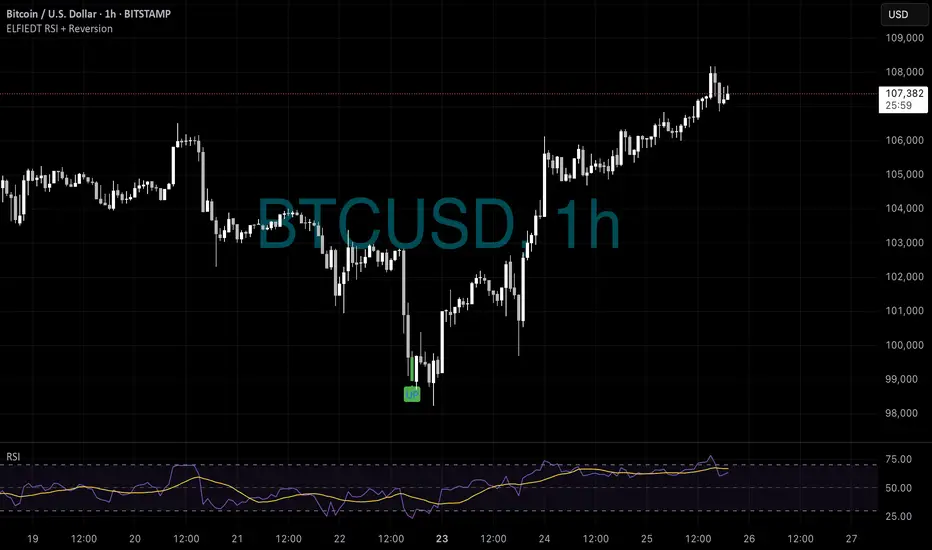
BTC - Longs???₿ Perfect Bitcoin Long from the Bottom
Instrument: Bitcoin (BTCUSD)
Timeframe: 1-Hour
Date: 22 June 2025
Indicator: ELFIEDT RSI + Reversion
🔍 The Setup:
After a sharp selloff, Bitcoin printed an “UP” signal just as price reached local exhaustion near the $100,000 zone.
While fear was high and momentum pointed downward, ELFIEDT detected the reversal conditions forming — and flagged the shift before any breakout was visible.
📈 The Result:
From the moment the “UP” signal appeared, BTCUSD launched into a clean rally — climbing over $7,000 in just a few days.
Traders who followed the signal saw:
✅ A low-risk entry from the bottom
✅ No chasing required
✅ A strong, clean uptrend with minimal drawdown
The early signal was key — while most were still bearish, ELFIEDT was already long.
📌 Key Takeaway:
ELFIEDT didn’t predict the news. It didn’t follow the herd.
It simply reacted to what the market was truly showing: an extreme condition with reversal potential.
The result was a near-perfect long.
🚀 Trade What You See, Not What You Feel
BTC’s bounce wasn’t random — it was algorithmically identified by ELFIEDT.
Your edge is in the data. Let the system guide you.
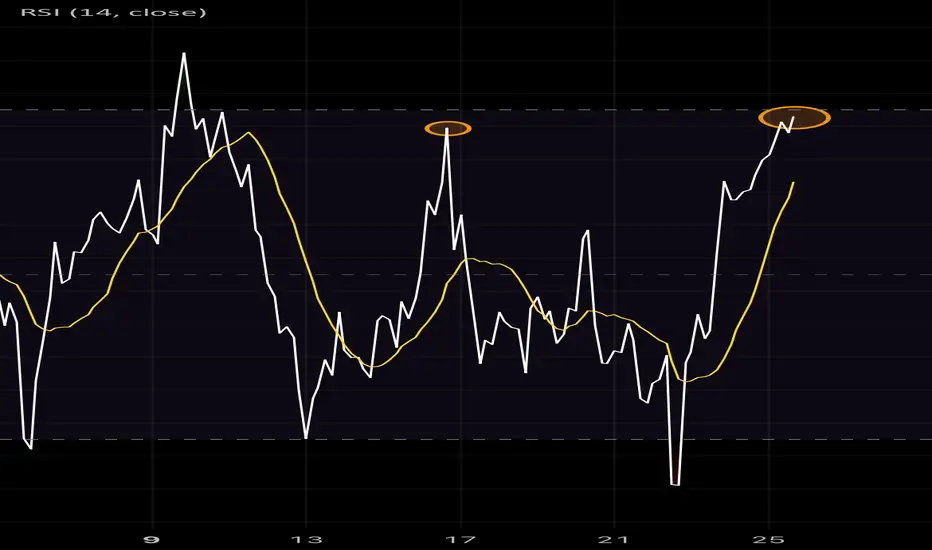
RSI High High 4HR RSI making a higher high breaking the Bear downtrend .
There is also an inverse head & shoulders and also price back inside the Bull pennant on the 1D .