BTC: Expanded FlatThe weekly matches up with an expanded flat (middle of diagram), if true forecast has BTC bouncing back.
BTCUSD trade ideas

BTCUSDScenario A – Bullish Continuation
Entry (Long): If price bounces from 118500–118575 and closes above EMA9 with bullish candle.
Stop Loss: Below 118450.
Take Profit 1: 118950 (previous high).
Take Profit 2: 119150 (supply zone top).
Confirmation: RSI > 55 and bullish volume.
Scenario B – Bearish Pullback
Entry (Short): If price closes below 118450 and retests it as resistance.
Stop Loss: Above 118600.
Take Profit 1: 118000 (demand zone).
Take Profit 2: 117850 (next BOS zone).
Confirmation: RSI < 45 and strong bearish candle.


BTCUSD - Important signals and levelsMarket Dynamics and Trend
Current price is around $118,558, +1.18% per session. Daily range: $116,468 – $118,655.
The trend remains bullish despite the consolidation period below $120,000. Institutional interest and stable buying pressure support further gains.
Important signals and levels
A large purchase of 274 BTC (~$32 million) is a signal of large institutional demand, which often precedes volatility spikes. Monitor funding dynamics and volumes.
Capital activity - BTC is held above $114,500 due to inflows into crypto instruments; this strengthens the bullish sentiment.
Cup and Handle Pattern + Bullish MACD - Technical analyst Katie Stockton expects a raid to $134,500 (~14% upside from current levels) due to a breakout of a new ATH.

BTC ALERT Daily chart shows a flag & pole pattern in play. If BTC smashes through $121K, momentum could carry it straight towards $125K. Eyes on the breakout — this could get spicy! 🔥📈

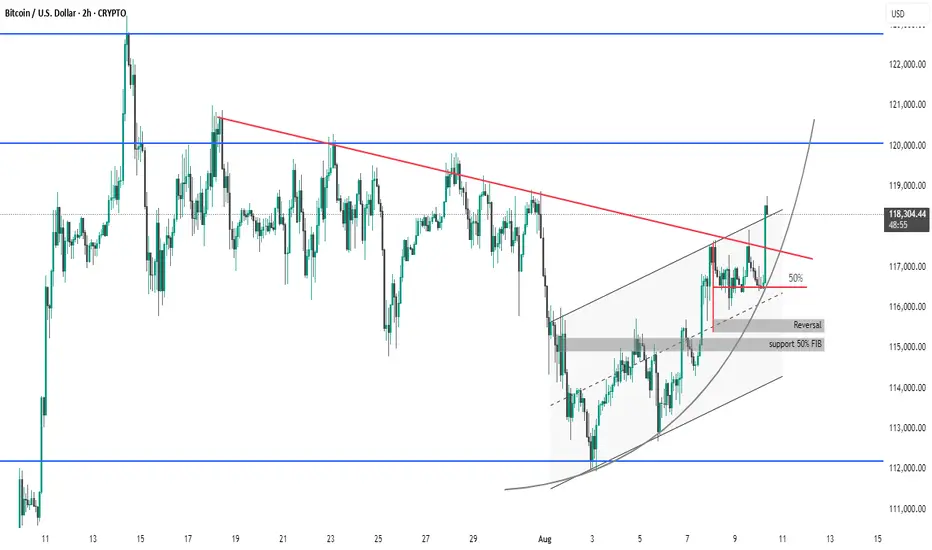
BTC #Bitcoin (BTC/USD) 2-hour chart presents several key technicBitcoin (BTC/USD) 2-hour chart presents several key technical observations:
Breakout Confirmed: Price has successfully broken above the descending red trendline, signaling a potential bullish breakout.
Ascending Channel: BTC is trading within an upward-sloping channel, indicating a strong short-term uptrend.
Support Zones: Multiple supports around $115,000 are identified, including:
50% Fibonacci retracement
Previous reversal zone
Momentum: The current price action has surged past the 50% midline of the channel and is targeting higher resistance levels around $120,000.
Curved Trendline: An upward parabolic curve suggests accelerating bullish momentum.
Summary: Bitcoin is showing strong bullish momentum after breaking key resistance. Watch for a potential retest of the breakout level (~$117,000) before a move higher.
thanks you

BTC - Possible Bullish bounce after a retracementBTC price has been falling on low volume in a down channel which may trigger interest in bulls looking to enter at a better price on a retracement. Await for an increase in volume to confirm the breakout from the channel in either direction.

$BTC Finally Historical Profit Done at $123K Price of ATH CRYPTOCAP:BTC tying to push price upward movement and if it's Breakout the $120K-$122K Price Level area than it could be reached $128K - $136K price level area.
I'm guess it will be happened. Always Pattern indicate and say price movement of Bitcoin. I was many Prediction of popular coin and i will succeed in 2025. I'm long term analyst of long term investment of Traders.
🚦From News: Bitcoin Holds Firm Above $115K Support as Charts Point Toward $150K Target
Bitcoin holds above $115K support with charts pointing to a potential $150K Elliott Wave target.
Hashrate hits all-time high as energy value model places BTC valuation 45% above current price.
U.S. policy shift enables 401(k) crypto access, opening a $9 trillion market for Bitcoin adoption.
Bitcoin has held firm above the $115,000 support and is now showing signs of a large move on the charts. Price patterns and rising adoption trends are aligning as BTC prepares for a possible rally. At the time of writing, BTC was trading at $116,620, showing steady upward momentum.
Technical Structure Points Toward Upside Continuation
According to an analysis prepared by Lau, Bitcoin has taken the $115,000 support and may be preparing to break its all-time high. On Binance, the BTC/USDT daily chart displays a breakout from resistance near $116,438.79. The price reached a new high before retracing to $111,917.37, where it found support.
BTC’s price structure continues to show higher lows, aligning with the Elliott Wave pattern that targets $150,000. Key support levels remain at $98,385.45 and $89,326.51, confirming a strong technical base. According to Daan Crypto Trades, Bitcoin is steadily rising toward the $120,000 zone, where a cluster of stop losses and liquidation points may fuel further upside.
The current bullish flag formation is still intact, supported by the 50-day SMA at $113,154. The RSI has moved to 54, indicating recovering momentum without being overbought. Analysts view a break above $117,350 as a key signal for another upward push.
On-Chain Metrics and Market Drivers Support Growth
Bitcoin’s energy value stands at $167,800, which is around 45% above the current market price. According to Charles Edwards, founder of Capriole Investments, “Hash rates are flying and Bitcoin Energy Value just hit $145K.”
This model links BTC’s value to miner energy inputs and network security. Bitcoin’s hashrate reached an all-time high of 1.031 ZH/s on August 4, based on data from Glassnode. Alongside this, adoption is growing in the U.S. market.
President Trump’s policy allowing 401(k) crypto inclusion has opened a $9 trillion market. Crypto-linked equities and ETFs have also seen strong inflows, supporting long-term price action.
#highlights #everyone #premium #BinanceSquareFamily #Binance #BTC☀ #SUBROOFFICIAL
Disclaimer: This article is for informational purposes only and does not constitute financial advice. Always conduct your own research before making any investment decisions. Digital asset prices are subject to high market risk and price volatility. The value of your investment may go down or up, and you may not get back the amount invested. You are solely responsible for your investment decisions and Binance is not available for any losses you may incur. Past performance is not a reliable predictor of future performance. You should only invest in products you are familiar with and where you understand the risks. You should carefully consider your investment experience, financial situation, investment objectives and risk tolerance and consult an independent financial adviser prior to making any investment.


BTC USDHI GUYS,
For those that are following BTC USD movements we are all in.
Anyway all moves are accurate from day 1 on BTC USD. THIS NO SHOW OFF,its real.
The chart above shows h4 structure and today sells are legit on H2, H1 double top (DT)

BTC/USD – Double Scenario PlayPrice is now testing the Day High supply zone (117,644). Two possible plays from here:
1️⃣ Bullish Continuation – Clean breakout above 117,644 could fuel a rally straight into the 118,800 OB.
2️⃣ Deeper Retracement – Rejection at supply could send price back into the 116,660 OB Buy Zone for liquidity grab before a major push up.
Key Levels:
Resistance: 117,644 / 118,800 OB
Support (Buy Zone): 116,660 – 116,400 OB/POI
Bias: Bullish as long as 115,907 (Day Low) holds
📌 Plan your entries based on reaction at the supply zone — breakout or rejection will set the tone for the next big move.

BTC/USD – Eyes on the Next Breakout BTC is holding strong bullish momentum above 116,660 📈. Liquidity is building, and a quick pullback into the OB buy zone could be the last chance before we push towards Day High (117,644) and beyond to the 118,800 supply zone.
💡 Smart money loves this setup: grab liquidity, load positions, and ride the breakout.
This is where the big moves happen — don’t blink or you’ll miss it.
🎯 Buy Zone: 116,660 – 116,000 OB
🎯 Targets: 117,644 / 118,800 OB
⚠️ Invalidation below 116,000
🔥 Get ready — the market’s about to move fast.

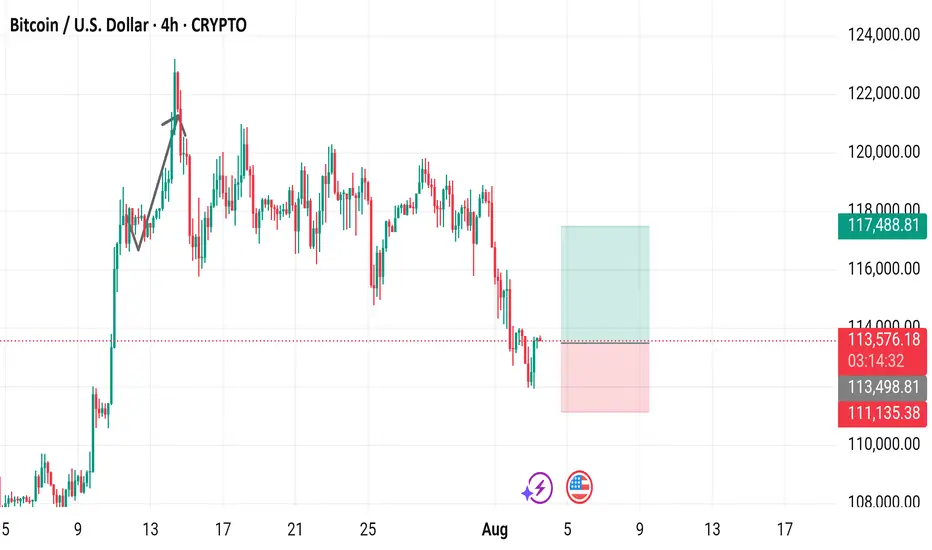
Bitcoin / U.S. Dollar 4-Hour Chart (BTCUSD)4-hour chart displays the price movement of Bitcoin (BTC) against the U.S. Dollar (USD) from late July to August 3, 2025. The current price is $113,570.31, with a 24-hour change of +$1,064.77 (+0.95%). The chart shows a recent upward trend followed by a sharp decline, with key levels marked at $113,570.31 (buy/sell price) and $111,135.38 (support level). The trading volume and price range are highlighted, with a notable drop below the $113,570.31 level as of 03:16:00 on the chart.
Bitcoin analysisBitcoin tapped in weekly FVG and we had rejection from it, so we can clearly see no bearish signs on Bitcoin
My target is long towards the untaken liquidity

#BitcoinDate: 03-08-2025
#Bitcoin Current Price:113646
Pivot Point: 112812 Support: 111359 Resistance: 114274
Upside Targets:
🎯Target 1: 115329
🎯Target 2: 116384
🎯Target 3: 117724
🎯Target 4: 119063
Downside Targets:
🎯Target 1: 110300
🎯Target 2: 109240
🎯Target 3: 107901
🎯Target 4: 106561
#TradingView #Nifty #BankNifty #DJI #NDQ #SENSEX #DAX #USOIL #GOLD #SILVER
#BHEL #HUDCO #LT #LTF #ABB #DIXON #SIEMENS #BALKRISIND #MRF #DIVISLAB
#MARUTI #HAL #SHREECEM #JSWSTEEL #MPHASIS #NATIONALUM #BALRAMCHIN #TRIVENI
#USDINR #EURUSD #USDJPY #NIFTY_MID_SELECT
#SOLANA #ETHEREUM #BTCUSD #MATICUSDT #XRPUSDT
#Crypto #Bitcoin #BTC #CryptoTA #TradingView #PivotPoints #SupportResistance

BTC USD✅ Validated Trade Plan Adjustments:
Immediate Action (Current Price: $116,808)
Price is testing resistance ($116,700–$117,100).
DO NOT BUY here – risk of rejection is high.
Watch for:
🟢 Breakout confirmation: Close above $117,100 → Long to $118,000+.
🔴 Rejection signal: Bearish candle + RSI drop → Short target $116,100.
Updated Scenarios
Breakout Above $117,100 (New Entry):
Trigger: 15-min close > $117,100 + volume surge.
Entry: $117,120–$117,150.
Stop Loss: $116,900.
Target: $118,000 (scalp), then $118,415–$118,820.
Rejection at Resistance (Short Setup):
Trigger: Bearish pin/reversal candle at $116,700–$117,100 + RSI < 45.
Entry: $116,650–$116,700.
Stop Loss: $117,150.
Target: $116,100 (support), then $115,870.
Support Bounce Trade (Unchanged):
Trigger: Dip to $116,045–$116,100 + bullish reversal candle.
Stop Loss: $115,750.
Target: $116,700–$117,100.
🚨 Critical Notes:
Ignore $118,415–$118,820 "Squouts":
This appears to be a data error (likely mislabeled resistance). Support cannot be above current price.
Monitor RSI: Currently neutral (51.64) → Breakout/rejection will clarify direction.
Key Risk: Close below $115,870 invalidates bullish structure → Target $115,500.
📊 Execution Summary:
"Wait for breakout above $117,100 (long) or rejection at resistance (short). Original support ($116,100) remains valid for longs, but avoid buying near current resistance."
Verify volume on breaks – false breakouts are likely in this zone

Thank me later buoysMore magical lines I have drawn for all to bear witness, praise me.
Follow for more wizard prophetics. I was homeschooled

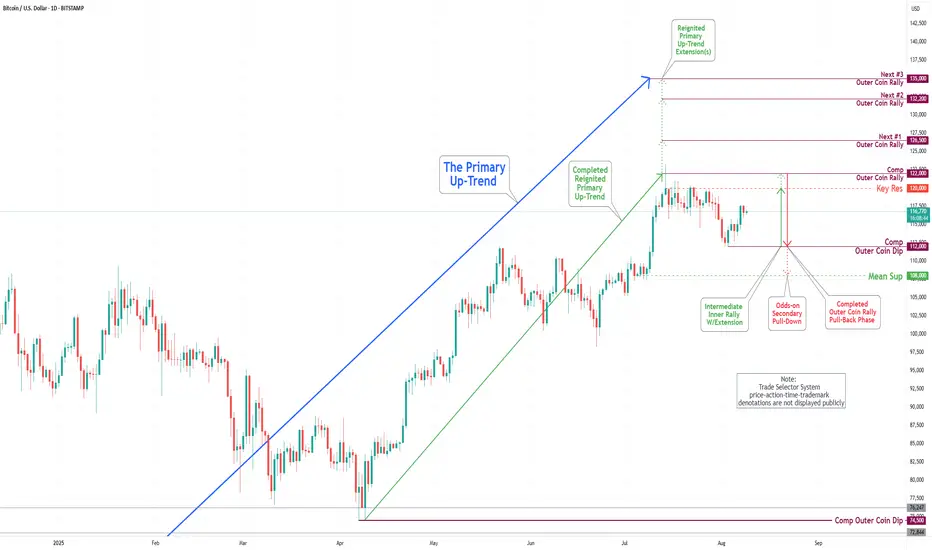
Bitcoin(BTC/USD) Daily Chart Analysis For Week of August 8, 2025Technical Analysis and Outlook:
During this week's trading session, the Bitcoin market demonstrated significant resilience, recovering from our Mean Support level at 113,000 and completing the Outer Coin Dip at 112,000. Current analysis also suggests that the cryptocurrency is attempting to retest the completed Outer Coin Rally at 122000 and the critical Key Resistance level at 120000. Conversely, on the downside, Bitcoin may seek to revisit the completed Outer Coin Dip at 112000, with the potential to extend toward the Mean Support level of 108000 before continuing its bullish trajectory.
MovementsBTC is at a binary point on the weekly chart consolidating at oversold levels and bearish divergence. But here on the lower timeframe there is possibly a bullish consolidation in the form of an ascending triangle. Bulls need to maintain the trendline and clear 117,000 price area, the bears ultimately want 115,900 prices.
Please be careful of fakeouts and be patient. Please observe key levels and always do your own TA. Thank you for hitting the like and your positive feedback.

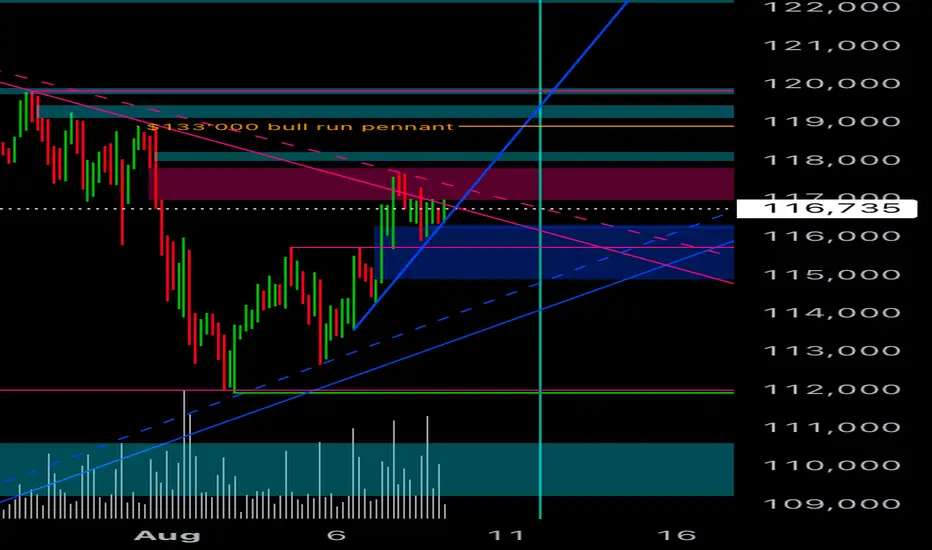
Highway Star$133’000 bull run pennant above $119’000.
Shift above all time accurate trend lines. We are at the beginning of exponential vertical segment. Strong rising front at $115’700.
Bitcoin institutional demand continues to outpace new supply, with 545,579 CRYPTOCAP:BTC purchased year-to-date compared to only 97,082 CRYPTOCAP:BTC in new supply.
The volumes were bought on July 15 and 25 for 116,000 and 115,000 respectively. So I think we are waiting for 119,000 to launch above all time high.
BTCUSD is forming bullish flag patternBTCUSD is forming bullish flag pattern. Any postive news will be Triiger for its upside breakout
