Bitcoin-Potential bullish bounce off an overlap supportBitcoin (BTC/USD) is falling towards an overlap support and could potentially bounce off this level to climb higher.
Buy entry is at 106,535.50 which is an overlap support that aligns with the 23.6% Fibonacci retracement.
Stop loss is at 104,600.00 which is a level that lies underneath a swing-low support and the 38.2% Fibonacci retracement.
Take profit is at 108,808.50 which is a multi-swing-high resistance.
BTCUSD trade ideas

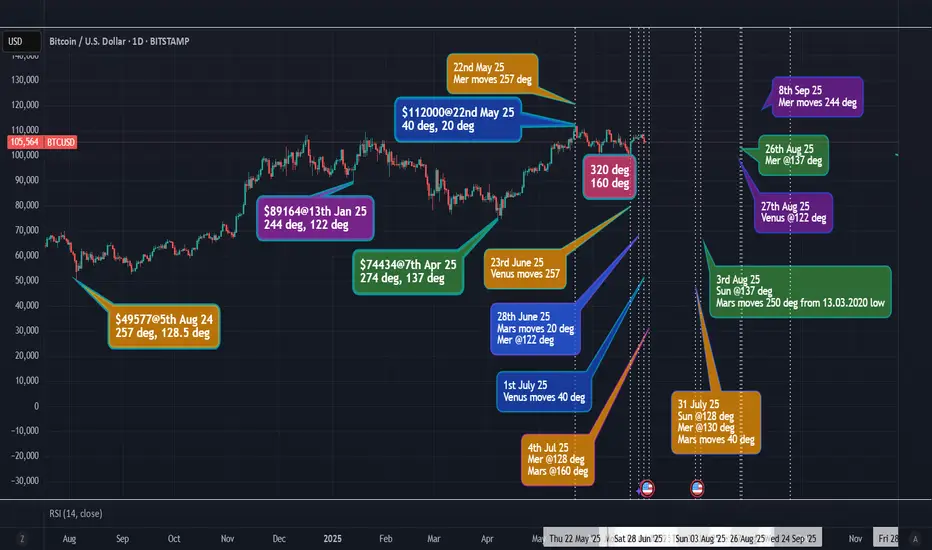
BTC - change in trend - GANN's price = planetary long/movesThis is based on GANN's price squaring planetary longitude and planetary movements. The color-coding is to match the price in degree with the expected future dates for change in trend marked on the chart.
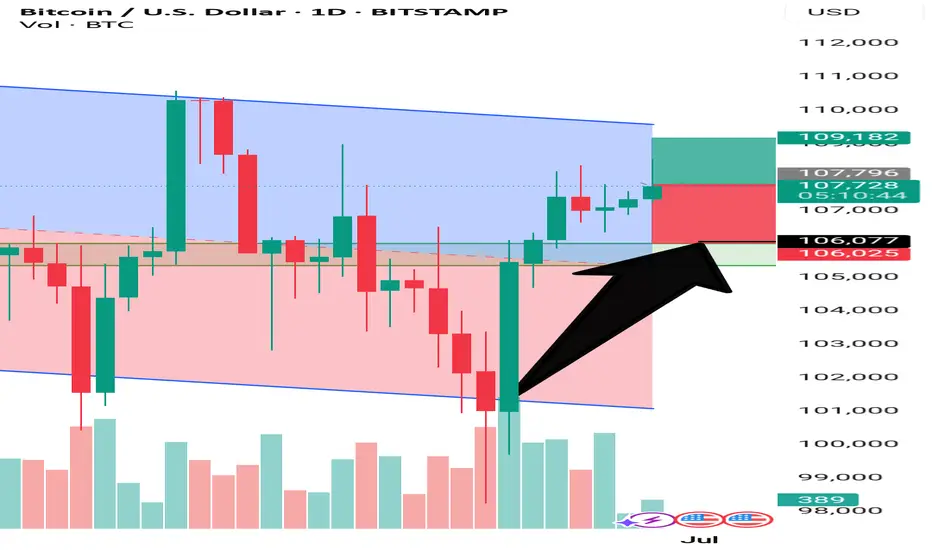
Title: BTC Rejected at Channel Top – Downside Risk BuildsText:
Bitcoin is showing signs of rejection from the top of the descending channel near the 109k region. With selling pressure increasing and price struggling to break higher, there’s a strong probability of a downward move. If support around 106k fails, BTC could revisit previous lows and potentially head toward the sub-1M zone ("Azad"). Caution is advised as the market may be preparing for another bearish wave.
BTCUSD – Rejection or Reload?BTC surged from $105K to above $110K in one of the strongest single-day impulses lately. Price is pausing at resistance near $110,300 with a minor pullback in play. The structure remains intact unless it drops below $108,600. Above $110,300 would unlock next leg higher.

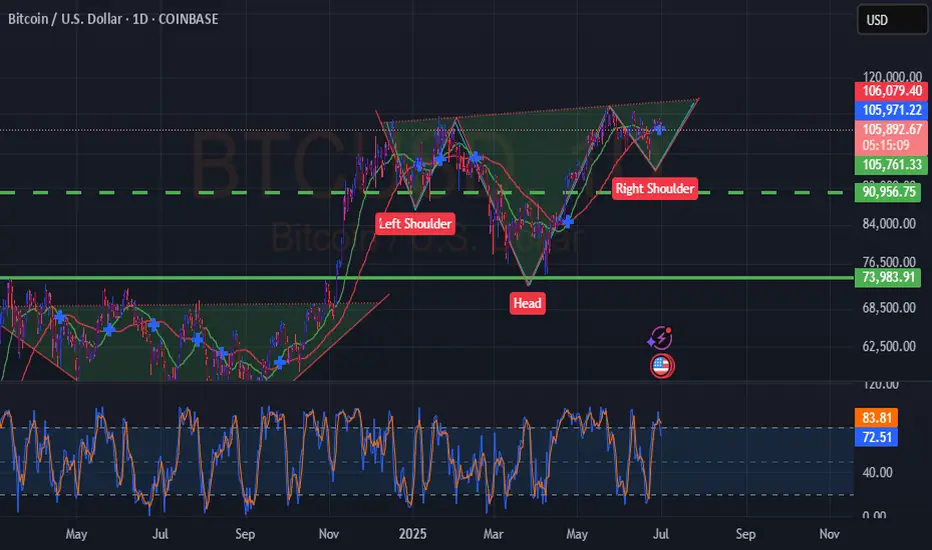
Btc Usd IH&SHi all. BTC is in an IH&S on top of a larger IH&S pattern it seems. Pullback to 96K possible. But looking good for longer term trades. I'm sure this will pump, not 70K as most are saying, 90K is the lowest for now imo. Not financial advice. Please do your own research. Please leave a like, some motivation for an update. Good luck with your next trade.
Is Bitcoin Still a Hedge? What the Iran Israel Conflict RevealsAs geopolitical tension between Iran and Israel escalates, markets are once again gripped by fear. Oil prices have surged, gold has rallied, and investors are rebalancing portfolios in anticipation of further instability. Amidst this backdrop, Bitcoin's behavior is raising fresh questions about its role as a geopolitical hedge.
Bitcoin’s Initial Reaction: A Spike and a Slip
When the first reports of conflict broke, Bitcoin spiked alongside gold. Many hailed this as proof that BTC was becoming a reliable safe haven. However, just days later, prices retraced by roughly 6 to 7 percent as volatility intensified.
As usual, Bitcoin is still highly sentiment driven. While gold held its gains, BTC mirrored risk on assets with intraday volatility, undermining its hedge narrative.
BTC vs. Traditional Safe Havens
Let’s compare Bitcoin’s performance to:
• Gold: Continued upward trend, record ETF inflows
• Oil: Strong rally due to supply shock fears
• USD: Moderate gains as a traditional reserve asset
Bitcoin’s pullback during peak uncertainty suggests that in times of extreme stress, traditional assets still dominate flight to safety behavior.
What the On Chain Data Shows
Interestingly, on chain activity also hints at caution. Exchange inflows increased slightly after the conflict news, suggesting profit taking or reduced conviction among holders.
Moreover, stablecoin volume spiked in Middle Eastern regions — a signal that users may prefer capital preservation over speculation during geopolitical risk.
The Takeaway: Not There Yet
Bitcoin is maturing, and its response to global events is evolving. But this conflict reveals it is not yet a full fledged hedge like gold or the dollar.
For investors, the lesson is clear: BTC can act as a partial hedge in medium term macro trends, but during sharp geopolitical escalations, traditional assets still lead.
What Do You Think?
Is Bitcoin still on track to become a true safe haven asset? Or will it remain a risk sensitive speculative instrument?

Bitcoin Supply Shock Is No Longer a Theory, But a Reality
In the intricate and often frenetic world of digital assets, the market is constantly sending signals. Some are loud, ephemeral flashes of volatility that capture headlines for a day. Others are quiet, seismic shifts that build slowly beneath the surface, unnoticed by the masses until they erupt with earth-shattering force. Today, the Bitcoin network is broadcasting one of these profound, underlying signals. It speaks of a disappearance, a vanishing act on a scale never before seen, pointing toward a supply shock so significant that it threatens to redefine the very concept of price discovery for the world’s premier cryptocurrency.
The paradox currently facing market observers is the disconnect between Bitcoin’s somewhat range-bound price, which has struggled to decisively conquer the territory above $120,000, and the tectonic movements occurring in its fundamental market structure. While the price action might suggest a market in equilibrium, a state of indecisive calm, the data tells a story of immense and growing tension. It is a story of a collision course between two unprecedented forces: a relentless, programmatic wave of institutional demand and a rapidly dwindling, fiercely guarded supply.
The central piece of evidence, the smoking gun for this impending crisis, is the state of Bitcoin reserves on cryptocurrency exchanges. These platforms, the bustling marketplaces where buyers and sellers meet, have seen their Bitcoin inventories plummet to a seven-year low. Less than 15% of the total circulating Bitcoin supply now resides on these exchanges, a figure that is as statistically stark as it is historically significant. This isn’t merely a data point; it is a profound statement of intent from the global cohort of Bitcoin holders. It signifies a monumental shift from short-term speculation to long-term conviction, a collective decision to withdraw assets from the realm of immediate liquidity and into the deep, fortified vaults of cold storage. This great disappearance is the quiet prelude to a very loud event, and to understand its implications, one must dissect the powerful forces of both supply and demand that are pulling the market to its breaking point.
The Vanishing Act: Where Has All the Bitcoin Gone?
To grasp the gravity of the dwindling exchange reserves, one must first understand the role of an exchange in the life cycle of a Bitcoin. An exchange is a trading floor. Assets held there are, by their very nature, liquid and available for sale. A holder who moves their Bitcoin onto an exchange is signaling an intent to trade or sell, either immediately or in the near future. Conversely, moving Bitcoin off an exchange and into a personal, self-custodied wallet—often called cold storage—is a deliberate act of preservation. It is a declaration that the owner has no immediate intention of selling. They are choosing to become a long-term holder, a saver, effectively removing their coins from the active, tradeable supply.
For years, the flow of Bitcoin onto and off of exchanges has served as a reliable barometer of market sentiment. During the euphoric peaks of past bull markets, a predictable pattern emerged: as prices soared, a flood of Bitcoin would move onto exchanges as long-term holders finally decided to take profits. This influx of supply would help to satisfy the frenzied buying demand, eventually capping the rally and leading to a market correction.
This cycle, however, is fundamentally different. The opposite is happening. Despite prices reaching new all-time highs, the flow has been overwhelmingly outward. Coins are leaving exchanges at a historic pace, creating a supply-side vacuum. This exodus is not a new phenomenon, but the acceleration over the past 18 months has been breathtaking. It reflects a maturing market and a hardened investor base that has learned the lessons of previous cycles. They have witnessed Bitcoin’s resilience, its ability to weather brutal bear markets and emerge stronger each time. They are no longer content with selling for a 5x or 10x profit, only to watch the asset climb another tenfold in the subsequent years. They have transitioned from treating Bitcoin as a speculative trade to embracing it as a long-term savings technology, a digital store of value in an increasingly uncertain macroeconomic world. The coins are not lost; they have simply gone home, locked away by owners who have no interest in selling at today’s prices.
The Wall Street Leviathan: A New and Insatiable Source of Demand
While the available supply of Bitcoin has been quietly disappearing into private wallets, a new and powerful predator has entered the ecosystem, armed with an insatiable appetite. The launch of spot Bitcoin Exchange-Traded Funds (ETFs) in the United States marked the single most significant structural change in the history of the Bitcoin market. These regulated financial products, offered by the largest asset managers in the world, have constructed a permanent, one-way bridge connecting the traditional financial system to the digital asset space.
This bridge is not for casual tourism; it is a superhighway for capital. The ETFs, led by BlackRock’s behemoth iShares Bitcoin Trust (IBIT), have unleashed a torrent of institutional and retail money that is systematically draining the remaining available supply. The mechanics of these ETFs are crucial to understand. Unlike futures-based products, a spot ETF must acquire and hold the underlying asset—in this case, real Bitcoin—to back the shares it issues to investors. This means that for every dollar that flows into an ETF like IBIT, its managers must go into the open market and buy a corresponding amount of Bitcoin.
The scale of this operation is staggering. In a stunning testament to the demand for this new product, BlackRock’s Bitcoin ETF has, in its short 18-month existence, begun to generate more revenue from annual fees than its long-established and immensely popular S&P 500 fund. This is not a niche product for crypto enthusiasts; it is a mainstream financial blockbuster, attracting billions from investors seeking a simple, regulated way to gain exposure to Bitcoin.
This creates a relentless, programmatic buying pressure that the market has never before had to absorb. Every single trading day, the ETFs collectively purchase a significant amount of Bitcoin. This demand is constant and largely price-agnostic. It is driven by asset allocation decisions, not short-term market timing. This programmatic buying acts like a giant hydraulic pump, sucking up any loose supply available on exchanges. The daily demand from these Wall Street giants often outstrips the new supply of Bitcoin created by miners, creating a structural deficit that can only be filled by one source: the existing coins held by others. And as we’ve seen, those holders are increasingly unwilling to part with their assets.
The Diamond-Handed Super-Majority: A Trillion-Dollar Standoff
The collision between the insatiable demand of the ETFs and the shrinking available supply raises a critical question: why aren't the existing holders selling? With so much new money flooding into the market, basic economics would suggest that the rising price should entice current owners to sell and realize their gains. Yet, the data reveals a fascinating psychological standoff.
According to research from the on-chain analytics firm Glassnode, a "super-majority" of Bitcoin holders are currently sitting on a colossal $1.2 trillion in unrealized profits. This means that a vast portion of the network acquired their coins at prices far below the current level and are deep in the green. In any other market, such a massive overhang of profit would be seen as a significant risk, a powder keg of potential sell pressure waiting to be ignited.
But in the world of Bitcoin, it has become a fortress of conviction. Glassnode’s analysis concludes that the current price, even in the six-figure range, "is not compelling enough for investors to continue selling." This is a revolutionary insight into the mindset of the modern Bitcoin investor. Their price targets have shifted dramatically. They are not looking to sell at $120,000 or even $140,000. For many, these levels are seen as mere stepping stones on the path to a much higher valuation, one that properly reflects Bitcoin’s role as a global, non-sovereign store of value.
Further research into profit-taking behavior confirms this trend. The amount of realized profit—that is, coins being sold at a gain—in the current cycle has yet to match the levels seen during the peak of the 2024 rally. This suggests that the holders who were willing to sell at those prices have already done so. The remaining cohort is composed of the most steadfast believers, the "diamond hands," who are holding out for a much more significant repricing. Some analyses suggest that the Bitcoin price would notionally need to rise another 30%, toward the $140,000 mark, just to reach a point where this cohort even begins to feel tempted to part with their holdings in a meaningful way. This creates a powerful reflexive loop: the less they sell, the less supply is available, and the more explosive the potential price move when demand continues to pour in.
The Macroeconomic Perfect Storm
The conviction of Bitcoin holders and the flood of institutional capital are not occurring in a vacuum. They are a direct response to a global macroeconomic environment that is creating a perfect storm for a hard, scarce asset. The primary driver of this is the unprecedented expansion of the global money supply. The M2 money supply—a broad measure of currency that includes cash, checking and savings deposits, and money market funds—has reached a record high.
Governments and central banks around the world have engaged in years of quantitative easing and fiscal stimulus, effectively printing trillions of dollars to prop up their economies. While often necessary in the short term, this relentless monetary expansion has a corrosive long-term effect: it debases the value of fiat currencies. As the supply of dollars, euros, and yen increases, the purchasing power of each individual unit decreases.
In this environment, rational economic actors begin to search for a safe harbor, a place to protect their wealth from the slow-motion erosion of inflation. Historically, this role was filled by assets like gold. Today, a growing number of individuals, corporations, and even nation-states are turning to Bitcoin. Its mathematically enforced scarcity—a hard cap of 21 million coins that can never be altered—stands in stark contrast to the infinite printability of government-issued money.
This narrative has been supercharged by the recent performance of the US dollar itself. The world’s reserve currency experienced a dramatic 10.8% drop in its worst first-half performance since 1973, signaling a potential shift in global currency dynamics. As the dollar weakens, assets priced in dollars become cheaper for foreign investors, and the appeal of a non-sovereign alternative like Bitcoin grows. This macroeconomic backdrop provides the fundamental "why" behind the Bitcoin trade. It is no longer just a technological curiosity or a speculative bet; it is increasingly viewed as an essential component of a diversified portfolio, a hedge against the very real risks of monetary debasement and geopolitical instability. It is this understanding that underpins bullish price targets that sit around $170,000 and beyond.
Navigating the Uncomfortable Calm
With such a powerfully bullish confluence of factors, the question remains: why has Bitcoin been seemingly stuck in a consolidation pattern, unable to break out and sustain a move into the higher price ranges? Why did the market see a wobble that brought the price down to $105,000, causing anxiety among newer entrants?
The answer lies in the nature of market equilibrium. Even in the most ferocious bull market, there are always sellers. Miners, who must sell some of their newly minted Bitcoin to cover their operational costs, represent a constant source of supply. Early investors may take some profits to diversify their wealth. Short-term traders will try to play the ranges, and even some of the capital in the ETFs will inevitably be redeemed, forcing the funds to sell a corresponding amount of Bitcoin.
The current price range below $120,000 represents the battleground where the relentless, programmatic buying from the ETF leviathan is meeting and absorbing this natural, daily sell pressure. The market is in a state of accumulation and consolidation, building a strong base of support before its next major move. The fact that crypto market sentiment has held steady, even during price dips and the start of the third quarter—a period historically known for its weak seasonality—is a testament to the market's newfound maturity. The "weak hands," or investors with low conviction, have likely been shaken out, leaving a stronger, more resilient base of holders.
This period of sideways price action is likely to be deceptive. The historical seasonality of Bitcoin suggests that summer can often be a period of lackluster performance, lulling market participants into a state of complacency. The idea that Summer 2025 will "catch everyone off guard" stems from this dynamic. While the price chart may look boring, the underlying supply and demand forces are becoming ever more tightly coiled. The pressure is building, and the longer the market consolidates, the more violent the eventual breakout is likely to be.
The Inevitable Collision
The story of Bitcoin in 2025 is the story of an inevitable collision. On one side, you have the most powerful force of demand the asset has ever known: a fleet of Wall Street ETFs, led by the world's largest asset manager, programmatically buying Bitcoin every single day. This demand is structural, relentless, and here to stay.
On the other side, you have the most convicted group of holders in Bitcoin’s history. They are a super-majority, sitting on over a trillion dollars in profit, who have explicitly signaled through their actions and on-chain data that they have no intention of selling at these prices. They are withdrawing their coins from the market at a historic rate, creating a supply desert.
The dwindling reserve of Bitcoin on exchanges is the ticking clock in this grand drama. It is the visible measure of the supply shock in progress. Each day, the ETFs arrive in the market to fill their orders, only to find the shelves are increasingly bare. The deficit they create must be filled by prying coins from the diamond hands of long-term holders. But those holders have made their price clear, and it is not $120,000.
Therefore, the current market is not in a state of calm, but in a state of profound tension. It is the quiet moment before the lightning strike. The forces of an institutional-grade demand shock and a historic holder-induced supply squeeze are on a direct and unavoidable collision course. The question is no longer if this tension will resolve, but when and with what magnitude. The great disappearance of Bitcoin from the open market is the final signal that the supply problem is no longer a distant forecast. It is here, and it is about to change everything.
Bulls on PauseBreak-out bulls fired a blank. Unless 112 k is clawed back fast, expect Bitcoin to cool toward 104–106 k or even 100 k before the next real attempt. Stay patient, let the squeeze resolve, and remember: the first candle out of a volatility pinch usually sets the week’s narrative.

BTC/USD – Executed Short on Bearish Retest of Resistance PricePrice: 107,950
Position: SHORT
Strategy: Retest Sell into Bearish Continuation
Timeframe: 30m
Status: Trade Active
📊 Analysis Summary:
BTC/USD retested the 107,950–108,100 resistance zone, aligning with the 14 EMA on a clear downtrend. Bearish rejection candles confirmed seller dominance, and I executed a short entry near the top of the retest.
🔽 Plan Ahead:
Towards:105,400
Holding this short unless price breaks back above EMA with bullish strength.
💬 "Sell the bounce. Ride the breakdown. Risk managed, conviction high."
What’s your view? Will BTC hold below 108K or are bulls about to fight back?
#BTCUSD #Bitcoin #CryptoTrading #TechnicalAnalysis #ShortTrade #BearishTrend #EMA #TradingStrategy #SmartMoney #MarketStructure #RiskReward #SwingTrade

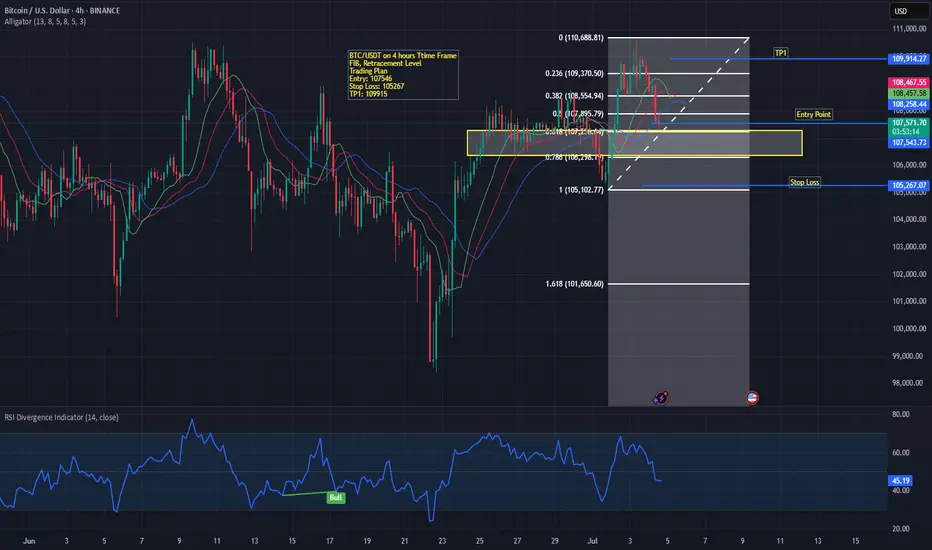
BTC/USDT on FIB Retracement LevelsThe price is currently retracing after a recent upward move and is testing the 38.2% Fibonacci level (≈107,805).
The entry zone is defined around 107,546, marked in yellow, suggesting a possible support area where buyers may step in.
The stop loss is placed slightly below at 105,267, around the 78.6% Fibonacci retracement level, to manage risk if the market breaks this zone.
The take-profit (TP1) target is set near 109,867, close to the previous high and aligning with the 0.236 Fib level (≈109,370).
📉 Indicators & Patterns
EMAs are converging, with price slightly under them, showing possible weakness but not a confirmed downtrend yet.
RSI (Relative Strength Index) at the bottom is around 45, signaling neutral momentum—neither overbought nor oversold.
A bullish divergence was marked earlier on RSI, which supported the previous price rise.
📈 Trading Plan Summary
Entry: 107,546
Stop Loss: 105,267
TP1: 109,867
Bias: Watching for a bullish reversal from the yellow support zone.
If price fails to hold above 106,296, it may head toward 105,102 and the 1.618 Fib extension (101,650).
This setup suggests a high-risk, reward potential if price bounces in the support zone, but caution is advised as RSI and EMAs currently show mixed signals.
also looks a bit like inverted head and shouldersbitcoin wouldnt be bitcoin , if from time to time a more or less head and shoulders pattern comes along.
in this case it looks a bit like the right inverted shoulder is being made. but the bearish div is also present.
it might be possible , a sharp move up to new highs around 135 k , followed by a drop below 100k .

Barb WireBTCUSD is potentially entering in a Barb Wire, meaning bulls and bears are in equilibrium and any breakout to either side has a good chance of being a false breakout.
I'm going to stay out of it for now.
If price breaks through the bear TL and make a strong reversal bar at the All Time High, it could potentially be a good short trade with high RR.

Btc will test 112 next! With some simple technical analysis I wouldn’t be confident calling in bottom but at this time I’m hedging with a short to take small profits and transfer it into spot for more BTC!! There is a FVG on a daily chart and for now on1H we can see certain resistance. RSI is relatively strong heading to neutral making me believe we may call this bottom for now. Smart money (institutional) has eaten BTC supply and just recently 7 dormant wallets are moving money. Something big may be brewing. Be careful out there.

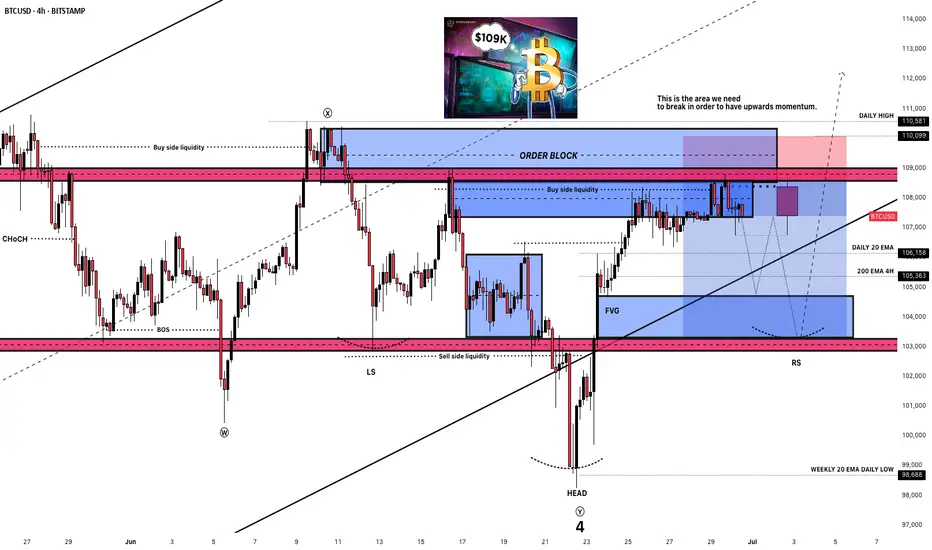
The inevitable breakout to an ATH?MN Capital founder Michael van de Poppe spotted Bitcoin hovering at $107,450, saying that after taking out some liquidity around $109,000, BTC may see a slight pullback before breaking out to all-time highs. We already reach this area.
An accompanying chart shows $109,000 as the key level to watch on BTC’s four-hour time frame. “This is the area we need to break in order to have upward momentum,” Van de Poppe said, adding:“The inevitable breakout to an ATH on Bitcoin might even happen during the upcoming week.”
However, I think we might see a pullback before this happens. We might have an inverse head and shoulder pattern in process.
Bitcoin's 4-year bullish cycle is coming to an end.The price reversal and manipulation zone could be between $120K and $133K, indicating a big bearish movement.
Quarterly analysis indicates a target of approximately $24,750.
QT + ICT + SMC
- Sainty

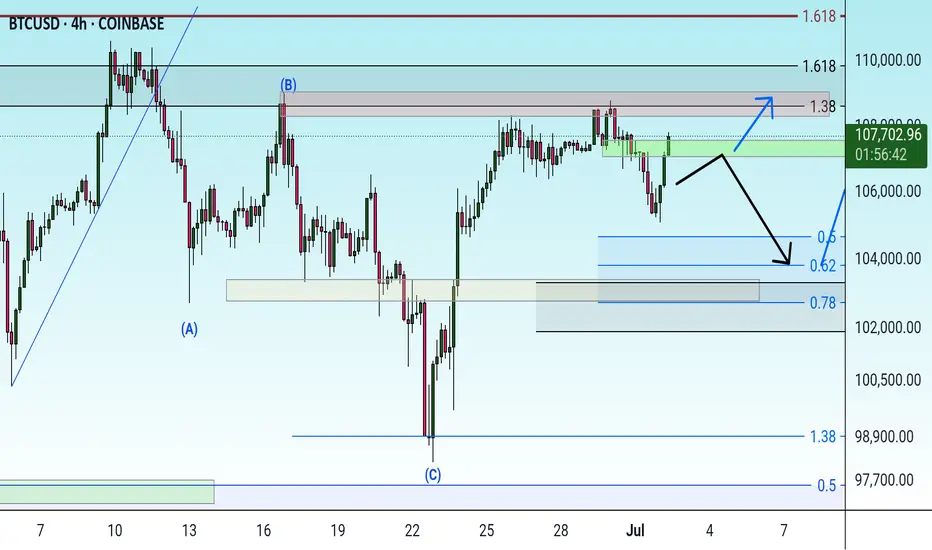
Possibility of uptrend A trend change is expected to form at the green resistance area and we will see the beginning of a downtrend. If the price breaks through the resistance area, a continuation of the uptrend to the previous high is likely.
Bitcoin is done with 100kLast time it left I said it wasn't returning... Bounce today helped that confirmation

BTC Bearish at 1DBTC printing bearish engulfing candlestick pattern on 1D, rejecting previous resistance
we are likely going to see price test 98k, 92k and worst scenario 86k
DYOR

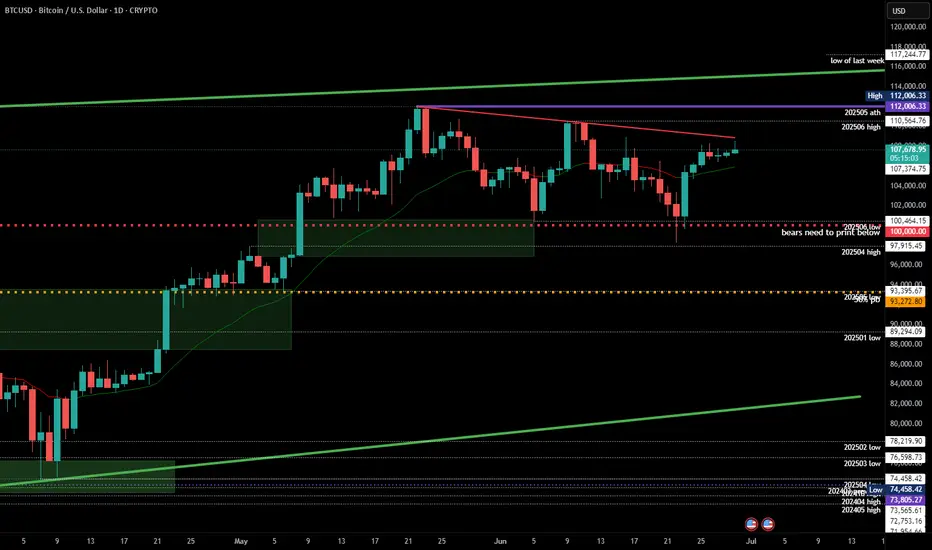
#202526 - priceactiontds - weekly update - bitcoinGood Day and I hope you are well.
#btcusd - bitcoin
comment: Neutral since bears fumbled it again. Range is clear, don’t have much else to say about this. Bulls want 113k+ and bears need a strong daily close below 100k for more downside.
current market cycle: trading range
key levels: 100k - 115k
bull case: Bulls are still hopeful, that’s why we are still above 110k but the next touch could break it and I doubt many will hold long or scale into new ones there. Best bulls can get right now is to go sideways for longer and stay above 100k. I mean… Staying above 100k is as bullish as it get’s if you be honest. Same as last week since nothing has changed for the bulls. Trading range since mid May.
Invalidation is a strong daily close below 100k
bear case: Bears fumbled it again. Strong daily close below 100k or we won’t go lower. Right now odds favor the bears to go down from 107k to 100k but need more selling pressure.
Invalidation is above 110k
short term: As neutral as can be.
medium-long term - Update from 2025-06-29: Strong daily close below 100k will be the confirmation for more downside. First target below 100k is 97k the breakout retest and after that is the 50% retracement around 93k. I have no bullish for the next weeks/months. Once the gap to 97k closes we are likely in a bear trend again and I expect to hit at least 85k over the summer.
BTCUSD LONG BULLISH FLAG📊 BTCUSD Trade Setup – 15m Chart
🔔 Shared by RKZ FX SIGNAL
We're currently monitoring a bullish setup forming inside a descending channel. Price is showing signs of accumulation near the demand zone around 106,640 – 106,700, with a potential bullish break from the falling wedge structure.
🟢 Trade Idea (Potential Buy Setup):
Entry Zone: Around 106,650 – 106,700
Stop Loss: Below 106,326 (below liquidity & demand zone)
Take Profit: Targeting supply zone between 107,980 – 108,250
Risk to Reward Ratio: ~1:3
🧠 Analysis Notes:
Price has tapped into a fresh demand zone and shown a short-term bullish reaction.
Still inside the descending channel, but momentum is building for a breakout.
Confirmation will be stronger once price breaks the midline and retests the top boundary as support.
🔔 Wait for price action confirmation at entry zone before entering. Avoid early entries.


Bitcoin is gearing up for 120K and 140KThe flip zone has been reclaimed, but no proper pullback had occurred. The recent pullback came with a sweep of the all-time high (ATH), which has caused confusion and uncertainty among market participants.
In fact, this drop can be interpreted as a pullback to the flip zone, accompanied by an ATH hunt.
We expect the price, after touching the green zone and forming a base around this level, to move toward the targets of 120K and 140K — which we currently consider as Bitcoin’s final targets for this cycle.
A weekly candle close below the invalidation level would invalidate this analysis.
For risk management, please don't forget stop loss and capital management
When we reach the first target, save some profit and then change the stop to entry
Comment if you have any questions

$BTC - $120K IS COMINGBTC is currently forming one giant bull flag since the May high. It is teasing the top of the channel while holding the 1H 100MA firmly consecutive times. Within this bull flag, the last few days have formed an additional bull flag at the top of the channel as well.
This weekend will see us breakout of both and to the upside. I am targeting $120K here with $135K if we overextend. Let's see
