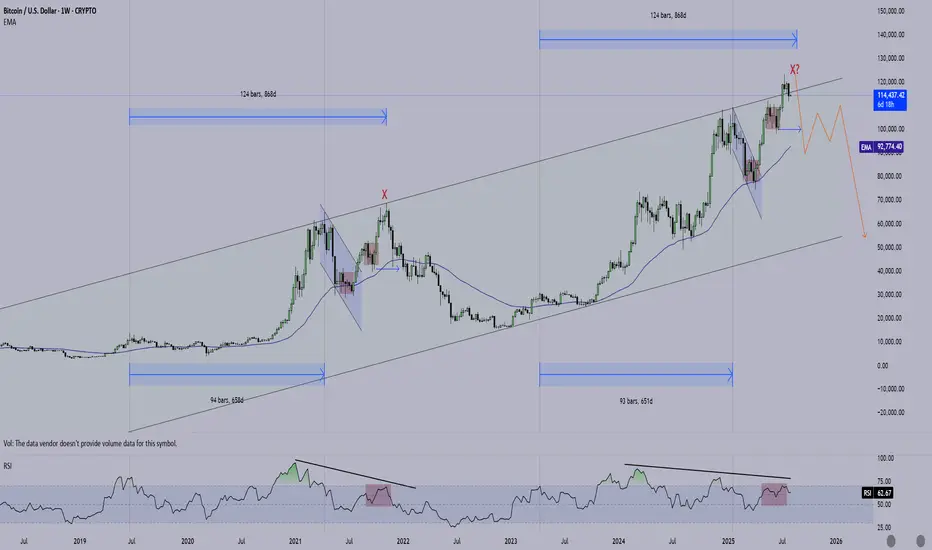
BTC: could this be it? It might be too early to tell, but this could be the top. Strong divergence in Weekly chart, but would only be confirmed if we breakdown the support levels as price can potentially push up into failure. Just a caveat, I can easily be wrong here.
BTCUSD trade ideas
Bitcoin: follows general sentimentShort term general market correction occurred at Friday's trading session, after the release of weaker than expected non-farm payrolls data. This time the crypto market was also part of this general correction, where the price of BTC broke toward the downside, ending the week modestly below the $114K. There is a general unrest among investors that implementing trade tariffs would negatively impact the US economy in the future period, in terms of company earnings, in which sense, they took the defensive strategy for their assets, including crypto.
During the first half of the week, BTC was holding firmly between the range of $117K - $119K, with most of the trades around the $118K. However, the final break occurred at Friday's trading session, where a general sell-off occurred on financial markets, pushing BTC down to $114K. Weekend dropped the level of BTC below the $114K, currently moving around the $113,2K. The RSI closed the week at the level of 41, where a clear oversold market side has not been reached. Interestingly, the MA50 is still holding the up-course, still moving away from the MA200. There is still no indication over a potential cross in the near term period.
The week ahead will be a week where investors will digest all data from this week in a quest for a new equilibrium level. Some corrections are still possible, both toward the downside or the upside. In case that the market decides on a further correction, then the level of $112K first emerges on charts, before the $110K support is tested. In case of a reversal, the first level to be tested is the $115K.
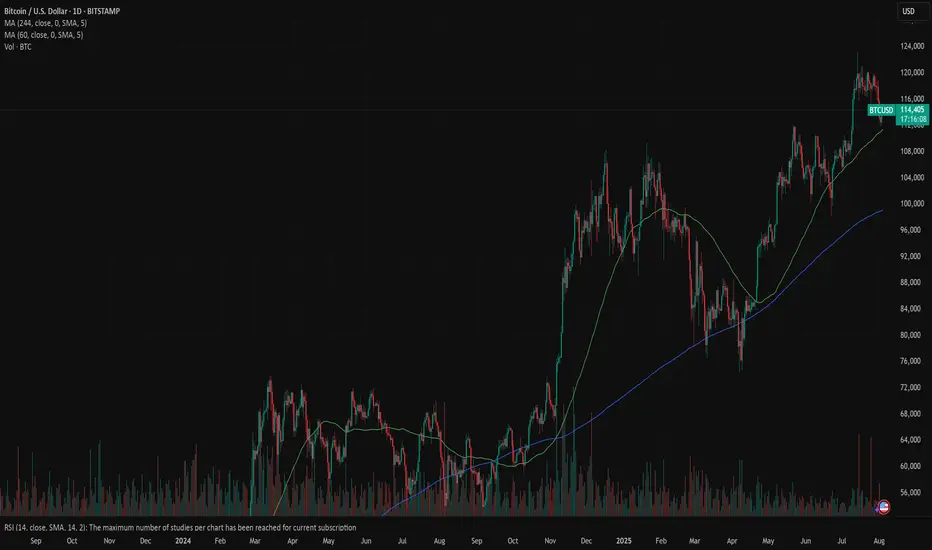
BTCUSD BUY 109270On the daily chart, BTCUSD is experiencing a pullback from its highs, with short-term bears taking advantage. Currently, attention can be paid to the support level near 109270, which is a potential buy level for a bullish bat pattern and is within the previous demand zone.

BTCUSD broke below 115,000.00 on week labor dataBTCUSD broke below 115,000.00 on week labor data
On August 1, after worse-than-expected NFP report data came out, bitcoin dropped below important level of 115,000.00 and SMA200 on 4-h chart. Technically, this means the start of a mid-term bearish market in the asset. Bitcoin often follows the same path as high-risk assets, such as tech stocks, particularly during times of economic uncertainty. The July 2025 U.S. jobs report, which showed only 73,000 new jobs added, below the expected 100,000, and a downward revision of June's figure from 147,000 to 14,000, fueled fears of a recession. This caused a broader market sell-off. In just 12 hours, $110 billion was withdrawn from spot crypto markets, with $630 million in liquidations, primarily affecting long positions.
Currently the price is testing the 115,000.00 level. The next decline towards 110,000.00 support level is expected.

BTC USD Long updateBe patient.
This trade might take one month to complete.
Be patient and wait and wait and wait.

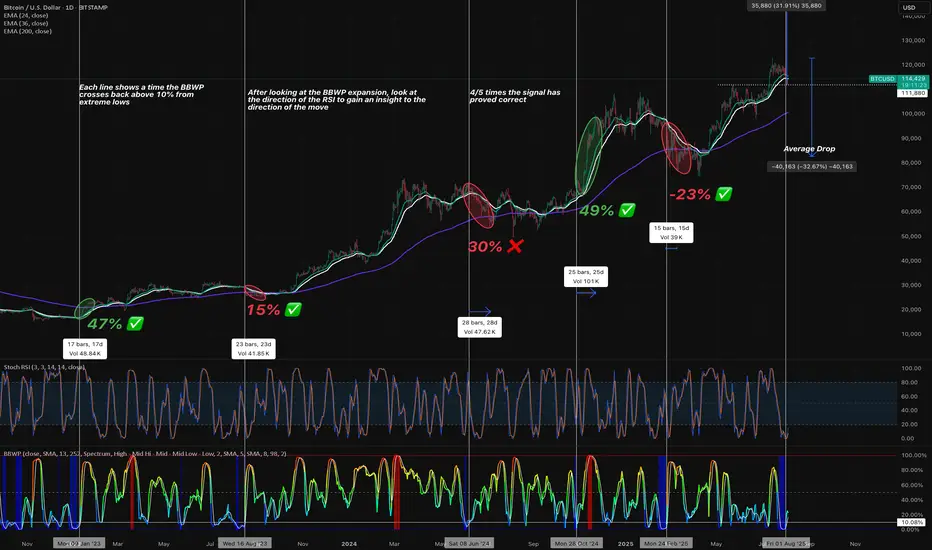
BTC Expansion BTC expansion after a low reading on BBWP. The stochastic RSI gives us an idea of the direction of the move.
What If Peter Schiff Was Right About Gold and Bitcoin All Along?- Gold / Bitcoin Ratio Head and Shoulder Pattern.
- Bitcoin has been trading like a FANG stock the last 5 years
- Gold has not doubled since the 2K high 15 years ago
Play:
Long Gold and Short Bitcoin
or
Long Gold and no position on Bitcoin

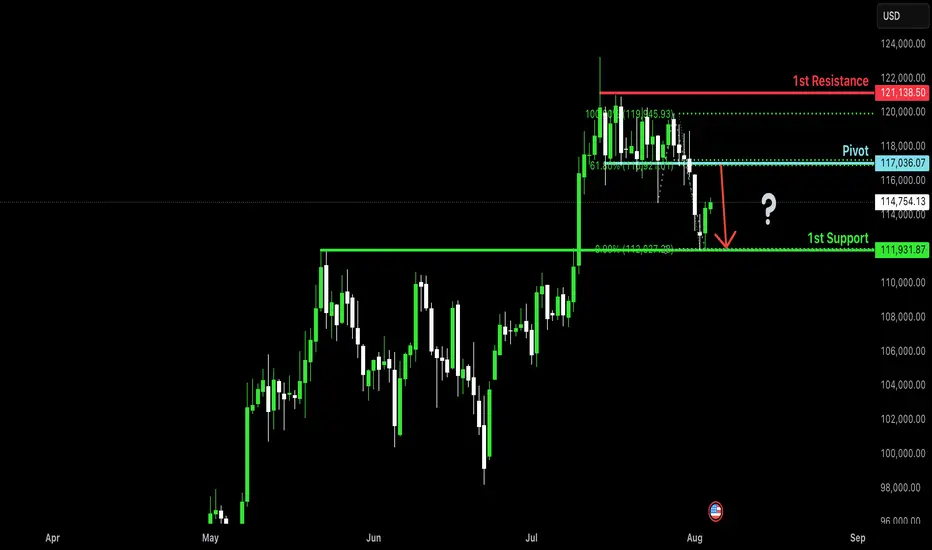
Bearish reversal?The Bitcoin (BTC/USD) is rising towards the pivot and could reverse to the 1st support.
Pivot: 117,036.07
1st Support: 111,931.87
1st Resistance: 121,138.50
Risk Warning:
Trading Forex and CFDs carries a high level of risk to your capital and you should only trade with money you can afford to lose. Trading Forex and CFDs may not be suitable for all investors, so please ensure that you fully understand the risks involved and seek independent advice if necessary.
Disclaimer:
The above opinions given constitute general market commentary, and do not constitute the opinion or advice of IC Markets or any form of personal or investment advice.
Any opinions, news, research, analyses, prices, other information, or links to third-party sites contained on this website are provided on an "as-is" basis, are intended only to be informative, is not an advice nor a recommendation, nor research, or a record of our trading prices, or an offer of, or solicitation for a transaction in any financial instrument and thus should not be treated as such. The information provided does not involve any specific investment objectives, financial situation and needs of any specific person who may receive it. Please be aware, that past performance is not a reliable indicator of future performance and/or results. Past Performance or Forward-looking scenarios based upon the reasonable beliefs of the third-party provider are not a guarantee of future performance. Actual results may differ materially from those anticipated in forward-looking or past performance statements. IC Markets makes no representation or warranty and assumes no liability as to the accuracy or completeness of the information provided, nor any loss arising from any investment based on a recommendation, forecast or any information supplied by any third-party.
BTCUSD 8/3/2025Come Tap into the mind of SnipeGoat, as he gives you a Full Top-Down Analysis of Bitcoins Price Action as we enter a new week of Qt.3 What is Price doing Right Now?? I got the answer for ya! Tune In!!!!
_SnipeGoat_
_TheeCandleReadingGURU_
#PriceAction #MarketStructure #TechnicalAnalysis #Bearish #Bullish #Bitcoin #Crypto #BTCUSD #Forex #NakedChartReader #ZEROindicators #PreciseLevels #ProperTiming #PerfectDirection #ScalpingTrader #IntradayTrader #DayTrader #SwingTrader #PositionalTrader #HighLevelTrader #MambaMentality #GodMode #UltraInstinct #TheeBibleStrategy

GOLD, BTC analysisWe saw a meaniful directional on our fav asset, after doing a thorough top down analysis, we looking to long BTC and Short Gold.

BTCUSD – bullish momentum is backBitcoin is making a strong comeback, breaking above short-term resistance and reestablishing its uptrend after a prolonged consolidation phase. The technical structure now shows clear control from the bulls, with higher highs and higher lows beginning to form.
Positive risk sentiment and growing expectations of capital flowing back into the crypto space—especially after a series of weak U.S. economic data—are fueling the current BTCUSD rally. If momentum holds, the next target could be the upper boundary of the price channel.
Keep an eye on how price reacts at key levels and trendlines — this might be the launchpad for the next bullish leg.
Good luck, and if you enjoyed this analysis, don’t forget to hit like and drop a comment!

BTCUSD long my predict up to 128100
long possible entry 115150
take profit 128100
stop loss 113000
swing long

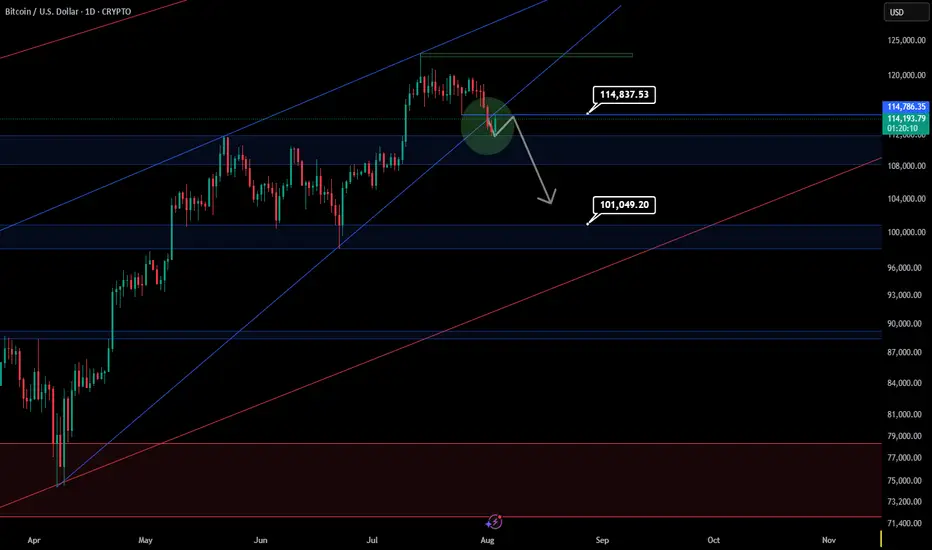
Adding to our first bitcoin sell position now We are adding to our first sell position on bitcoin because we are to see more sell off from here

BTCUSD – Retest of Key Support at 111,900After setting a new all-time high at 123,229.00, BTCUSD has pulled back and is currently reacting to the 111,900.00 support area. This level aligns with prior structure and may provide a short-term floor if bullish momentum returns.
Support at: 111,900.00 🔽 | 100,622.00 | 87,589.00
Resistance at: 116,190.00 🔼 | 120,011.00 | 123,229.00
🔎 Bias:
🔼 Bullish: Price must hold above 111,900.00 and reclaim 116,190.00 to set up for a potential retest of the all-time high.
🔽 Bearish: A breakdown below 111,900.00 opens the door for deeper correction toward 100,622.00 and 87,589.00.
📛 Disclaimer: This is not financial advice. Trade at your own risk.

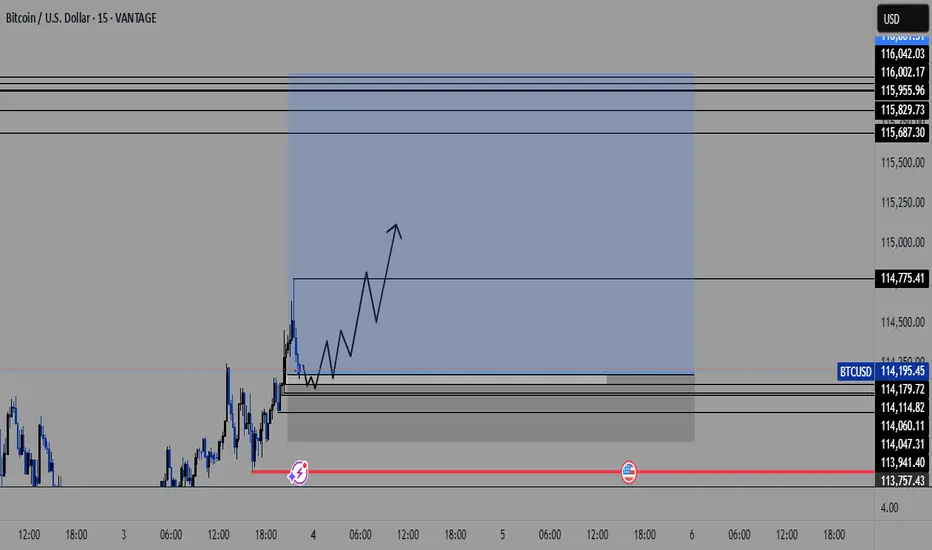
Bitcoin long again from 114k.Got stopped from the previous long , seems like btc wanted to sweep these 4h lows and continue higher .
Lets wait and enjoy the show in the upcoming months.

Bitcoin Found Support at $112kAfter making a new all-time high at $123,000, Bitcoin fell back down to test the previous high at $112,000 as expected in the previous post. In technical analysis, previous resistance tends to become support and for now we are seeing that $112k level hold as support with price bouncing up off it today and is trading back above $114k. We currently have the 50-day price average(50sma) right at that $112k level adding extra support for price as well.
As for the lower price indicators:
The PPO is showing the green PPO line holding above the 0 level which indicates that long-term momentum remains bullish. For short-term price momentum to turn bullish we would need to see the green PPO line cross back above the purple signal line.
The ADX indicator shows the purple -DI line rolling over after rising, and the green +DI line is beginning to rise indicating that the bear strength is weakening, and the bull strength is increasing. For long-term bull strength, we would need to see the green +DI line cross back above the purple -DI line, and for the background histogram bars to rise.
The TDI indicator shows the green RDI line holding above the 40 level which keeps the long-term bull trend intact. Generally, you want to see the RSI line trending between 40-80 as a sign of trend strength during a bull market. The green RSI line is also crossing back above the lower Bollinger Band after briefly crossing below it during the decline. In general, price will continue to decline when the RSI is below the lower BBand so getting back above that level is nice to see here. Next we would want to see the green RSI line move back above it's purple signal line, and back into the upper half of the Bollinger Bands.
I bought the dip into the $112k-$113k level as I expect this level to hold as support going forward. Next up, we're likely going to see a re-test of resistance at the new all-time high of $123k. From there, I'm still expecting a test of the 1.618 fibonacci extension at $135k.

Bitcoin: 113K Support Bounce Buy Signal.Bitcoin has retraced thanks mostly to "unexpected" revisions to labor market statistics. While this move has many making outrageous forecasts, price has simply retraced to the 113K support levels and has generated a swing trade long signal (break of 114K). IF the momentum stays intact, it is within reason to anticipate a test of the low 120K's while a more aggressive expectations would be a break out into the 130K's. Keep in mind if 123K is broken, even by a small amount, that would confirm the current movement as the wave 5 of 5 which means it becomes the most vulnerable to a broader correction.
This NFP report and BLS situation is the perfect example of a catalyst that NO ONE in the financial "expert" space saw coming. Even Chairman Powell on Wednesday was pointing out how stable employment growth has been and emphasized the importance of this statistic for their rate decisions. Which means the Federal Reserve is making decisions based on totally inaccurate data. Which also means the entire market has been priced completely wrong for months. My point is, "official" information that you may be basing your investments on can be totally inaccurate and can be revealed out of nowhere. This risk alone puts every investor at the mercy of the market and why it is so important to recognize the limitations of ANY market information through the lens of RISK management.
I have been writing about a potential bullish range breakout beyond 120K for a test of the 130s OR if the range support breaks instead, to watch for a test of the key support at 113K. There is NO way to know which way the market will choose in advance, it all depends on the outcomes of specific events which act as catalysts for one scenario or the other.
This is why being knowledgeable about wave counts and other forecasting techniques can be very helpful in terms of gauging risk and potential. And based on this, AS LONG AS the 108K area is NOT overlapped, the current price structure is still within the boundaries of a bullish sub wave 4. This is why I am still short term bullish on Bitcoin and why I believe the current buy signal has potential to test at least the low 120's in the coming weeks. IF the 108K area is broken instead, that reduce the chances of a short term bullish break out, and may be the proof that the broader Wave 5 structure is complete.
The risk at this point can be measure from the 112K low area and nearest profit objective 118K which offers an attractive reward/risk. Measure everything from RISK first, and always be prepared to be wrong. If the market pays, consider it a gift.
Thank you for considering my analysis and perspective.

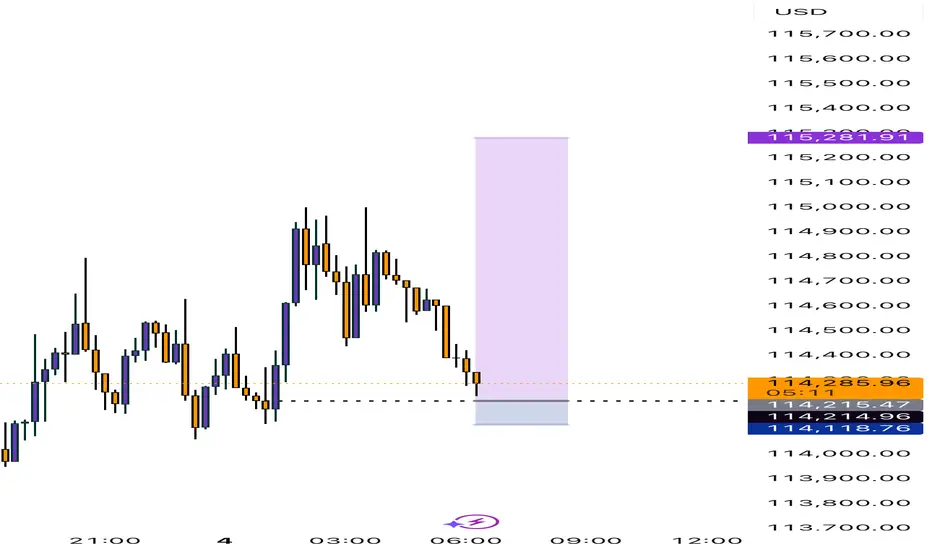
Bitcoin Forming a New Range?After all of the ups and downs over the past few days, I zoom out to a higher time frame to get a grasp of what's really happening. With three hours or so left in the day it looks most likely that the formation of a new range is in the works. I'm looking for two options over the next few hours, one being that it gets right back into the previous range and is all just a wick on the weekly chart which caused three days of panic for absolutely no reason. This would probably be hilarious but also the less likely outcome!

Bitcoin to $116K in a Week? Here's the Case Everyone's IgnoringI know it sounds wild — but hear me out.
BTC is primed for something massive, and the ingredients are all on the table:
✅ ETF inflows are quietly stacking
✅ Supply shock post-halving is still underestimated
✅ DXY weakening = flight to hard assets
✅ Global uncertainty = Bitcoin safety bid
✅ Technicals pointing to a breakout above ATH with no resistance until $100K+
We're seeing the early signs of parabolic structure forming — and if volume confirms, this could move fast. Everyone thinks a 2x in a week is impossible... until it isn't.
Not saying it’s guaranteed — but if you've been around long enough, you know BTC doesn’t move linearly.
👀 Watch the $72K breakout zone closely. If it flips with conviction and volume, $116K is not out of the question.
Drop your charts. Agree or disagree?
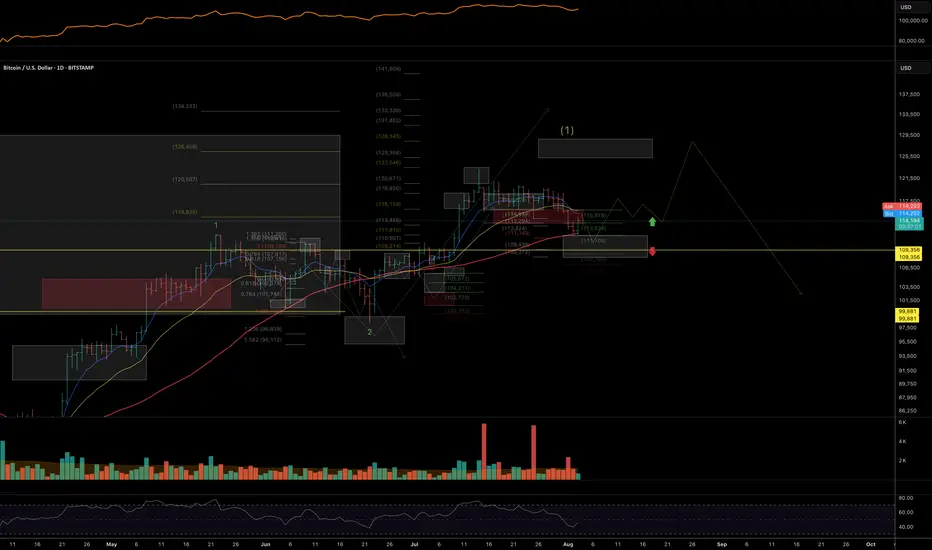
Altcoins and BTC: Macro Structures, Key Levels, and What’s NextIn this Sunday's market crypto-market analysis, I'm sharing trend structures and key support zones for the total altcoin market cap (excluding BTC and ETH), as well as for ETH, XRP, BNB, SOL, HYPE, and BTC. I also outline my main scenarios for market movement through the end of August and the rest of the year.
Key takeaways:
- Impulsive structures are shifting to diagonal structures — less stable and growth cycle is likly approaching the final phase of this market cycle.
- As long as prices hold above key macro support zones, the uptrend structure remains intact.
- I don’t rule out another sell-off early this week, deeper into support zones, followed by a potential rebound through late August, then a phase of consolidation (ideally staying above the current correction lows from the July top), and one final rally to new highs starting mid-autumn and continuing toward year-end.
-I expect ETH, XRP, and BNB to be the primary beneficiaries of the next wave of growth.
Total Altcoin Market Cap (Excluding BTC & ETH)
Support zone: 955-913B
Target resistance zone: 1.19-1.26T
BITSTAMP:ETHUSD
Support zone: 3400–3200 (possible extension to 3000)
Target resistance zone: 4300–5100+
BINANCE:XRPUSDT
Support zone: 2.7–2.5
Target resistance zone: 5.2+
BINANCE:SOLUSDT
Support zone: 170–150
Target resistance zone: 250–300
CRYPTO:HYPEHUSD
Support zone: 33–30
Target resistance zone: 60–72
BINANCE:BNBUSD
Support zone: 510–530
Target resistance zone: 960–1000
BTC Dominance
BITSTAMP:BTCUSD
Support zone: 111–109K
Target resistance zone: 125–130/135K
If you’d like me to cover a specific coin, leave a comment — I’ll include it in future updates or prepare a short video breakdown.
Thanks for your attention, and I wish everyone a strong start to the week and well-grounded investment decisions!
BTC Hits Premium Zone – Bearish Reversal Loading? BTC Hits Premium Zone – Bearish Reversal Loading?
🧠 Technical Breakdown:
🔹 1. Previous Market Structure & CHoCH
The chart shows a clear shift in structure (CHoCH) on the left, which marked the start of the bearish leg.
Break of Structure (BOS) confirms continuation of lower highs and lower lows until recent liquidity grab near the $112,551 zone.
Equal highs and liquidity above were taken out, making the move into the Premium Order Block zone highly significant.
🔹 2. Liquidity and Fair Value Gap (FVG) Zones
A major Liquidity + FVG zone was left unmitigated between $113,000–$112,000, and price is likely to revisit it.
This aligns with the target zone at $112,890, which is highlighted as a magnet for price to rebalance the inefficiency.
🔹 3. Order Block & Premium Supply Zone
A well-defined Order Block is marked just below the resistance zone near $115,166–$116,021.
Price is currently retracing into this zone, suggesting a potential reaction point for smart money to re-enter shorts.
Volume is expected to pick up here, and a reversal could initiate if price fails to break above this supply.
🔹 4. Volume Profile and Market Imbalance
Volume clusters are heaviest near the $114,000–$114,300 range, indicating high activity and previous accumulation/distribution.
Thin volume near the $112,551 zone further confirms price may drop quickly if rejection happens.
🔹 5. Support & Liquidity Sweep
Support zone around $112,551 is a previous liquidity pool and weak low that has not been fully cleared.
Price is likely to revisit this zone in the short term to clear liquidity and complete market rebalancing.
🔐 Institutional Narrative:
Smart money engineered a liquidity sweep to the downside, then caused a retracement into premium.
Now, BTC/USD is positioned in a high-risk zone where sell-side institutions may enter to push price lower.
If this order block holds, expect a rejection toward $112,890, followed by possible deeper continuation into the liquidity void below.
📌 Key Levels:
Level Price (USD)
Strong Resistance Zone 115,166 – 116,021
Order Block (Sell Area) 114,800 – 116,000 (approx.)
Immediate Support 113,000 – 112,551
Target (Liquidity Zone) 112,890
Weak Low (Final Sweep) 112,000
📉 Trade Outlook & Strategy:
🔺 If price reacts bearishly at Order Block:
Look for lower timeframe BOS/CHoCH confirmation.
Entry: Short on rejection at or near $115,000–$115,500
Target 1: $112,890
Target 2: $112,000 (extended liquidity sweep)
Stop-loss: Above $116,200 (invalidates bearish OB)
🔻 If price breaks and closes above $116,021 with momentum:
Structure flips bullish, and the OB is invalidated.
Look for long setups on retracement to $114,000 zone.
🧭 Conclusion:
BTC/USD is currently trading within a Premium Zone, testing a strong Order Block below key resistance. Price may face a bearish reaction, targeting the liquidity zone at $112,890. Smart money footprints suggest a potential trap for breakout buyers, and if momentum fades, we can expect a downside reversal to sweep remaining liquidity.
