bullishLook for potential Reversal bullish candlestick formation upon the retest of daily demand zone
BTCUSD trade ideas

?BTC Intraday LongsTechnical analysis using ICT concepts.
A rally below the 12 am NY opening price to raid sell stops below previous day's Asian & London session.
CISD from a Bullish orderblock formed on Thursday NY am session.
Looking for Buy stops resting above Friday's highs.
* Note A 4hour BISI is below the reference range that could still be revisited.

BTC Breakout: Symmetrical Triangle Formation Near Key Resistance Bitcoin highlights a symmetrical triangle pattern forming just below a descending trendline and key resistance zone around $96,000–$96,600. The price action is consolidating within narrowing support and resistance lines, suggesting a potential breakout. A bullish breakout above the red trendline and consolidation above $96,000 could lead to a strong upward move toward the resistance zone. Traders should watch for volume confirmation and breakout retest opportunities for optimal entry points.

BTCUSD... 1H CHAT PATTERNMy describing a BTC/USD (Bitcoin to US Dollar) *long trade setup* with the following parameters:
* *Entry (Buy):* 9584
* *1st Target (TP1):* 9600
* *2nd Target (TP2):* 9755
* *Stop Loss (SL):* 9500
### Trade Summary:
* *Risk:* 84 points (9584 - 9500)
* *Reward (TP1):* 16 points
* *Reward (TP2):* 171 points
* *Risk/Reward Ratio:*
* TP1: \~0.19 (not favorable)
* TP2: \~2.04 (good)
### Key Considerations:
* TP1 is very close to the entry price — possibly useful for a quick scalp or partial exit.
* The overall trade becomes favorable if you're targeting TP2 and using proper position sizing.
* Ensure this aligns with your trading strategy and current market conditions (momentum, support/resistance, volume).

BTC Follows Global Money Supply (M2) ?It seems that the BTC price mimics the movement of the global money supply (M2) with a lag of several weeks (around 80–90 days).
With the current M2 top, and assuming BTC truly follows M2, the BTC price could reach around $133K.
If M2 makes a new top, BTC could surpass $133K.


H# This code will create a visual representation of the BTC/USD price action over the specified period.
import matplotlib.pyplot as plt
import pandas as pd
import numpy as np
# Generating synthetic data for the BTC/USD price action based on the description
# Dates from October 1, 2024, to January 1, 2025
dates = pd.date_range(start='2024-10-01', end='2025-01-01', freq='D')
# Simulating price data with a strong upward trend
np.random.seed(0) # For reproducibility
price = np.linspace(45000, 103647, len(dates)) + np.random.normal(0, 2000, len(dates))
# Creating a DataFrame
btc_data = pd.DataFrame({'Date': dates, 'Price': price})
# Plotting the data
plt.figure(figsize=(12, 6))
plt.plot(btc_data , btc_data , color='blue', label='BTC/USD Price')
plt.title('BTC/USD Price Action (Oct 2024 - Jan 2025)')
plt.xlabel('Date')
plt.ylabel('Price (USD)')
plt.axhline(y=103647, color='red', linestyle='--', label='High: 103,647')
plt.axhline(y=58667, color='green', linestyle='--', label='Low: 58,867')
plt.legend()
plt.grid()
plt.xticks(rotation=45)
plt.tight_layout()
# Saving the plot as an image
plt.savefig('btc_usd_price_action.png')
plt.show()

Btcusd rebound? Btcusd has raised its local peak to 97,900, and while
the market structure is generally favorable, it is
still reliant on the S&P 500's performance and
fundamental background.
The improvement in the US tariff situation and
the relationship with China are the main factors
that contributed to the development. As the
SP500 index, with which Bitcoin has a fairly
good connection, increased, so did Bitcoin's
growth. The price broke out of the two-week
consolidation in the second half of this week,
upgrading the local maximum and breaking
over the 95,500 resistance level. It is producing
a correction in the local upward channel.
The liquidity and risk zone is 95,000. In other
words, Bitcoin will keep rising in the near and
medium term if the bulls maintain their defense
above 95K throughout the retest. If not, a 95K
pause might cause a decline to 92K-88K.
The 95.5K support level, below which a sizable
liquidity pool has developed, is the focus of all
attention. A retest (false breakout of support)
and an imbalance of market forces can both
impact growth. However, since the market will
respond to economic data, we must exercise
caution. However! The inability to continue
growing and a return of prices to the selling
zone (below 95000 to 95500) may lead to a
correction and liquidation.

a bull trap?A bull trap in trading refers to a situation where a stock or other asset appears to be breaking out upwards, attracting buyers (thinking it's going to continue rising), but then the price reverses and starts to fall. Essentially, it's a false signal of an upward trend, tricking traders into thinking it's safe to buy, only for the price to drop soon after.
Here’s how it typically works:
Upward Movement: The asset experiences a strong price movement to the upside, making it look like a breakout.
Fake Confirmation: Traders interpret this as a signal that the asset is starting a new bullish trend, so they jump in to buy.
Sudden Reversal: After a short period of gains, the price reverses direction and starts to drop, trapping the traders who bought in.
Losses: The traders who entered during the "trap" are now stuck with losses, as they bought at the higher price and the asset's value starts to fall.
Bull traps are a danger to traders who rely on technical indicators or breakouts without confirming broader market conditions. It's important to wait for confirmation signals before jumping in on a trade, as bull traps can lead to significant losses if not recognized early.
Watch out zone this support zone if the price of bitcoin can hold abot 92589 we can see that the price of Bitcoin is bullish
breaking down this area we may see retest down to 85k level

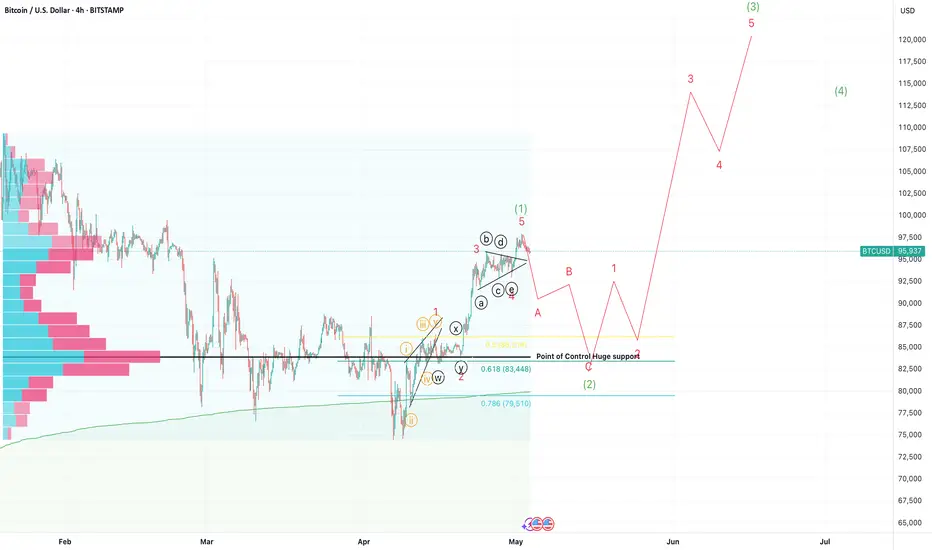
Bitcoin Short Term Top(update)Bitcoin has completed wave 1 of a bigger 5 wave move up. Expecting a correction to the $84,000 zone before a huge move up.
Btcusd analysis sell zone To determine the reason behind selling BTCUSD at $96,313, let's analyze the current market situation.
*Current Price:* The current price of Bitcoin (BTC) is $95,715.99, with an open price of $96,405.96 and a high price of $96,593.00.
*Price Movement:* The price has dropped by $689.96, representing a 0.72% decrease.
*Possible Reasons for Selling:*
- *Market Volatility:* The recent price drop might have triggered a sell-off, as traders try to minimize losses or secure profits.
- *Technical Analysis:* Traders might be selling based on technical indicators, such as resistance levels or trend reversals.

Next BTC Bullish Target: 110,000?BTC has successfully broken through the last major bearish FVG, signaling a potential shift to bullish momentum. Multiple bullish FVGs on the chart indicate possible support zones where price could retrace before pushing higher. The next target is the breakout of the next bearish FVG towards $102,000-$104,000 before it reach new ATH. Looking for further confirmations on bullish continuation.
Previous Breakout of Bearish FVG:
The recent breakout of the bearish Fair Value Gap (FVG) indicates a shift in momentum. The price has moved above the previous significant resistance, which could be interpreted as a bullish signal.
Bullish FVGs at Key Levels:
The chart shows multiple bullish FVGs (Fair Value Gaps) marked at different price levels. These areas are often considered potential support zones where price could retrace to before continuing the upward trend.
Next Target: Breaking the Bearish FVG:
The next major target is to break the bearish FVG above, which could open the path towards the higher price levels. If this zone gets broken, the bullish momentum could accelerate super fast.
Bullish Market Sentiment:
Given that the last bearish FVG has already been broken and the price is consistently moving higher within bullish FVG areas, the general sentiment is bullish.
The movement suggests that after minor pullbacks to the bullish FVG levels, the price is likely to continue upward toward the 110k+ target range.

BTC - Daily Chart Time to Short? Not recommendation to buy sell any securities, cryptos, FX or stocks.
Not financial advise. DYOR

BTCUSDwhat a long on btcusd 100% correct prediction on my previous analysis. this time i see a strong manipulation unless strong break above 9700 then good pull back to enter long, or strong retest back to 7500 to get the range retest on weekly ( bos ) to enter long, with good confirmation.
as i have draw the line with a,b,c do your own anaylysis for any good decisio. let me know what you all think, leave a comment below. give it a like if you see my work is good.

Btcusd going down an up again forward up as it will be after theBtcusd going just a bit down as a little retraction before going up again beating it's own record,
Just keep Ur own savings and investment safe
And dyor - do your own research
For myself keeping in a Elliot waving if market doesn't spikes
Just keep Ur investments safest and do Ur o n research always, and don't go for anyone else and not myself as well
This is only an idea
Keep it safe

BTC SHORTS FAVORABLEBTC setting up shorts after hitting OTE of range, MACD also shows divergences, im expecting a continuation back to the swing low pf range

BTC Outlook May 2025CRYPTO:BTCUSD
Bitcoin Nears Major Resistance – What Comes Next?
As of this writing, Bitcoin is trading around $96,000, climbing steadily as it approaches what I believe is a critical resistance zone between $98,000 and $102,000. This area has the potential to act as a major turning point.
If Bitcoin can break through and hold above the $102,000 level, I believe there's a strong chance we see continued momentum pushing the price toward $120,000 or even higher. However, if Bitcoin is rejected at this resistance zone, it could mark the beginning of a retracement, with the next major support area appearing around the $71,000 level.
This zone of resistance is, in my view, one of the most important to watch in the current cycle. Whether Bitcoin can establish new support above it—or get turned away—could shape the trajectory for the rest of the year.
Previous Bitcoin Outlook
Disclaimer: The views expressed in this article are my personal opinions and should not be considered financial or investment advice. Trading cryptocurrencies involves significant risk, and you should always do your own research and consult with a financial advisor before making investment decisions.

New Bitcoin ATH Incoming? Key Bullish Signals & Decoupling AnalyBitcoin at the Precipice: Analyzing the Confluence of Bullish Signals, Decoupling Dynamics, and the Looming Question of a New All-Time High
The cryptocurrency market, and Bitcoin in particular, exists in a perpetual state of flux, analysis, and fervent speculation. In recent weeks and months, a compelling narrative has begun to coalesce, woven from disparate threads of technical indicators, on-chain data, market dynamics, and historical parallels. Bitcoin, after a period of consolidation and correction, appears to be sending signals that have historically preceded significant upward movements. Analysts are pointing to specific indicators flashing green, a potential local bottom seems confirmed, and intriguing shifts are occurring in mining difficulty and Bitcoin's relationship with the wider altcoin market. All this culminates in the tantalizing question echoing across trading desks and social media: Is a new Bitcoin All-Time High (ATH) incoming, perhaps even within the next year?
This article delves deep into the multifaceted factors fueling this speculation. We will dissect the analyst flags suggesting a major rally, examine the evidence for a confirmed local bottom, explore the significant decoupling of Bitcoin from altcoins, analyze the implications of the shifting mining difficulty, evaluate the compelling comparison to Gold's historical breakout, and assess the technical picture presented by indicators like the Stochastic RSI and Taker Buy/Sell ratio. By synthesizing these elements, we aim to provide a comprehensive overview of the forces currently shaping Bitcoin's trajectory and the arguments underpinning the bullish outlook for a potential new ATH, possibly targeting Q2 2025.
Part 1: Reading the Tea Leaves – Indicators Flagging a Potential Rally
Experienced market analysts often rely on a combination of technical and on-chain indicators to gauge market sentiment and predict future price movements. Recently, several reports have highlighted specific indicators whose current state mirrors conditions observed just before previous major Bitcoin bull runs. While the exact proprietary indicators used by every analyst vary, common themes emerge:
• On-Chain Metrics: These look at the activity happening directly on the Bitcoin blockchain. Key metrics often cited include:
o Supply Dynamics: Tracking the amount of Bitcoin held by long-term holders versus short-term speculators. An increase in long-term holding often suggests accumulation and reduced selling pressure. Metrics like "Supply Last Active 1+ Years Ago" reaching high levels can indicate strong conviction among holders.
o Network Activity: While not always a direct price predictor, sustained growth in active addresses or transaction counts can signal underlying adoption and utility growth.
o Profit/Loss Indicators: Metrics like Net Unrealized Profit/Loss (NUPL) or Spent Output Profit Ratio (SOPR) help gauge whether the market is overheated or potentially finding a bottom. A shift from capitulation (heavy losses) towards profitability can be a bullish sign.
• Technical Indicators: These are derived from price and volume data.
o Moving Averages: Crossovers of key moving averages (e.g., the 50-day moving average crossing above the 200-day moving average, known as a "Golden Cross") are classic bullish signals for many traders. The positioning of price relative to these averages is also crucial.
o Momentum Oscillators: Indicators like the Relative Strength Index (RSI) and the Moving Average Convergence Divergence (MACD) measure the speed and change of price movements. Emerging from oversold conditions or showing bullish divergences can signal strengthening momentum.
• Market Sentiment Indicators: While harder to quantify, tools analyzing social media sentiment, futures market positioning (funding rates, open interest), and options market data (put/call ratios) can provide clues about the prevailing mood among traders.
The core argument presented by analysts is that a confluence of these diverse indicators, many of which have strong historical track records in predicting Bitcoin rallies, are simultaneously aligning in a bullish formation. It's not just one signal, but a pattern across multiple datasets suggesting that the groundwork for a significant upward move is being laid. This historical resonance provides a powerful argument for those anticipating a break towards previous highs.
Part 2: The Confirmed Local Bottom – Building a Foundation for Growth?
Complementing the forward-looking indicators is the assertion that Bitcoin has successfully established a "local bottom." This implies that a recent period of price decline has concluded, and a new support level has been found from which price can potentially rebound. Confirmation of a bottom is often a multi-step process:
1. Price Action: A clear cessation of the downtrend, often marked by a specific low point that holds despite retests. This might involve candlestick patterns indicating reversal (like hammers or engulfing patterns) or the formation of a sideways consolidation range after a fall.
2. Volume: Capitulation volume (a spike in selling volume near the low) followed by declining volume during consolidation, and then potentially increasing volume on upward moves, can support the idea of a bottom.
3. Indicator Confirmation: Technical indicators like the RSI moving out of oversold territory (<30) or MACD showing a bullish crossover below the zero line often accompany bottom formations.
4. Holding Key Support: The price successfully defending a significant historical support level or a key Fibonacci retracement level adds weight to the bottoming argument.
The claim that "all indicators flash bullish" in conjunction with a confirmed local bottom suggests a powerful technical setup. It implies that the selling pressure that drove the price down has exhausted itself, buyers are stepping back in at these levels, and multiple technical measures are signaling renewed upward momentum. Establishing a firm bottom is crucial; without it, any rally attempt could be short-lived. This confirmed base provides psychological reassurance to bulls and a defined level for risk management (placing stop-losses below the confirmed low). The question then shifts from "Will it stop falling?" to "Where is the price headed next?"
Part 3: The Great Crypto Decoupling – Bitcoin Forges Its Own Path
One of the most significant market structure shifts observed over the past year is the growing divergence between Bitcoin and the broader altcoin market. Historically, Bitcoin often acted as the tide lifting all crypto boats; when Bitcoin rallied, altcoins typically followed, often with even greater percentage gains (and vice-versa). However, recent data points to a stark change:
• Record Market Cap Gap: The difference in total market capitalization between Bitcoin and the entire altcoin sector has reportedly reached its largest point ever. This signifies that capital inflows are disproportionately favoring Bitcoin.
• Performance Divergence: While Bitcoin has made significant strides, reclaiming substantial portions of its previous losses and challenging key resistance levels, many altcoins have lagged considerably. Some have even continued to trend downwards relative to both the US Dollar and Bitcoin itself.
• Shift from Tandem Movement: The lockstep correlation that characterized previous cycles appears broken, or at least significantly weakened. Bitcoin is charting a course influenced more by its own specific drivers than by the general sentiment across the entire crypto asset class.
•
Several factors likely contribute to this decoupling:
• Institutional Adoption & ETFs: The launch and success of spot Bitcoin ETFs in the US (and similar products elsewhere) have provided a regulated, accessible channel for institutional capital to flow directly into Bitcoin. This capital is often focused solely on Bitcoin as a digital store of value or portfolio diversifier, largely ignoring the more speculative altcoin market.
• Narrative Strength: Bitcoin's core narrative as "digital gold" – a decentralized, scarce, censorship-resistant store of value – has gained traction, particularly in environments of macroeconomic uncertainty or inflation concerns. This narrative is unique to Bitcoin and doesn't necessarily extend to most altcoins, which often have different value propositions (utility tokens, DeFi platforms, etc.).
• Regulatory Clarity (Relative): While regulatory landscapes are still evolving globally, Bitcoin generally enjoys a greater degree of regulatory clarity (often classified as a commodity in key jurisdictions like the US) compared to many altcoins, which face ongoing scrutiny regarding their potential classification as securities. This perceived lower regulatory risk can make Bitcoin more attractive to cautious investors.
• Flight to Quality: During periods of market uncertainty or following negative events within the broader crypto space (like exchange collapses or protocol exploits), investors may rotate capital from riskier altcoins into the perceived safety and established network effect of Bitcoin.
•
This decoupling has profound implications. For investors, it means diversification within the crypto space is becoming more complex; owning altcoins is no longer a guaranteed way to amplify Bitcoin's gains. For Bitcoin, it suggests a maturation of its asset class status, attracting capital based on its unique properties rather than just general crypto market sentiment. This potentially makes Bitcoin's price action more robust and less susceptible to negative developments in obscure corners of the altcoin market.
Part 4: Mining Difficulty Adjustment – A Breather for the Network's Backbone
The Bitcoin network's health and security rely on miners who dedicate vast computational power to validating transactions and adding new blocks to the blockchain. The "Difficulty" is a crucial network parameter that automatically adjusts roughly every two weeks (every 2016 blocks) to ensure that new blocks are found, on average, every 10 minutes, regardless of how much total mining power (hash rate) is connected to the network.
• How it Works: If blocks are being found too quickly (more hash rate online), the difficulty increases, making it harder to find the next block. If blocks are being found too slowly (hash rate has dropped), the difficulty decreases, making it easier.
• Recent Trend: The report notes that difficulty had increased in the four previous adjustments, indicating a sustained rise in the total hash rate competing on the network.
• Expected Drop: Now, on-chain data forecasts an almost 5% drop in difficulty for the upcoming adjustment. This implies that a noticeable amount of hash rate has recently come offline.
•
Why might hash rate decrease, leading to a difficulty drop?
• Profitability Squeeze: Mining profitability is determined by the price of Bitcoin, the miner's electricity costs, the efficiency of their mining hardware (ASICs), and the current network difficulty. If Bitcoin's price stagnates or drops while difficulty remains high (or energy costs rise), less efficient miners or those with higher operating costs may become unprofitable and shut down their rigs.
• Hardware Cycles: Older generation ASICs become obsolete as newer, more efficient models are released. A difficulty drop might reflect a temporary lull before newer hardware is fully deployed or older hardware being permanently retired.
• External Factors: Regional energy price fluctuations, regulatory changes affecting mining operations in certain areas, or even extreme weather events impacting large mining facilities can temporarily reduce the global hash rate.
What are the implications of a difficulty drop?
• A Break for Miners: For the remaining miners, a lower difficulty means they have a slightly higher chance of finding the next block with the same amount of hash power. This can improve their profitability, potentially reducing the need for them to sell mined Bitcoin immediately to cover operational expenses. Reduced selling pressure from miners is generally considered a positive market factor.
• Network Self-Regulation: It demonstrates the robustness of Bitcoin's design – the network automatically adjusts to maintain its target block time, ensuring consistent transaction processing regardless of fluctuations in mining participation.
• Not Necessarily Bearish: While a significant drop could signal miner capitulation in a deep bear market, a moderate drop after a period of sustained increases might simply be a healthy cooldown or consolidation phase in hash rate growth, allowing the ecosystem to adjust.
This expected difficulty drop, therefore, provides a welcome respite for miners, potentially easing selling pressure and showcasing the network's adaptive capabilities.
Part 5: Technical Signals and Historical Echoes – Stochastic RSI, Taker Ratio, and the Gold Fractal
Beyond the broader indicators and market dynamics, specific technical signals and historical chart patterns are adding fuel to the bullish fire:
• Bitcoin Stochastic RSI: The Stochastic RSI is a momentum indicator that uses RSI values (rather than price) within a stochastic oscillator formula. It ranges between 0 and 100 and is used to identify overbought and oversold conditions, but often more effectively in identifying strengthening momentum. A signal suggesting "brewing bullish momentum" likely means the Stochastic RSI is rising from oversold levels or showing a bullish crossover, indicating that underlying momentum (as measured by RSI) is accelerating upwards. Such signals often precede periods of strong price appreciation.
• Taker Buy/Sell Ratio (Binance): This ratio measures the aggression of buyers versus sellers executing market orders (takers) on a specific exchange (in this case, Binance, a major hub for crypto trading). A "sharp increase" in the Taker Buy Ratio (or Buy/Sell Ratio) signifies that buyers are aggressively hitting the ask price to acquire Bitcoin, willing to pay the market price rather than waiting for their limit orders to be filled. This indicates strong immediate demand and buying pressure, often interpreted as a bullish signal suggesting conviction among buyers.
• Bitcoin Mirroring Gold's Breakout Structure: This is a fascinating observation based on fractal analysis – the idea that chart patterns can repeat themselves across different time scales and different assets. The claim is that Bitcoin's current price structure (consolidation patterns, corrections, subsequent recovery) closely resembles the structure Gold exhibited before one of its major historical breakouts. If this fractal pattern holds true, it suggests Bitcoin might be in the final stages of consolidation before a significant upward move, mirroring Gold's past trajectory. This analysis leads to the specific, albeit highly speculative, prediction of a potential new ATH occurring in Q2 2025. While historical parallels are not guarantees, they provide a compelling narrative and roadmap for traders looking for historical context.
• Sandwiched Between Support & Resistance: This describes the immediate technical battleground. Bitcoin's price is currently caught in a range defined by a significant support level below (a price floor where buying interest has previously emerged) and a major resistance level above (a price ceiling where selling pressure has previously intensified). The outcome of this battle is critical. Can the bulls, bolstered by the positive indicators and dynamics discussed, muster enough strength to break decisively above resistance? Or will the bears successfully defend that level, potentially leading to another rejection or further consolidation? This price zone represents the current line in the sand.
Part 6: Synthesis and Outlook – Weighing the Evidence for a New ATH
Synthesizing these diverse factors paints a complex but potentially bullish picture for Bitcoin:
• The Bullish Case: Multiple historically reliable indicators are signaling conditions that preceded past rallies. A local bottom appears confirmed, providing a stable base. Bitcoin is increasingly decoupling from the riskier altcoin market, potentially attracting more focused institutional capital via ETFs. A looming drop in mining difficulty could ease selling pressure from miners. Specific technical indicators like the Stochastic RSI and Taker Buy/Sell Ratio point towards growing buying momentum and aggression. Furthermore, a compelling (though speculative) historical parallel with Gold's breakout structure offers a potential roadmap towards a new ATH, perhaps by Q2 2025.
• The Hurdles and Risks: Despite the bullish signals, significant resistance levels lie ahead, representing areas where sellers have previously overwhelmed buyers. Macroeconomic uncertainty (inflation, interest rates, geopolitical events) can always impact risk assets like Bitcoin. Regulatory developments, while potentially clarifying for Bitcoin, remain a source of potential volatility. The crypto market is inherently volatile, and unforeseen events ("black swans") can rapidly alter market sentiment. The Gold fractal is a historical observation, not a guarantee.
Conclusion:
Bitcoin currently stands at a fascinating juncture. The confluence of bullish indicators flagged by analysts, the apparent confirmation of a local bottom, the significant decoupling from altcoins driven partly by institutional flows, the potential easing of pressure on miners via a difficulty drop, and specific technical signals like the Stochastic RSI and Taker Buy Ratio collectively build a strong case for optimism. The comparison to Gold's historical breakout adds another layer of intrigue, offering a specific (though speculative) timeline for a potential new All-Time High.
However, optimism must be tempered with caution. Major resistance levels loom large, representing the immediate challenge for bulls. The broader macroeconomic and regulatory environments remain key variables. While the indicators suggest brewing momentum and historical patterns offer encouraging parallels, breaking through established resistance and embarking on a sustained rally towards a new ATH is never a certainty in the volatile world of cryptocurrency.
The coming weeks and months will be crucial in determining whether the bullish signals translate into decisive price action. Can the bulls overcome the resistance that currently sandwiches the price? Will the decoupling trend continue to funnel capital into Bitcoin? Will the mining landscape stabilize favorably? The answers to these questions will likely determine if the whispers of an incoming ATH, potentially mirroring Gold's path towards Q2 2025, become a roar or fade back into the market noise. The stage seems set, the indicators are aligning, but the final act is yet to be written.


SMA20 > SMA80: Potentiële Trendomslag in Voorbereiding (Buy SetuI'm currently monitoring a potential trend reversal based on the upcoming SMA20 crossing above the SMA80.
This is a key SymbioTrade condition that signals the possible beginning of a bullish phase.
If confirmed by a clean break above the most recent C-line (SMA20 U-turn), I'll look to draw the first Fibonacci structure using the new ABCD points.
The next step is to identify TP1 based on retracement depth and extension color zones.
For now, this setup is under observation. I’m waiting for a valid structure with proper confluence before entering.
Strategy: SymbioTrade – SMA U-turns, Fib extensions, and confirmation logic.
Chart link auto-generated from TradingView alert JSON.

Bitcoin Outlook May 5th – Short, Swing, & Long-Term Views1/ Short-Term (Intraday): Chop City
BTC is stuck in a tight range between 95K (demand) and 98K (supply). Oscillators mixed, momentum fading near resistance.
Play: Fade extremes, scalp carefully.
Watch: Breakout above 98K or breakdown below 95K for momentum triggers.
2/ Swing Traders (Days–Weeks): Cautiously Bullish
Weekly bullish structure intact, but daily charts flashing caution (Three Black Crows, Double Top, RSI stretched).
Ideal scenario: Buy dips near 96K–95K if momentum resets bullishly.
Invalidation: Daily close below 94.5K flips bias neutral/bearish.
3/ Long-Term Investors (Months+): Bullish with Caution
Macro backdrop remains supportive (SPX bullish, DXY weak, yields stable/rising). Institutional BTC flows steady.
BUT monthly chart shows bearish divergence—momentum slowing.
Core strategy: Accumulate on major dips (ideal: 87K–76K).
Critical invalidation: Monthly close below $76K demands risk-off rebalance.
4/ Macro Catalysts to Watch
- Equity markets (SPX) & bond yields (US10Y) maintaining risk-on stance.
- USD weakness (DXY bearish) supports BTC upside.
- Watch ETF news, institutional flows, and altcoin rotation signals for early clues.
5/ Risk Management
Short-term: Tight stops, quick profits.
Swing: Respect daily structure; cut below $94.5K.
Long-term: Hold bullish conviction above $76K monthly support.
Bottom Line for Traders & Investors
- Short-term: Range-bound scalps
- Swing: Buy dips cautiously
- Long-term: Bullish, but respect slowing momentum
Stay agile, manage risk, and trade smart. Good luck this week! 🍀

BITCOIN INCOMING MOVES Hello Traders
As i can Bitcoin is trying to break 97K$ which seems hard i am expecting a drop rill design levels if not break 97K$ and then it shoot if market break and Close above 97K$ on weekly chart then it a possibility to break previous ATH and make a new ATH till desing levels Share ur thoughts with us we appriciate ur comments and support presonally i am selling from this zone with a very small SL 97300 and MY TPs showing inchart make a proper research before taking any trade
Stay Tuned for more updates ......

Btc heads and shoulder formation Longterm (Neutral)heads and shoulder forming, bullish/bearish depending if your a day trader or a hedge funder. Similarities to Jan 11 2021 Heads and shoulder, Short term bearish, long term bullish
