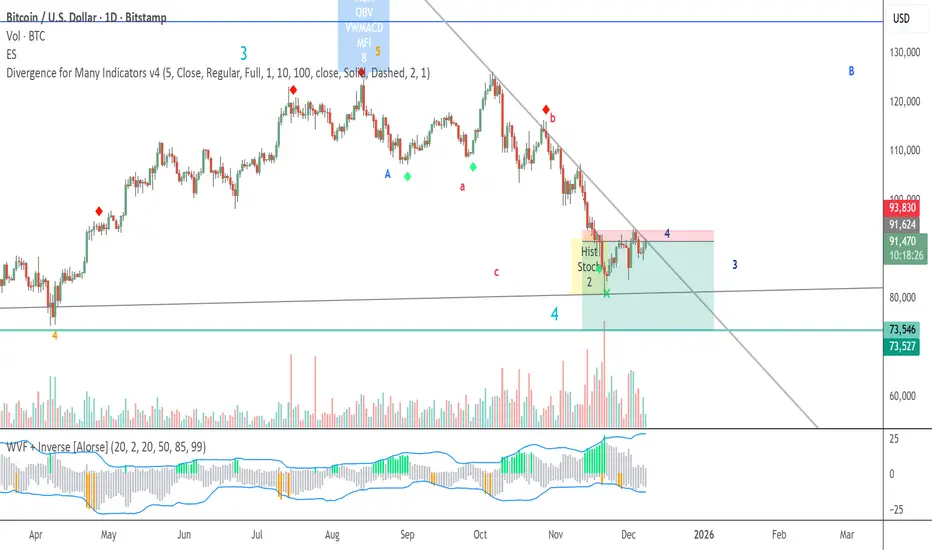
Bitcoin: Critical Levels Ahead, $106k or $65kHi guys!
The current BTC structure displays a textbook Three Drives Pattern, followed by visible momentum weakness. After the first, second, and third drives completed, price failed to create higher highs, confirming exhaustion. This aligns with the RSI divergence, which began forming during the second and third drives.
Price has now pulled back into a key decision zone. Two scenarios stand out:
Bullish Scenario
If BTC breaks and sustains above 94,393 USD, it would signal renewed strength. This could trigger a continuation toward the upper supply zone around 105,000–110,000 USD, where previous rejection occurred.
Bearish Scenario
Failure to break higher and instead falling below 82,000–83,000 USD opens the path toward deeper retracement. A breakdown confirms the distribution phase after the three drives, exposing the broader support area near 74,500 USD and potentially down to 65,445 USD, which aligns with historical demand.
Disclaimer: As part of ThinkMarkets’ Influencer Program, I am sponsored to share and publish their charts in my analysis.
Market insights

BTC/USD — Bears Defend 93.75K: Risk Extends Toward 75KBTC/USD spent last week inside the 93,750–87,500 range, failing to break higher despite growing expectations of a Fed rate cut on December 10. CME FedWatch shows ~90% odds of a 25 bp cut, but Powell’s earlier remarks about a potential pause keep uncertainty elevated.
Despite a minor rebound, upside remains capped. Investors reacted negatively to the U.S. National Security Strategy, which ignored crypto entirely while highlighting AI and quantum tech as critical national priorities. ETF flows also signal persistent risk aversion: Bitcoin ETFs recorded $87.7M in net outflows, while the Fear & Greed Index remains in Extreme Fear (20).
Given this backdrop, a sustained bullish recovery looks unlikely even if the Fed delivers a dovish decision.
⸻
Market Structure
BTC trades inside a long-term downtrend, with a short-term rebound failing at the upper boundary of the range.
A clean break above 93,750 (Murray , 61.8% Fib, upper BB) would open a move toward 100,000 and 106,250, but sellers continue to dominate.
A breakdown below 87,500 (Murray ) would trigger continuation toward the cycle lows at 75,000 and 68,750.
Technical indicators maintain a bearish bias:
• Bollinger Bands → flat
• Stochastic → turning down
• MACD → stable in negative territory
Momentum remains weak.
⸻
Key Levels
Resistance: 93,750 • 100,000 • 106,250
Support: 87,500 • 75,000 • 68,750
⸻
BTC/USD — Trading Scenarios (Weekly)
Primary Scenario — SELL STOP
Entry: 87,450
Take Profit: 75,000 • 68,750
Stop Loss: 92,300
Bias: Bearish continuation below key support
⸻
Alternative Scenario — SELL LIMIT
Entry: 100,000
Take Profit: 75,000 • 68,750
Stop Loss: 104,000
Bias: Fade the rally into resistance

WHAT ARE WE SEEING WILL BTCUSD GO UP OR FALL LOWER lets have a look at standard candle patterns and see what is possible at this current stage
1 btc usd ha made a double bottom and is testing the inner high of the W shape
we see a double touch on the 30 min we see a bullish ingulfing pattern we see rejectoin at tis level it does not seem strong at this point but i think the importance of the level will reveal it self .
the confirmation to me is a srtong candle above 90k on the 30 min time line
the ris is sitting low the adx is showing a sign of dropping on the 1h the macd is still bearish along with the rsi
so lets see where the buy is coming from at this point there is no clear buy so wating is the best option
lets see where we are at 9pm south african time

BTC BUY SIGNALBtcusd buy signal , remember to close
( 50/50 ) when in a trade or quick scalping position to avoid hitting stops loss with no rewards , always trial stop as well

BTC/USD 15m Update – Fibonacci Dip-Buy SetupBTC/USD 15m Update – Fibonacci Dip-Buy Setup ActivatedCurrent Price: ~90,640 (+0.47% recovering)After the strong breakout above the descending trendline, Bitcoin has pulled back sharply and is now perfectly respecting the 61.8% Fibonacci retracement of the entire impulsive leg (from the FVG low ~88,500 up to 92,773 high). Price has already swept the 61.8% level, reclaimed it with a strong green candle, and is now holding above the ascending micro-trendline + the 61.8% zone. This is textbook pullback into golden Fibonacci + trendline confluence is one of the highest-probability long setups on lower timeframes.Trading Signal (15m/1h Scalp – Swing) Direction: Long (Aggressive Buy)
Entry Zone: 90,300 – 90,600 (61.8% – 65% Fib area) → already filling
Stop Loss: 89,750 (below 78.6% Fib and FVG low)
Take Profit 1: 92,000 – 92,500 (previous highs)
Take Profit 2: 93,500 – 94,000 (measured move & next resistance)
Risk/Reward: 1:3+ possible
Confluence: 61.8% Fibonacci retracement
Ascending trendline support
FVG already filled earlier
Bullish orderflow on lower timeframes (aggressive bids stepping in)
#BTC #Bitcoin #Crypto #Fibonacci #DipBuy #GoldenRatio #BTCLong #TradingSignal #TechnicalAnalysis Not financial advice – trade at your own risk, use proper risk management, and always do your own research!

BTCUSD | That's a Red FlagSince Oct 25, BTC has printed two classic bearish flags, each breaking down after giving some hope to bulls.
Price is now developing a third bearish flag, with structure and momentum closely resembling the previous two.
Until we see a decisive shift in market bias, this type of corrective climb inside a rising channel often serves as continuation rather than reversal.
A confirmed break below the lower trendline will strengthen this idea of more downside is yet to come.
A bullish close above $97k might change our bias and will be looking for new signs.
Good Luck!
Please drop a like, comment and if you like this analysis consider joining our TG.

BTC/USD – Retest of Supply Zone With Potential Bearish ContinuatBTC/USD has moved back into the 94,022 supply zone, an area where strong rejection previously occurred. Price is still trading inside a broader downward channel, showing that sellers remain active in this region.
After tapping the supply zone, the market is forming a short-term pullback. If price fails to break and hold above the zone, a continuation toward the 83,866 support level becomes likely. The channel structure supports the idea of a lower move if momentum shifts back to the downside.
At the same time, price needs to stay below the channel midpoint to maintain bearish pressure; otherwise, the structure may turn neutral.
Key Levels to Watch:
Supply / Resistance: 94,022
Support: 83,866
Structure: Downward channel
Bias: Bearish while below resistance zone

Good for intraday shorts, bad for swingsThe new trendline/channel formed indicates a squeeze incoming over the next couple of days, if it breaks this trendline to the upper side, we have to look for good longs. Let’s goooo!, see the levels and put your TPs and SLs according to your risk management, best of luck!

BITCOIN - Time to buyBITCOIN (BTC/USD) has recently been stuck inside a triangle channel pattern and has struggled to break out for a few weeks. However, the price has recently broken a strong resistance level (the white trend line shown on the chart) - The price is currently above the trend line which acted as a strong resistance level and is now very likely to hit the next resistance zone which is labeled as the take profit level. Time to buy bitcoin!


Suptertrend just flashed the SELLFirst time if four years Supertrend flashed the sell signal. Three consecutive closes below the 50W SMA confirm.

Silent Waves Before the Surge The current BTCUSD structure shows the market completing a major impulsive wave, followed by a corrective phase that is still unfolding. The correction has taken the form of overlapping subwaves, suggesting consolidation rather than a sharp reversal.
Within this corrective movement, smaller waves are building a base that could serve as the foundation for the next impulsive leg. The pattern indicates that the market is preparing for renewed momentum once the corrective sequence is fully exhausted.
The overall wave count continues to favor a bullish continuation scenario, provided the corrective structure resolves in alignment with classical Elliott principles. Traders should watch for the transition from consolidation to impulse as the next defining move.

BTC/USD 1H – Rejection from Supply, Bearish Retest in PlayBITSTAMP:BTCUSD
The rising trendline supports price from below, but buyers are losing traction under higher-timeframe supply. Bears gain control if price breaks and closes below 88,295, exposing the 85,619 → 84,000 demand zone for reaction.
Key Scenarios
❗ Bearish Case (currently more probable)
Breakdown below 88,295 confirms continuation
🎯 Target 1 → 87,000 trendline touch
🎯 Target 2 → 85,600 demand zone
🎯 Target 3 → 84,000 liquidity sweep
🔄 Bullish Recovery (only valid if support holds)
Price must hold above 88,295 & reclaim 90,500
🎯 Upside Re-test → 92,983
🚫 Failure below 88,295 invalidates long structure
Levels to Watch
Sell Trigger: 88,295 break
Demand Reaction Zone: 85,619 → 84,000
Bearish Continuation: Lower highs under 90,500
⚠️ Analysis is for educational purposes only — not financial advice.

BTC USDHI GUYS,
This week am changing idea setups, am to share a much clean set up as illustrated above.
no more scalp entries on every move however am switching to identifying path entries ONLY
BTC USD sold last week on a thursday, however the historical price pattern suggest (fri, mon ) price .
so yes i did make entries howvever i expect monday to be bullish to clear the fri, mon sell price pattern.
NOTE. there was manipulation on entry price pattern last week however my detective method still suggest bulls on Monday then sells the same day.

Monthly Analysis: Bitcoin (BTC), Issue 280 The analyst expects Bitcoin’s price to decline by the specified end time (countdown timer), based on quantitative analysis.
The take-profit level simply represents a potential price range during this period — it’s optional and not a guarantee that the price will reach it.
You don’t need to go all-in or use leverage to trade wisely.
Allocating only a portion of your capital helps keep overall risk low.
Our approach follows institutional portfolio management principles — not the “all-in or blow-up” style often promoted on social media.
Performance is evaluated over the entire time window, regardless of whether the take-profit level is hit.
The validity of this analysis is based on a specific time range (until 04 Jan 2025), and after this period, the analysis will be reviewed and updated (once every 28 days).

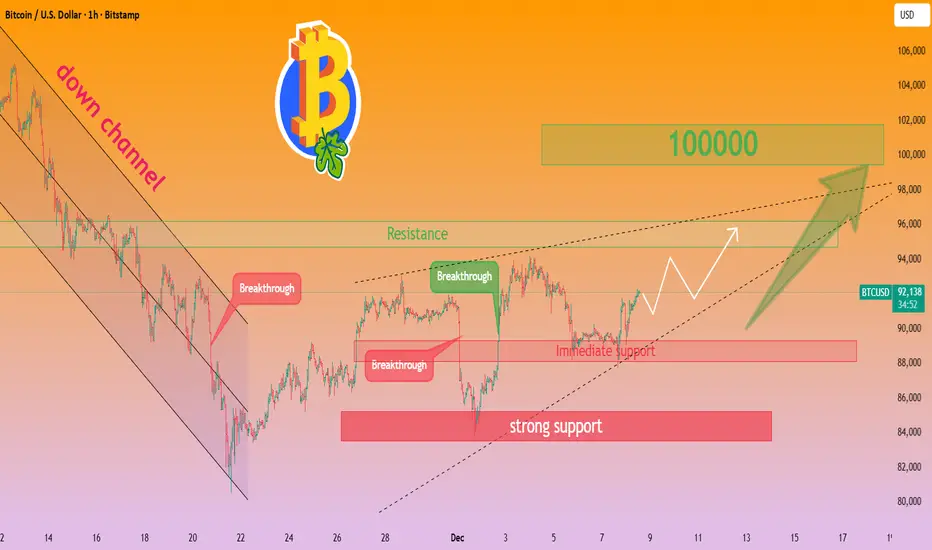
The window for buying Bitcoin has opened.1. Policy Winds: Rate Cut Expectations Anchored, Liquidity Easing Underpins Markets
The Federal Reserve’s December FOMC meeting has entered the final phase of deliberation. Data from the CME FedWatch Tool shows that the probability of a 25-basis-point rate cut has risen to 89%. Dovish officials continue to release easing signals, emphasizing that a weak labor market and falling inflation have created room for policy adjustments.
Bitcoin maintains a strong negative correlation of -0.72 with the U.S. Dollar Index. Recently, the dollar index broke below the key support level of 101, opening up space for a crypto asset rebound. More critically, the global crypto regulatory framework is trending toward "clarification": the U.S. SEC’s compliance review of spot ETFs has entered a normalized phase, and regulatory certainty has increased following the implementation of the EU’s MiCA regulation. Policy uncertainty that previously suppressed the market has gradually been digested, forming a dual policy support of "negative factors fully priced in + easing expectations."
--------------------------------------------------------------------------------
2. Technical Indicators: Oversold Recovery Confirmed, Solid Support System
The $91,110 level lies in a critical technical turning range:
- On the weekly chart, the RSI has rebounded to 39, moving out of the extreme oversold zone. A classic bottoming pattern of "long lower shadow + descending wedge bottom support" has formed, and historical data shows that the probability of a short-term rebound after such a structure exceeds 75%.
- On the daily chart, the MACD green histogram continues to narrow, with the fast and slow lines approaching a golden cross. The downward slope of the 15-day EMA ($91,500) has slowed, indicating a gradual exhaustion of selling pressure.
The support system offers dual protection:
- Immediate support at $90,000 (recent high-volume trading zone).
- Strong support at $88,000 (200-hour SMA).
- Resonant support at $83,680, where the macro upward trend line aligns with the 100-week SMA, providing ample technical safety margin.
On the resistance side, focus on the dense supply zone of $93,000-$96,000. A breakthrough will open up rebound space toward $98,000.
Bitcoin trading strategy
buy:90000-91000
tp:92000-93000-96000
sl:89000

Bitcoin to continue its downward journey within next few hours.Bitcoin is again testing its downward sloping trendline and hourly charts are showing divergence as well as Demark exhaustion and reversal bar is glowing.
Next stop at 73k
BTC Trade Set Up Dec 8 2025Price is overall bearish making LH/LL on the 4h, has came up too tap into supply and now will expect price to make internal 15m bearish structure to continue lower to lower SSL and demand areas

BTCUSD – Price Moving Inside Descending Channel After Uptrend BrBitcoin previously respected an ascending channel and formed higher lows, but price has now broken below the rising support line, signaling a possible shift in momentum.
Currently, BTC is moving inside a descending channel, showing signs of controlled selling pressure. A clear seller demand zone is visible near 94,000, where price has been rejected multiple times.
There are two possible scenarios:
Bullish Scenario:
If price holds above the 88,200–88,500 area and breaks out of the upper descending trendline, a move back toward the 92,000–94,000 resistance zone is possible.
Bearish Scenario:
If price breaks below the lower channel and the key support around 83,800–84,000, further downside continuation may occur.
This is a structure-based analysis using trendlines and channels, not financial advice. Always confirm with your own strategy and risk management.

Price has broken above the downward trendline (blue)BTC Chart Analysis (1D – Heikin Ashi)
Based on market structure, Harmonic patterns, FVG, trendlines, and indicators:
Market Structure Overview
✅ 1. Clear Double Bottom around ~77,000–78,000
• The two-round bottom indicates a major reversal level.
• Price bounced from the ABCD Extension zone (green demand zone) → a confirmed Reversal Zone.
✅ 2. Price has broken above the downward trendline (blue)
• This signals an early trend reversal.
• If the daily candle can close above 92,300–92,500, the probability of a larger bullish move increases significantly.
🟦 Harmonic Pattern
📌 Bat Pattern + ABCD + ABCD Extension (98,700–108,400 zone)
• The red rectangle area = Strong Resistance Zone / Bearish PRZ.
• Price may face a pullback here before continuing upward.
But if this zone is broken → higher levels become likely.
🟪 Fair Value Gap (FVG)
There is a major FVG between 110,000–123,000.
→ Markets tend to fill FVGs, meaning price has a “logical reason” to rise and fill that gap.
🎯 Key Resistance Levels
Based on your chart:
1. 91,200 → currently being tested
2. 98,700
3. 108,400
4. 125,500 (the major target for this cycle)
🟩 Key Support Levels
1. 91,200 (previous support/resistance level)
2. 88,500–89,000
3. 77,300 (Double bottom / major demand zone)
If price breaks below 77K, the structure turns bearish.
📈 MACD Indicator
• Blue line crossing above orange → Bullish Cross
• Histogram turning green consistently → Momentum is strengthening on the upside
These signals align with a reversal from the Double Bottom.
Trend Direction Summary
🟢 Bias: Bullish (Reversal Trend)
The chart signals supporting an upward direction include:
• Double Bottom + Trendline Breakout
• MACD Bullish Cross
• Price holding above the ABCD Extension Reversal Zone
• Clear major upside targets aligned with the upper FVG
🎯 Targets Based on Harmonic Structure + FVG
• Level 1: 98,700
• Level 2: 108,400
• Level 3 (Major): 122,000–125,500

Technical resonance has contributed to the rise of Bitcoin.Technical Pattern: Support Confirmed + Oversold Recovery, Bullish Momentum Accumulating
The $92,000 level lies in a critical technical support zone, with multiple signals resonating:
- On the daily chart, the RSI has rebounded from the oversold zone (34) to 51, moving out of the weak range while remaining below the overbought threshold — leaving ample room for further upside.
- The MACD green histogram continues to narrow, with the fast and slow lines approaching a golden cross, indicating a gradual exhaustion of selling pressure.
Solid Support System
- Immediate support: $90,000–$91,000 (recent high-volume trading cluster), where concentrated trading activity forms a strong demand floor.
- Strong support: $88,000, a key on-chain accumulation zone and JPMorgan’s estimated "soft cost-of-production bottom." This dual support provides a robust safety margin for bullish positions.
Resistance & Upside Potential
Focus on the $93,000–$95,000 resistance range. A valid breakthrough will open up rebound space toward $98,000–$100,000. Currently, the price is in an advantageous layout zone characterized by "clear support + accessible resistance," with accumulating bullish momentum setting the stage for a potential rally.
Bitcoin trading strategy
buy:91000-92000
tp:93000-95000-98000
sl:90000
Bitcoin 15m Analysis: Bullish Trendline Breakout – The provided chart is a 15-minute timeframe for BTC/USD, showing recent price action from December 6 to around December 8, 2025. Bitcoin appears to have formed a descending trendline (blue line sloping downward from the left), which acted as resistance during a pullback phase. Price consolidated in a choppy manner, dipped to fill a Fair Value Gap (FVG) near the lower levels around 88,500-89,000, and then broke out bullishly above the descending trendline, supported by an ascending trendline from the recent low. This breakout suggests renewed upward momentum, with the price currently hovering around 92,173 (down 0.41% on the candle), testing immediate resistance near 92,500-93,000. Multiple horizontal support/resistance lines are drawn, including key zones at 90,548, 90,000, and lower at 89,500-89,000, indicating potential areas for bounces or reversals.Focusing on the 89,800 level you're eyeing: This sits near the lower end of the recent FVG zone and aligns with a horizontal support line visible on the chart. It could represent a high-probability dip-buy opportunity if price retraces from current levels, especially as it coincides with the ascending trendline support. Volume appears to pick up on the upside breakout, supporting bullish bias, but watch for any failure to hold above 90,548, which could lead to a retest of 89,800. Overall, the structure looks constructive for bulls in the short term, with potential targets at 93,000 and beyond to 94,000 if momentum sustains, but broader market factors (like macro news or sentiment) could influence this.Trading Signal: Entry: Long (Buy) on dip to 89,800 (wait for confirmation like a bullish candle or bounce off trendline).
Stop Loss: 88,500 (below FVG low for risk management).
Take Profit 1: 92,500 (near current resistance).
Take Profit 2: 94,000 (extension target).
Risk/Reward: Aim for 1:2 or better.
#BTC #Bitcoin #Crypto #TradingSignal #TechnicalAnalysis This is not financial advice—trading involves risk, and you should do your own research or consult a professional.

BTC IS SIDEWAYSitcoin continues to struggle to find a clear direction. The weekly 50 MA is still around 102K - even if we are in a bear market, that should be retested as resistance, like it has in every past “cycle.” For now, I remain in the camp that we are likely in a normal bull market correction and that we will eventually see further upside.
In the short term, we can use this chart as a guide for a break up or break down. Right now, we remain sideways.
