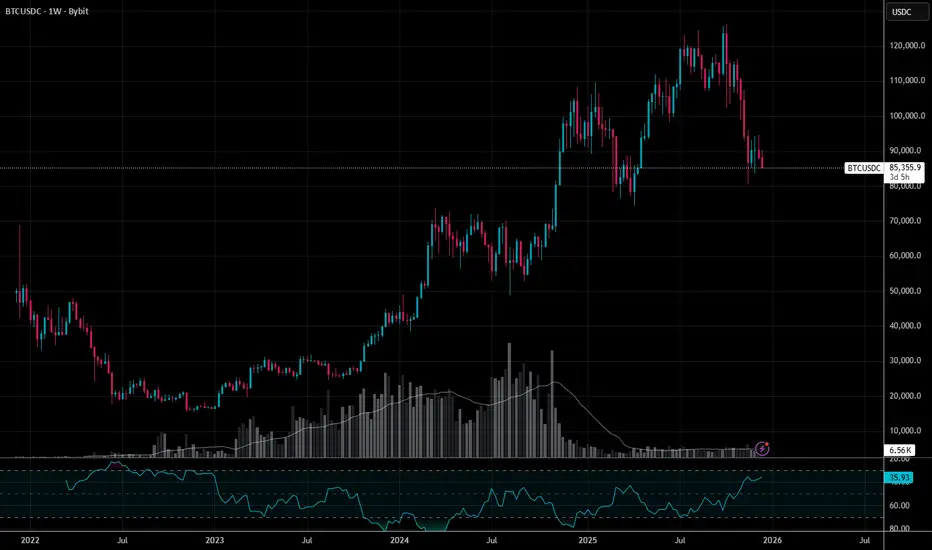
BTC’s OCD means EMA by NYEWe all know the market has a little OCD. Certain levels it just has to touch before it’ll allow the next move.
On the monthly BTC chart, that level looks like the 9 EMA — and it’s lining up as a likely “must-tag” into month’s end.
Here’s the key observation:
• The monthly 9 EMA has been sliding d
Related pairs

Why Reducing Trading Fees Is The Foundation of Risk ManagementMost traders obsess over entries, exits, indicators, and leverage.
Very few obsess over fees .
That’s odd; because unlike your strategy, your psychology, or the market itself, trading fees are guaranteed . They apply to every trade, in every market condition, whether you win or lose.
If ris
BTC 4H Update: Bullish Phase Starting After Expected CorrectionBased on my previous analysis, where I expected a bearish move and the market followed that scenario accurately, it now appears that Bitcoin is transitioning into a bullish phase within the current range. Recent price behavior shows weakening selling pressure and renewed demand near key support leve


Bitcoin Analysis 4H TimeframeOn the 4H chart, price is currently testing a key ascending trendline after several valid touches in previous swings. The recent structure shows weakening bullish momentum, and if this trendline breaks decisively, Bitcoin may enter a deeper corrective phase.
At the moment, two main scenarios are li

BTC downtrend breakoutThere's a possibility of a breakout from the downtrend that formed from the ATH, it was already tested 3 times. If we accumulate at this level a breakout of this trend is plausible.

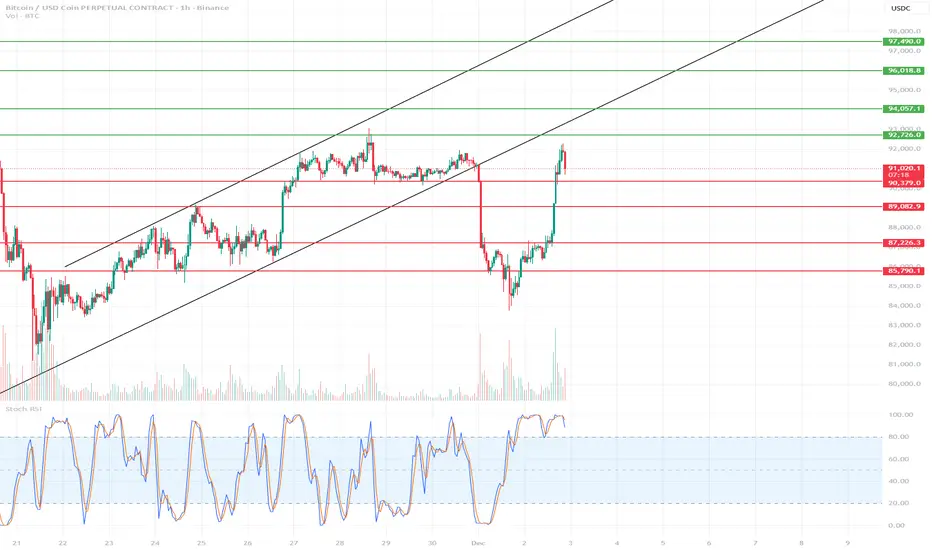
BTC Short-Term Chart 1H🔍 1. Current Market Situation
BTC has made a very strong rebound from around ~87,000 and reached the key resistance zone of 92,700–93,200, where the first signs of a slowdown are currently visible.
The Stoch RSI on the 1-hour timeframe is heavily overbought, which usually suggests a local correcti
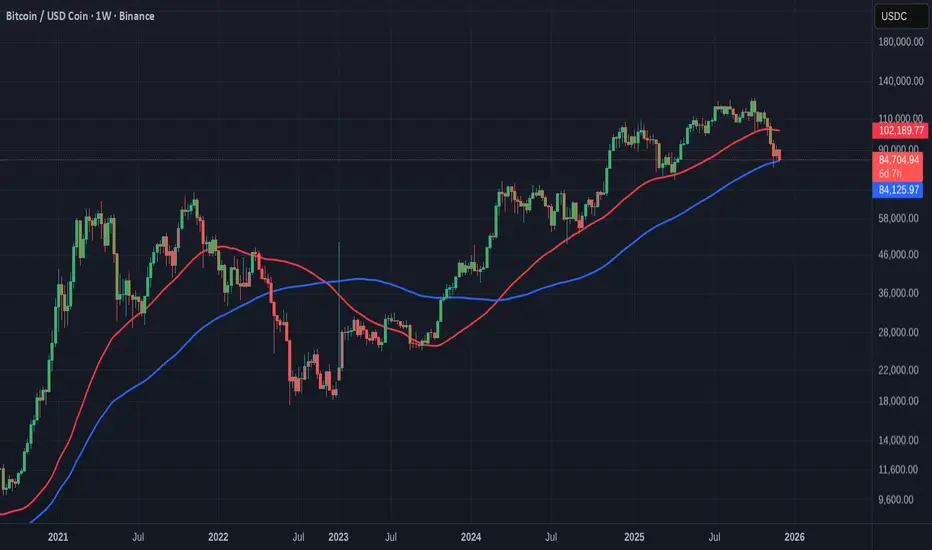
Really Simple Clue to "Is Bitcoin in a BEAR or BULL"
It is as simple as this.
If PA falls below that BLUE 100 WEEK SMA, Bitcoin is in a BEAR
While we remain above it, we have Hope of returning back to a BULL RUN
The RED line is the 50 Week SMA, which was the first warning Shot.......
We will find out this month I hope.........................
Long trade 📘 BTCUSDT.P – Trade Journal Entry
🟦 Trade summary
Pair: BTCUSDT.P
Trade Type: Buyside Trade
Date: Sat 22nd Nov 25
Time: 9:30 pm
Session: Tokyo Session PM
Timeframe: 15 min
🟩 Trade parameters
Entry: 86,169.4
Profit Level: 91,000.0 (+5.60%)
Stop Level: 82,523.8 (–4.02%)
Risk-to-Reward: 5.46 R
🟨

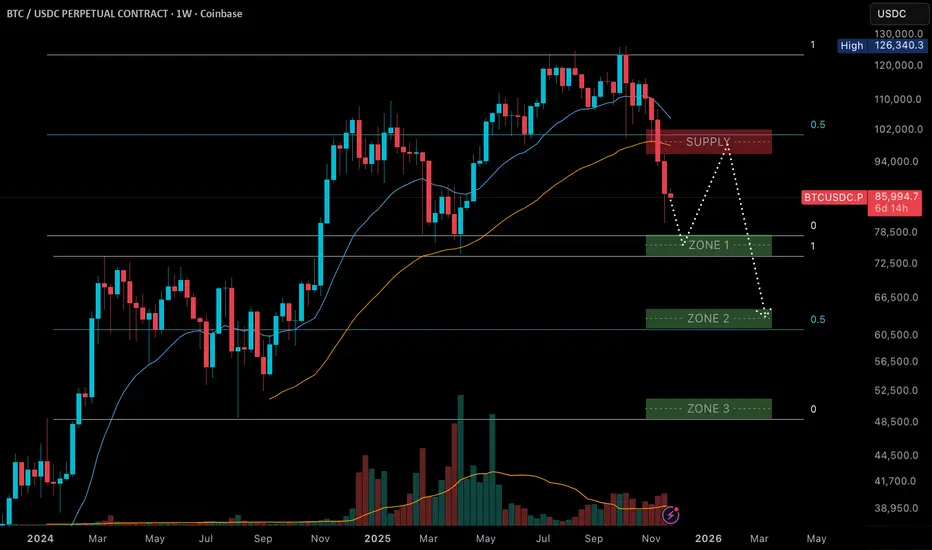
BTC Next weekly targetsMy last TA was on point at the top. However, the initial target isn't met yet. As we broke the weekly trend already, I expect a kind of a pullback to the supply (re-distribution area) and then back down.
Acceptance above the supply area would invalidate the idea. For now, I expect a little relief bo
See all ideas
Summarizing what the indicators are suggesting.
Oscillators
Neutral
SellBuy
Strong sellStrong buy
Strong sellSellNeutralBuyStrong buy
Oscillators
Neutral
SellBuy
Strong sellStrong buy
Strong sellSellNeutralBuyStrong buy
Summary
Neutral
SellBuy
Strong sellStrong buy
Strong sellSellNeutralBuyStrong buy
Summary
Neutral
SellBuy
Strong sellStrong buy
Strong sellSellNeutralBuyStrong buy
Summary
Neutral
SellBuy
Strong sellStrong buy
Strong sellSellNeutralBuyStrong buy
Moving Averages
Neutral
SellBuy
Strong sellStrong buy
Strong sellSellNeutralBuyStrong buy
Moving Averages
Neutral
SellBuy
Strong sellStrong buy
Strong sellSellNeutralBuyStrong buy
Displays a symbol's price movements over previous years to identify recurring trends.