Btc have big long chanceI want to get an optimistic scenario from Bitcoin, which can increase up to five times as far as the history of Hawings.
🇮🇷Long Live Iran🇮🇷
Related pairs
Swing D1 Double TopHigherHigh > HigherLow structure is broken.
LowerHigh > LowerLow has formed, so the main trend is Short at present.
Trendline break until it occurs, until then the Long direction is lost.
MovingAverage retest may give strength to another Long trend...

Bitcoin - Levels of the Range On the hourly time frame it is clear that BTC is within a rangebound environment. Using key levels such as the weekly highs and lows with Mondays highs and lows to to paint a picture of where support and resistance may be.
In the "weekly outlook" post for this week I suggested a retest of the $108,

Non Uclidean Fib BTC down after denial of Dual ZoneBTC keeps denying Zone the future of BTC spells a fall down a cliff
Bitcoin New ATH - Where now?After Bitcoin makes new all time highs, the next steps are very important. Where price goes now can be tricky to predict as there is the rare factor of price.
One of the only ways to predict where BTC may find resistance during price discovery is to use Fibonacci levels, using Fib extensions the fi

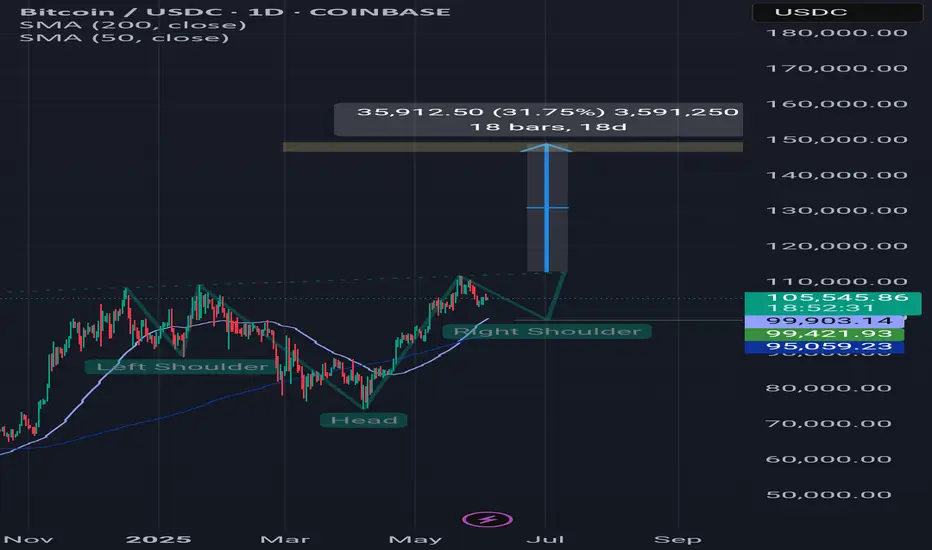
Btcusdt updateAnother scenario that can be imagined for Bitcoin is this. A head and shoulders pattern and a reversal from the $99,400 range and a rise to the $140,000 range, which could be the end of Bitcoin's celebration. In addition, we have a lot of news in these two weeks that may cause this 40% scenario to h
BTC will drop from here to around 100k **Bitcoin Analysis Update**
Bitcoin has printed a **bearish divergence**, suggesting a potential reversal from the current level. Based on the setup, a drop toward the **\$100,000–\$101,000** range is likely.
This presents a **low-risk, high-reward trade opportunity**, with a **risk-to-reward rati

BTC short to 101!
**"Bitcoin is likely to retrace to at least the 101 level before resuming its upward trend. This area represents the next significant demand zone. Additionally, the next Fibonacci support 0.382 fib lies around the 98 level. Despite this expected pullback, the overall market sentiment remains very b

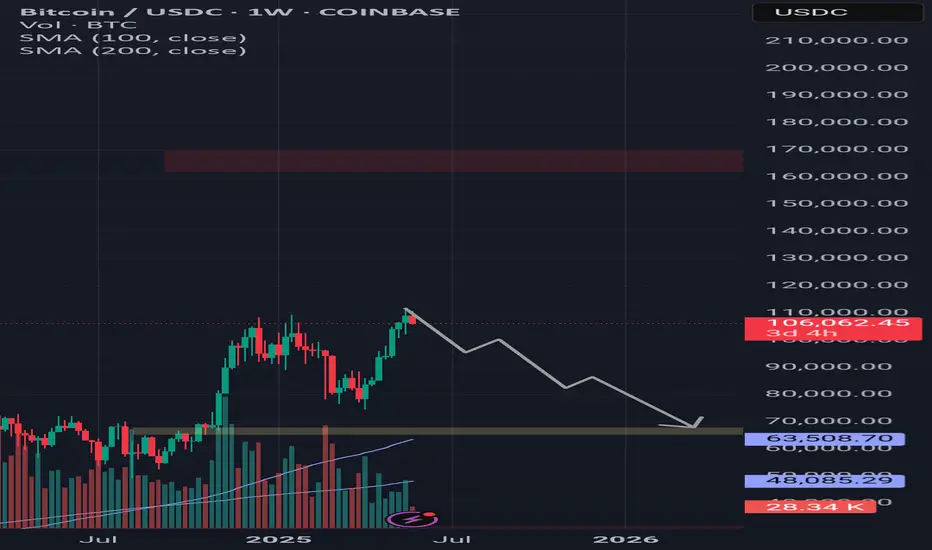
BtcusdtHello dears, I did a simple analysis of Bitcoin for you. If the next weekly candle is also bearish, it may happen with a probability of sixty percent. If you want to buy, buy at the specified price, which is about sixty-five thousand dollars. Good luck (⚠️A lot of data was reviewed for analysis, suc
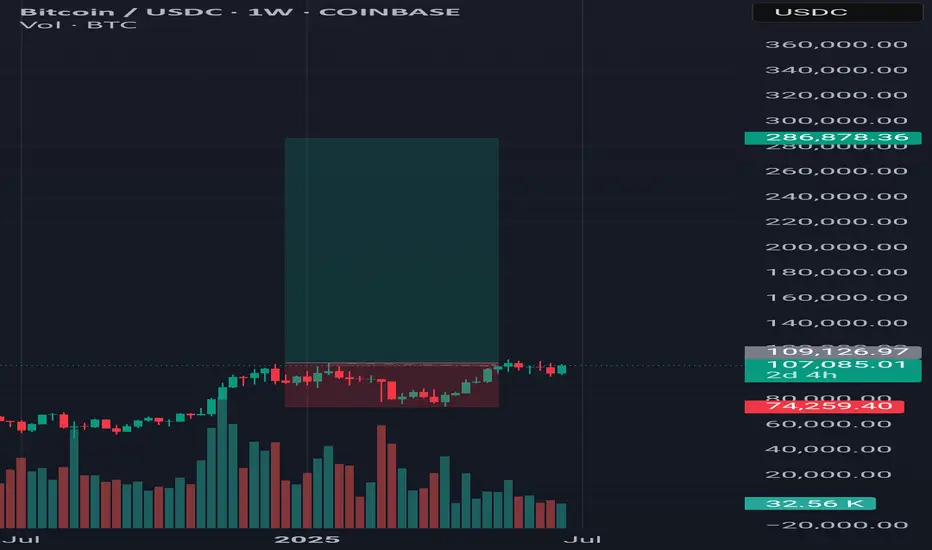
Bitcoin Levels in 2025Prediction levels on Bitcoin in 2025.
*first step - 143000 $ - 144000 $
* quick shot and back - 210000 $
* almost imposible in 2025 - 280000 $
We waiting for Fed decissions in this week.
- FOMC protocol 28 may 2025 - 19:00 (GMT +1)
- PKB USA 29 may 2025 - 2:30 PM (GMT +1)
- Core PCE 30 may 20

See all ideas
Summarizing what the indicators are suggesting.
Oscillators
Neutral
SellBuy
Strong sellStrong buy
Strong sellSellNeutralBuyStrong buy
Oscillators
Neutral
SellBuy
Strong sellStrong buy
Strong sellSellNeutralBuyStrong buy
Summary
Neutral
SellBuy
Strong sellStrong buy
Strong sellSellNeutralBuyStrong buy
Summary
Neutral
SellBuy
Strong sellStrong buy
Strong sellSellNeutralBuyStrong buy
Summary
Neutral
SellBuy
Strong sellStrong buy
Strong sellSellNeutralBuyStrong buy
Moving Averages
Neutral
SellBuy
Strong sellStrong buy
Strong sellSellNeutralBuyStrong buy
Moving Averages
Neutral
SellBuy
Strong sellStrong buy
Strong sellSellNeutralBuyStrong buy
Displays a symbol's price movements over previous years to identify recurring trends.