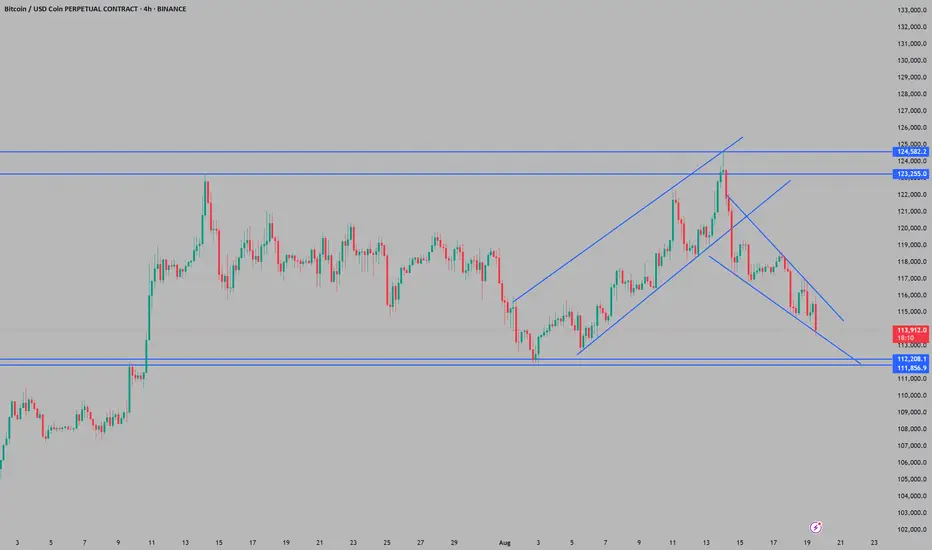
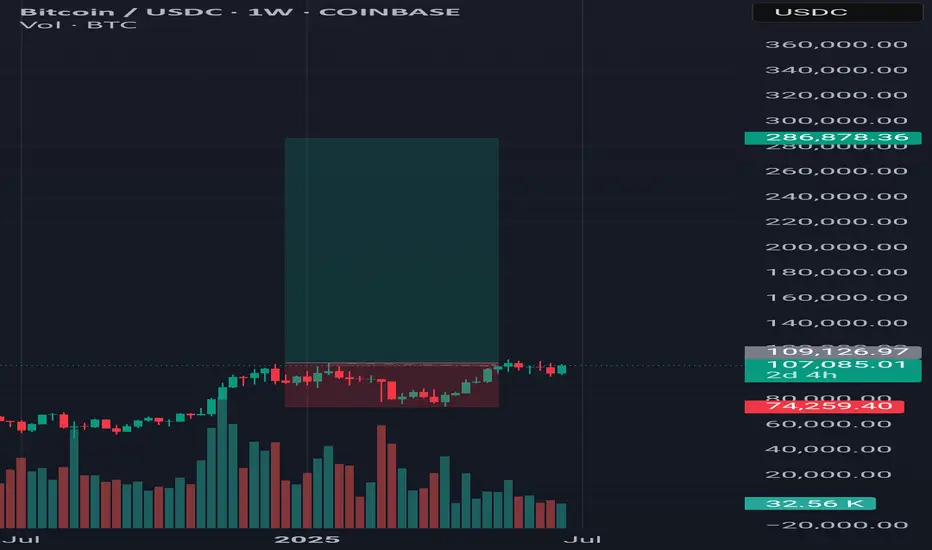
Bitcoin underperforms during unsettled conflictsSupport and Resistance Levels:
Major support appears to be around 111k–112k, which has held previously after a strong upward move.
Resistance levels marked at 123k and 124k indicate prior highs and significant selling pressure.
Price Action & Structure:
The price recently had formed an ascending
Related pairs
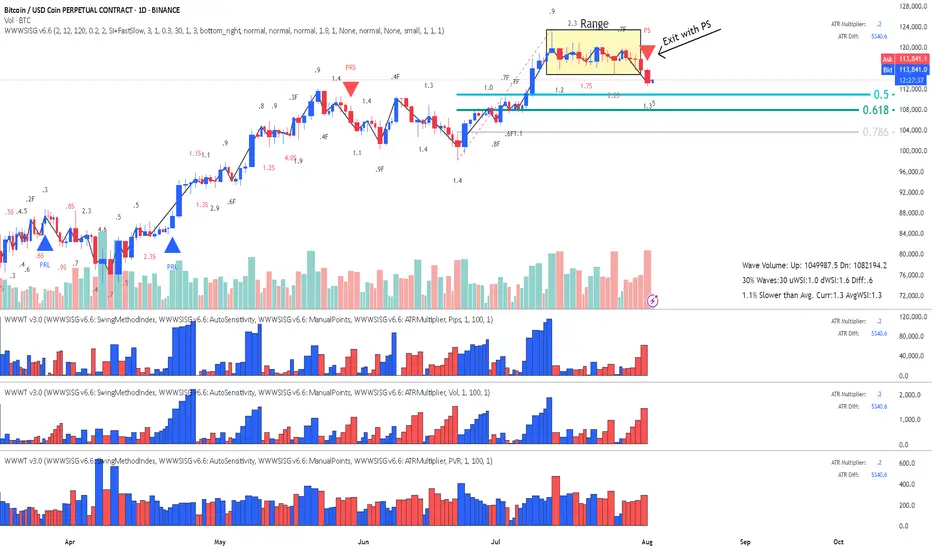
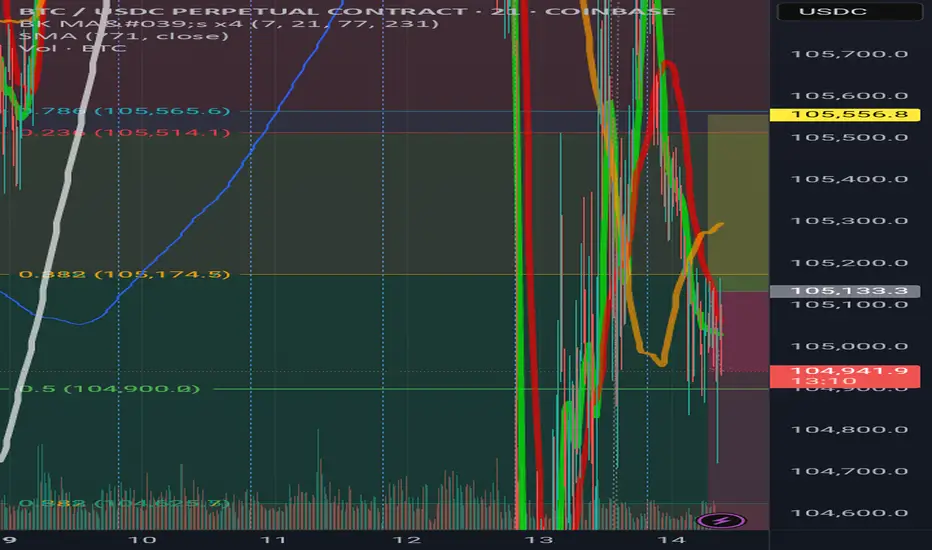
BitCoin - Is it heading for the Fib?This is a classic Entry Short for Weis Wave with Speed Index owners called " Exit from Range with a Plutus Signal" and in this case it was a PS. It looks that it's heading for the Fib, I will wait for some pullback on 1HR to confirm with Speed Index and the waves, as well as getting a better RR.
I
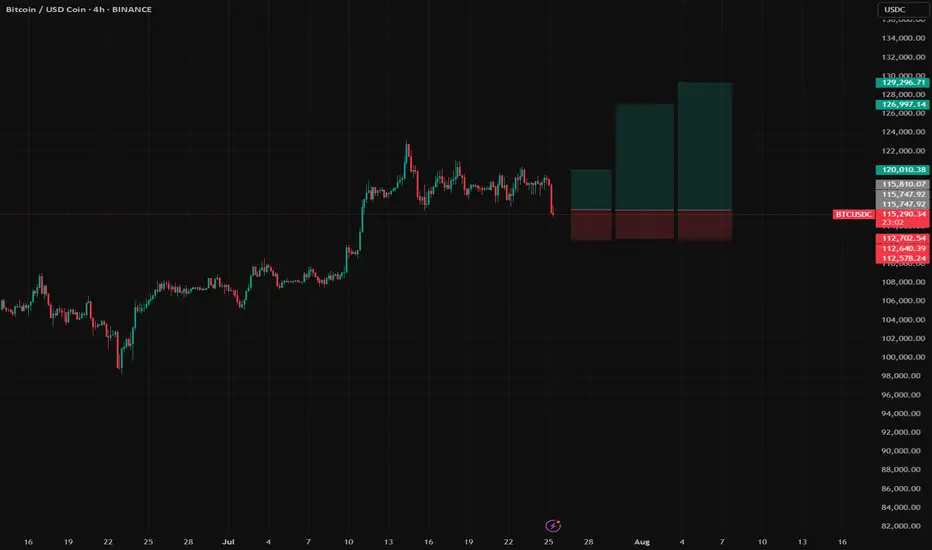
BTC Long Setup | Multi-target Swing Trade with Reasonable SL📝 Description:
Buy Bitcoin (BTC) based on continuation correction structure.
Entry: 115,800
Stop-Loss: 112,600
Risk: 1% per trade (position size adjusted accordingly, no leverage used trade spot only!)
🎯 Take-Profit Levels:
*Watch for a strong red candle at each TP zone.
If it happen, take full
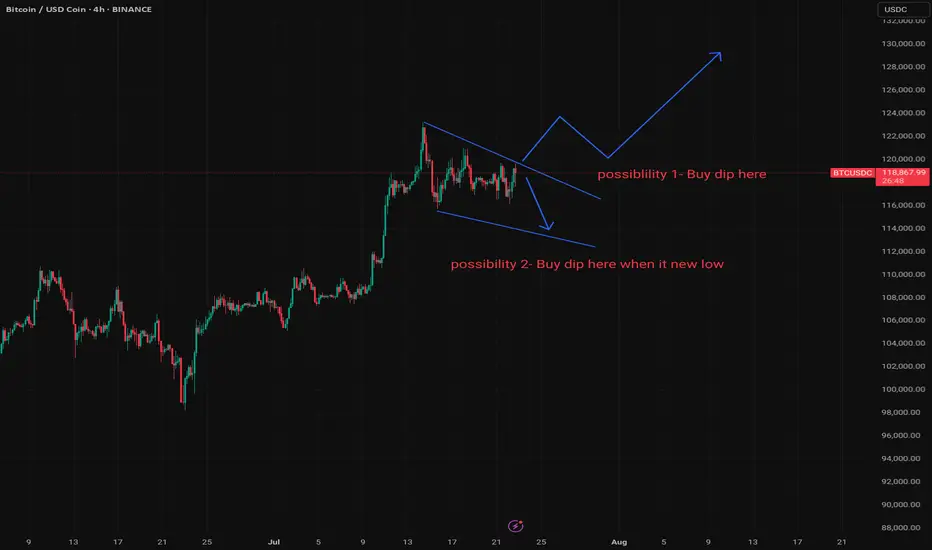
BTC Decision Point – Trade the Plan.BTCUSDC Outlook – Standby Mode Until Confirmation
BTC is currently forming a wedge on the 4H timeframe, typically a bullish continuation structure. However, now is NOT the time to enter. Patience is key — wait for price confirmation.
📌 First Plan (Possibility 1):
If price clearly breaks out to the
Long trade
15min TF
BTCUSD Perpetual – 15-Minute Chart Analysis
Key Trades Highlighted
Trade #1:
Type: Buyside trade
Entry: 114,171.5
Profit Level: 118,677.0 (+3.97%)
Stop Level: 113,635.5 (–0.47%)
Risk/Reward: 8.63
Entry Time: Thu 10th July 25, 5:15 pm (NY Session PM)
Target Reached: Fri 11th July 25, 5:3

Btc have big long chanceI want to get an optimistic scenario from Bitcoin, which can increase up to five times as far as the history of Hawings.
🇮🇷Long Live Iran🇮🇷
Swing D1 Double TopHigherHigh > HigherLow structure is broken.
LowerHigh > LowerLow has formed, so the main trend is Short at present.
Trendline break until it occurs, until then the Long direction is lost.
MovingAverage retest may give strength to another Long trend...

Bitcoin - Levels of the Range On the hourly time frame it is clear that BTC is within a rangebound environment. Using key levels such as the weekly highs and lows with Mondays highs and lows to to paint a picture of where support and resistance may be.
In the "weekly outlook" post for this week I suggested a retest of the $108,

Non Uclidean Fib BTC down after denial of Dual ZoneBTC keeps denying Zone the future of BTC spells a fall down a cliff
Bitcoin New ATH - Where now?After Bitcoin makes new all time highs, the next steps are very important. Where price goes now can be tricky to predict as there is the rare factor of price.
One of the only ways to predict where BTC may find resistance during price discovery is to use Fibonacci levels, using Fib extensions the fi

See all ideas
Summarizing what the indicators are suggesting.
Oscillators
Neutral
SellBuy
Strong sellStrong buy
Strong sellSellNeutralBuyStrong buy
Oscillators
Neutral
SellBuy
Strong sellStrong buy
Strong sellSellNeutralBuyStrong buy
Summary
Neutral
SellBuy
Strong sellStrong buy
Strong sellSellNeutralBuyStrong buy
Summary
Neutral
SellBuy
Strong sellStrong buy
Strong sellSellNeutralBuyStrong buy
Summary
Neutral
SellBuy
Strong sellStrong buy
Strong sellSellNeutralBuyStrong buy
Moving Averages
Neutral
SellBuy
Strong sellStrong buy
Strong sellSellNeutralBuyStrong buy
Moving Averages
Neutral
SellBuy
Strong sellStrong buy
Strong sellSellNeutralBuyStrong buy
Displays a symbol's price movements over previous years to identify recurring trends.