$BTC CRYPTOCAP:BTC 💰
CRYPTOCAP:BTC Update 💰
If we look at the current situation, there's a potential for a correction first...
I think reaching the demand area around $116K would be really solid, bro...
BTCUSDT.3S trade ideas

$BTC - Much Higher or Much Lower. EoY '26I'm not gonna lie, I drew these lines with my balls. I use them to move my cursor on my computer monitor.
This is not financial advice. This is just how my deep gut instinct likes to draw brushstrokes.
I gave 4 optional trajectories.
These will likely not happen, nor is it likely that the Price Action and Valuation will stay within these lines.
Enjoy and Happy Trading!
Mr. Storm

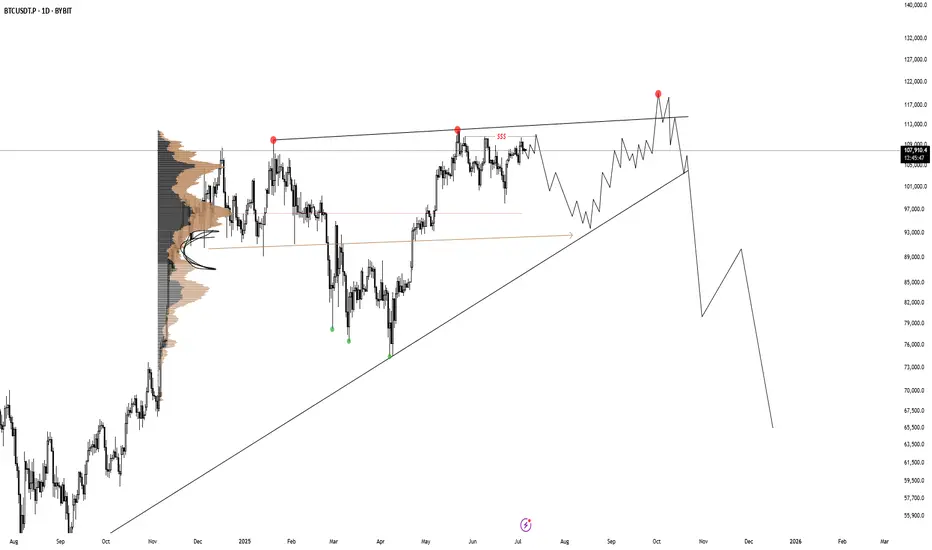
A bearish 12 Month candle could be in the cardsBitcoin made an yearly high of 20% after 6 months in on the yearly candle
This does not make me feel great about the rest of the year
a clear sell signal would be an higher timeframe close under 100k after an upthrust to new ath around 110k - 120k
around 50k-54k for me is an good buy level to build an longterm position:
0.382 fib retracement for an primary 1-2 wave
0.500 fib retracement from the 25k low
0.886 fib retracement from 49k low
50% pullback from current high to projected low
where will bitcoin go ? i don't know, but i do know where i want to buy and when i want to sell

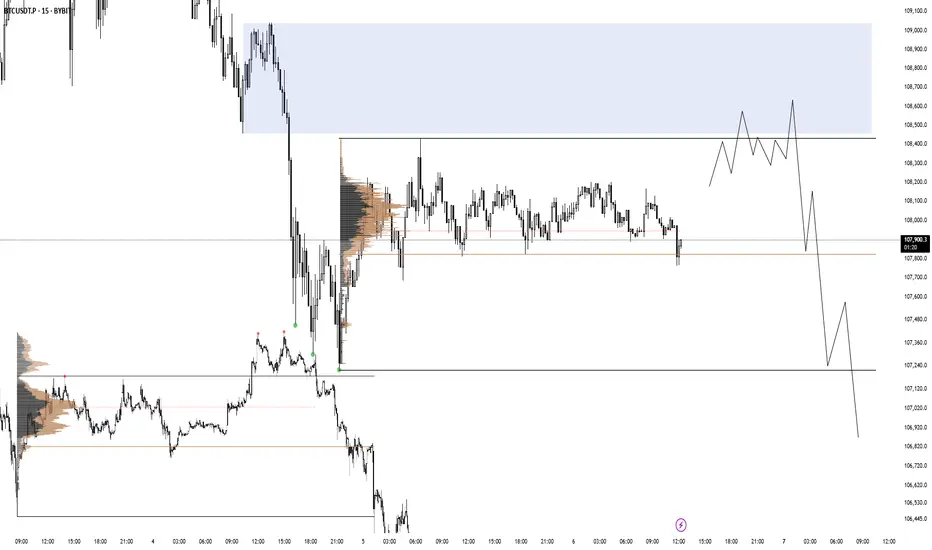
BTC 06.07.25There is a range imbalance with no price action in discount after BTC accumulated on friday afternoon. I am looking for a valid distribution like in the picture on the left.
BITCOINAs of July 11, 2025, Bitcoin (BTC) is experiencing a strong bullish surge, reaching new all-time highs:
Current Price: Around $117,786 per BTC, up about 1.55% on the day, with an intraday high near $118,780.
Market Cap: Approximately $2.33 trillion, reflecting significant institutional and retail interest.
Trading Volume: High, with 24-hour volume exceeding $124 billion, indicating robust market activity.
Key Drivers Behind Today’s Bitcoin Rally:
New All-Time High: Bitcoin recently surpassed its previous record, hitting nearly $118,800, fueling bullish momentum.
Massive Short Squeeze: Over $1 billion in short positions were liquidated within 24 hours, including around $570 million in Bitcoin shorts, accelerating the price rally.
ETF Inflows: US spot Bitcoin ETFs have seen substantial inflows (around $50 billion this week), signaling strong institutional demand.
Technical Breakout: Technical indicators show a strong bullish trend, with Bitcoin targeting levels above $126-130K,
Macro Environment: The US dollar is weakening sharply (its worst performance since 1973), boosting risk assets like Bitcoin.
Growing Adoption: Corporate treasury purchases and positive regulatory developments in the US are enhancing investor confidence.
Market Sentiment and Outlook:
The Relative Strength Index (RSI) is above 70, indicating strong bullish momentum but also suggesting caution for a possible short-term pullback.
The number of Bitcoin wallets holding BTC has increased significantly, showing renewed accumulation by investors.
Technical Outlook Bullish, target $120K+
Bitcoin’s rally today is driven by a powerful combination of technical breakout, institutional buying, short squeeze dynamics, and supportive macroeconomic factors, making it one of the strongest moves in crypto markets this year.
#BTC #BITCOIN

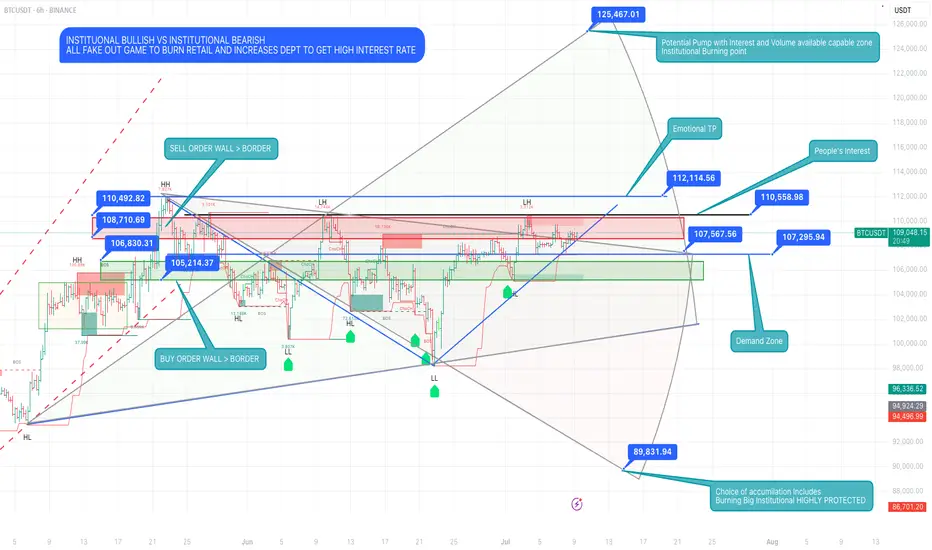
The Whale’s Blueprint: Read It Before It Happens🧠 The Real Game
Institutional Bullish vs Institutional Bearish — It Was Never About Direction.
This chart isn’t about setups.
It’s a blueprint of manipulation, a battlefield map where:
• Retail gets trapped at emotional highs
• Liquidity gets swept in layers
• Institutions reload in silence
• And the price becomes the puppet, not the player
🔺 Top Red Zones (106K–112K):
These aren’t resistance. They’re execution zones for sell walls, fake breakouts, and late long liquidations.
🔻 Green Demand Zones (105K & Below):
Not support. They’re reaction chambers — where whales absorb panic and retail exits in fear.
💥 125K is not a fantasy. It’s a controlled explosion waiting to happen —
But only if the trap is set right and the fuel (volume + interest) loads in.
🧱 Real accumulation doesn’t happen in comfort.
It happens in the shadows, at the edges of fear.
This isn’t price action.
This is power action.
⸻
“Most trade the surface.
Snipers wait beneath it…
and strike before the story reveals itself.”
#BTCUSDT #LiquidityGame #WhaleTrap #InstitutionalZones #SniperMindset #KaizenMethod #TheRealGame
BTCUSDT | 30-min & 4H Outlook🔍 Structure & Price Action
BTC is trading within a rising wedge (blue lines) nearing apex — typical bearish setup.
Price is repeatedly getting rejected near macro trendline (~108.8K–109K).
30-min shows clean breakdown from lower wedge support, retesting the zone now.
On 4H, BTC is still under key resistance zone between 109.6K–110.4K, previously rejected twice.
🔻 Bearish Signals
Multiple Sell signals on both timeframes.
Bearish divergence visible in RSI and MACD on 4H.
Volume spike on the breakdown → confirming sellers in control.
🔑 Key Levels
Support: 107.7K (current zone) → loss opens path to 106.6K, then 104.4K.
Resistance: 108.9K–109.4K = confluence of EMA cluster + macro TL + Fib zone.
📊 Indicators (4H)
RSI dropping from mid-zone (~48), no bullish momentum
DMI shows increasing ADX with -DI over +DI → trend strengthening bearish
TSI & Wave Trend both curling down
Stochastic in overbought, starting to reverse
🎯 Summary
Bias: Bearish below 108.6K
Invalidation: Bullish breakout above 109.6K + volume close
Setup: Watch for retest and rejection at ~108.4K–108.6K = clean short trigger
Next Targets: 107.2K → 106.6K → 104.5K

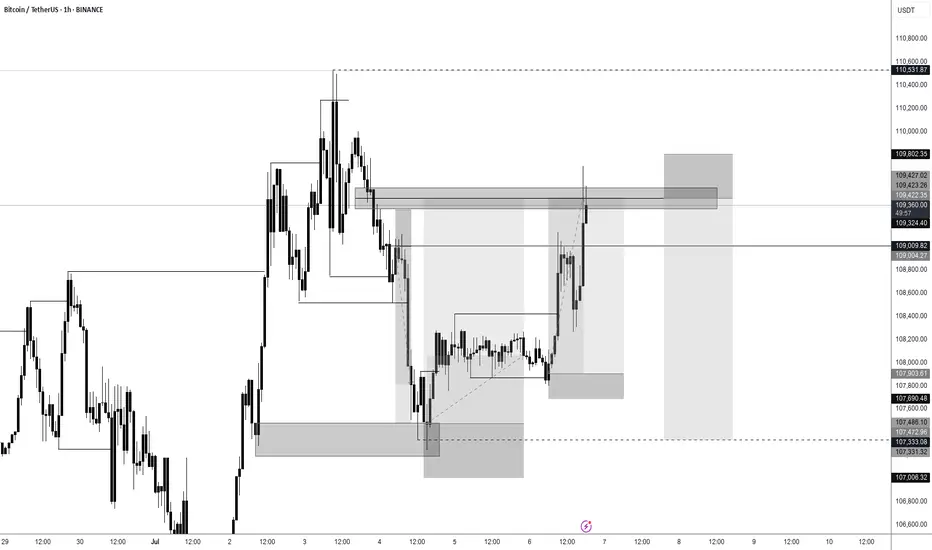
BTC HTF Distribution V2This is still the main scenario I'm looking for until it's invalidated. A build up like this, followed by a fake breakout out of this rising wedge as 3rd tap would be perfect.
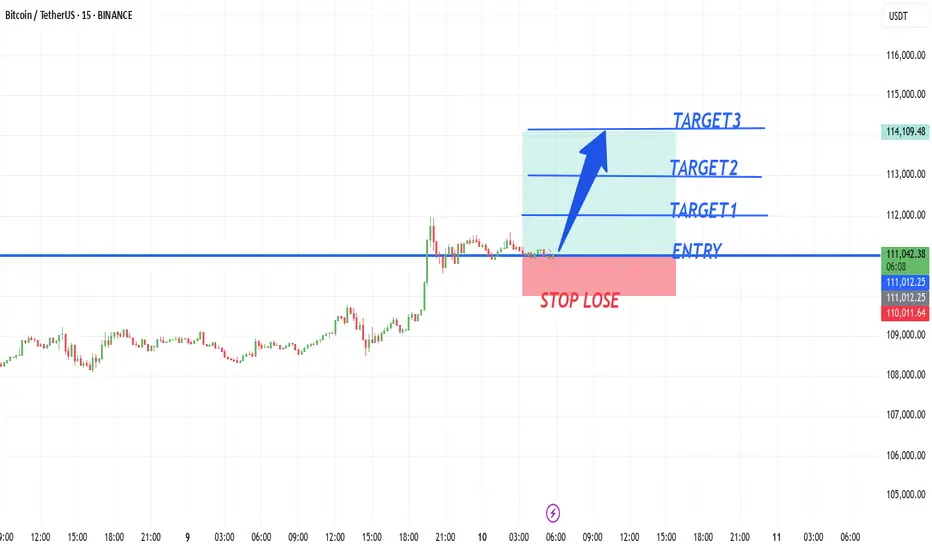
BTCUSD NEW LOOKBtcusd buy from 111,000,
target1 112,000
target2 113,000
target3 114,000
Stope lose 110,000
TRADE AT YOUR OWN RISK
Bitcoin ATHBINANCE:BTCUSDT This is amazing for crypto community because this level-up all of lover crypto currencies.
Next target: 120.000K
Best for pollback levels: 111.000K & 105.500K
👓We are this time keep calms emotional in buy or sell.

BITCOIN ATH? More to come!With BTC seeing a new ATH, speculations are there for whether it continues in upward projection or falls back.
My prediction is simple, CRYPTOCAP:BTC will do a temporary pullback around the 109,000$ region and goes back up to around 113,000$ within the shortest time.
This temporarily pullback will be a result of buyers who already took their profits. Of course, Institutional investors are even more poised to buying more.
News may impact this projection but investors are willing to see it fly.
Ultimately, you can never go wrong with Bitcoin buy.
#DYOR #NFA
Bitcoin (BTC): We Called It, $120K Happening + Volatility ComingBitcoin had an amazing start and bounce from our buy zone, where price has bounced properly and is now heading toward the local high area, which we intend to see broken.
So far the buyers keep the dominance momentum well, but we have to remember, during such times when we are approaching the ATH area, volatility is guaranteed, and so is the liquidity hunting in both ways.
Swallow Academy

BTC & USDT.D => Bullish Correction Incoming?Hello TradingView Family / Fellow Traders. This is Richard, also known as theSignalyst.
Both BTC and USDT.D are sitting around key rejection zones.
💰 BTC is hovering near the $100,000 level — a major previous low and a psychological round number.
📊 Meanwhile, USDT.D is testing the 5% resistance — a supply zone and another critical round number.
As long as $100,000 holds as support on BTC and 5.1% holds as resistance on USDT.D, we could expect a bullish correction across the crypto market.
What do you think? Will these levels hold or break? 🤔
📚 Always follow your trading plan regarding entry, risk management, and trade management.
Good luck!
All Strategies Are Good; If Managed Properly!
~Rich

BTCUSDT idea within the next 24 hoursas explained in the video, im taking the trades as projected in my video...
i will share any update if anything changes

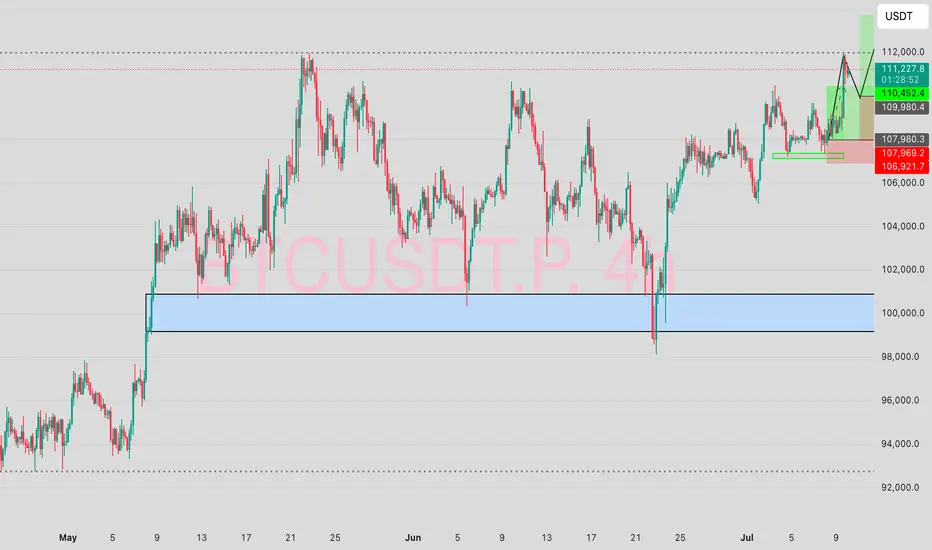
BTC Roadmap Still Intact Bullish Momentum Building Toward 120KBitcoin Price action continues to validate the bullish roadmap shared in our last BTC post. The market respected the Immediate Buy Back Zone, springing from a demand backed structure into a fresh impulsive leg.
Notably, price has carved a clean 5-wave structure supported by recurring bullish pennants and continuation patterns each breakout driving momentum higher. Our target at 120,151 remains firmly intact, with price action showing healthy structure and controlled pullbacks.
The current setup remains valid as long as price holds above 106,655 and especially 100,941, which now act as structural pivot zones. Any deeper correction into the Demand Area would only serve as a re-accumulation window before the next leg.
Let’s see how price behaves into June. Momentum is aligning with structure.
Share your thoughts, like the post, and drop your setup confirmations on the comment section.

Lower time frameI've shared an analysis from a lower time frame, that could indicate the start of a big move.

Is Bitcoin Getting Ready to dump?
In this analysis, I looked at the weekly, daily, and 4-hour timeframes and found some key signals that suggest a major shift might be coming in Bitcoin’s movement over the next few days and weeks.
If you don’t want to get caught off guard by the next big move, make sure to watch the video all the way through!

Bitcoin: The night before the plunge? →104,000?
Bitcoin fell under pressure from highs, with short-term bearishness but strong long-term fundamental support.
1. Market fundamentals
Institutional holdings continue to grow
BlackRock Bitcoin ETF (IBIT) exceeds $72 billion in size, dominating the market
MicroStrategy holdings increased to 597,000 BTC (about $63 billion), continuing to increase holdings on dips
Global Bitcoin ETF Net inflow of $4 billion in June shows strong demand for institutional allocation
Policy and regulatory progress
The U.S. Treasury Department plans to include Bitcoin in the "strategic reserve assets" to enhance its legal status
The SEC will make a ruling on spot ETF option transactions on July 15, which may bring new liquidity
The Trump administration plans to impose a 60% tariff on China, and market risk aversion may heat up again
On-chain data changes
A 14-year dormant address recently transferred 80,009 BTC (about $8.69 billion), triggering concerns about selling
The lightning network capacity exceeded 5,000 BTC, and Tether (USDT) completed the lightning network integration
II. Technical depth Degree analysis
(1) Medium-term trend structure (4-hour level)
Rising channel break: After the price peaked at $112,000, it continued to fall below the rising trend line support
Range oscillation formation: Currently, $98,000-110,700 constitutes the main trading range, and the middle track support is $104,000
Volume change: The recent decline is accompanied by an increase in trading volume, indicating that the short-term momentum is increasing
(2) Short-term trading signals (1-hour level)
Double top pattern confirmation: $110,700 was tested twice without breaking, forming a typical reversal structure
Moving average system short arrangement: EMA5/10/30 formed a death cross, suppressing price rebound
Key support level:
▶ First support: $106,500 (Fibonacci 38.2%)
▶ Second support: $104,000 (psychological barrier + previous low)
▶ Strong support: $98,000 (lower track of the range)
III. Trading strategy suggestions
1. Aggressive short position layout
Entry range: $109,000-109,500
Stop loss setting: $111,000 (above the previous high)
Target: $106,500→$104,000
Technical basis: downward trend line suppression + RSI top divergence
2. Steady retracement of short positions
Entry signal: 108,000-108,500 rebound encountered resistance
Stop loss setting: $110,000 integer barrier
Target: $104,000 (break down to see 98,000)
3. Long defense area
Key observation position: 104,000 US dollars (if there is a large volume to stop the decline, you can try long with a light position)
Breakthrough signal: Stabilizing 110,700 US dollars will restart the upward trend
IV. Multi-dimensional market outlook
Short-term (1-2 weeks):
Affected by technical suppression and whale movements, it is expected to maintain 104,000-110,700 range fluctuations
Focus on the effectiveness of 106,500 support, breaking down will accelerate the test of the lower track of the range
Medium-term (Q3 quarter):
Institutional continued holdings + Fed rate cut expectations constitute long-term support
If it breaks through 112,000 US dollars, it will open up to 120,000-125,000 upside space
Risk warning:
The SEC option trading ruling on July 15 may cause violent fluctuations
Global macroeconomic data (especially CPI) will affect market risk preferences
V. Professional trading suggestions
▶ Currently, the "rebound short" strategy is preferred, and stop loss is strictly set
▶ Long-term investors can arrange in batches in the range of 98000-104000
▶ Pay close attention to:
Daily ETF fund flows, changes in on-chain whale addresses (glassnode alert system), US CPI data (released on July 12)
Conclusion: Although the short-term technical side is bearish, the long-term fundamental support of Bitcoin remains solid. It is recommended that traders seize the opportunity of range fluctuations, operate flexibly at key support/resistance levels, and wait for new trend signals to be confirmed.

BTC BEARISH IDEAL HOT BTC bullish ideal, BTC buys where Sensational and i dont expect the sell to be les either me and my whole theam eat let get it with BTC
BTC - Falling Correction = Continuation?BTC has been playing by the rules lately!
Every time Bitcoin forms a falling correction, it turns out to be a bullish continuation pattern — and history might be repeating itself 👀
As shown on the chart:
Previous falling channels (flag/wedge structures) have consistently led to strong bullish impulses.
The current correction also appears to be a falling channel, hinting at another potential bullish leg soon.
As long as the structure holds and no major support is broken, the next target could be a new all-time high.
Let’s see if BTC continues to respect this textbook behavior.
📌 Remember: Falling corrections in an uptrend = healthy continuation!
📚 Always follow your trading plan regarding entry, risk management, and trade management.
Good luck!
All Strategies Are Good; If Managed Properly!
~Rich

BTCUSDT – Market Update & RecommendationBTCUSDT – Market Update & Recommendation
In my previous analysis published on June 1, 2025 (TradingView), I mentioned the corrective pullback towards the $100k area before BTC resumed its next upward wave.
My latest evaluation (posted recently on my personal blog, linked in my TradingView signature) stated clearly that BTC would rise toward $110k, then experience a minor retracement to around $108.2k before consolidating and reaching new ATH between $118k–$125k.
At present, BTC has successfully touched the $118k mark and is undergoing a minor correction—this is a critical consolidation phase before price approaches the significant $125k distribution zone.
Recommendation:
Investors holding BTC purchased below $108k should closely monitor price action to secure profits as necessary.
Consider signals for potential Swing Short positions based on monthly (M) timeframe bottoms. This is a powerful and extended signal, potentially lasting until the end of 2025.
Caution is advised for any new BTCUSDT positions at this time.
Link:

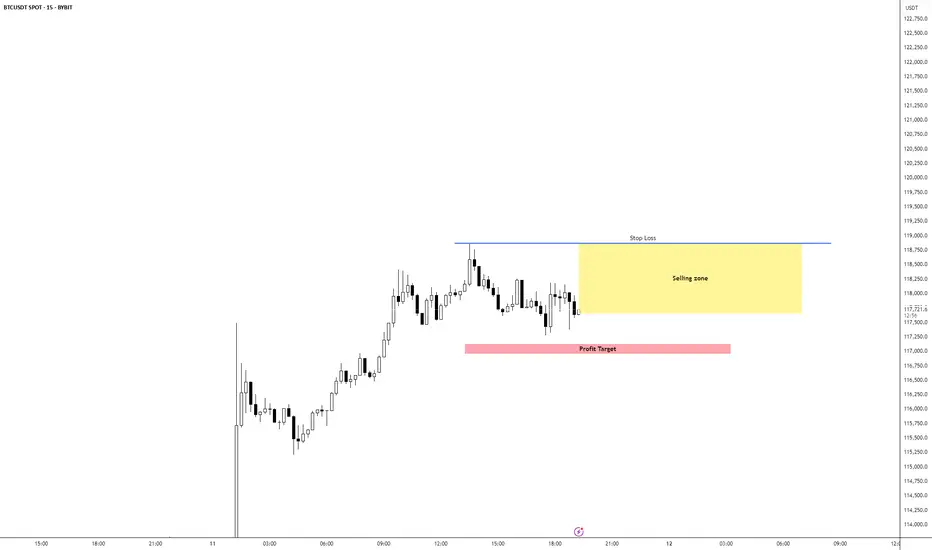
BTC/USD Short IdeaBTC/USD is currently bullish overall but seems overextended, Expecting a pullback to the 5m Equilibrium levels which would be our TP area. 1M has switched bearish adding confluence to our setup.
I would be layering short positions inside the yellow selling zone
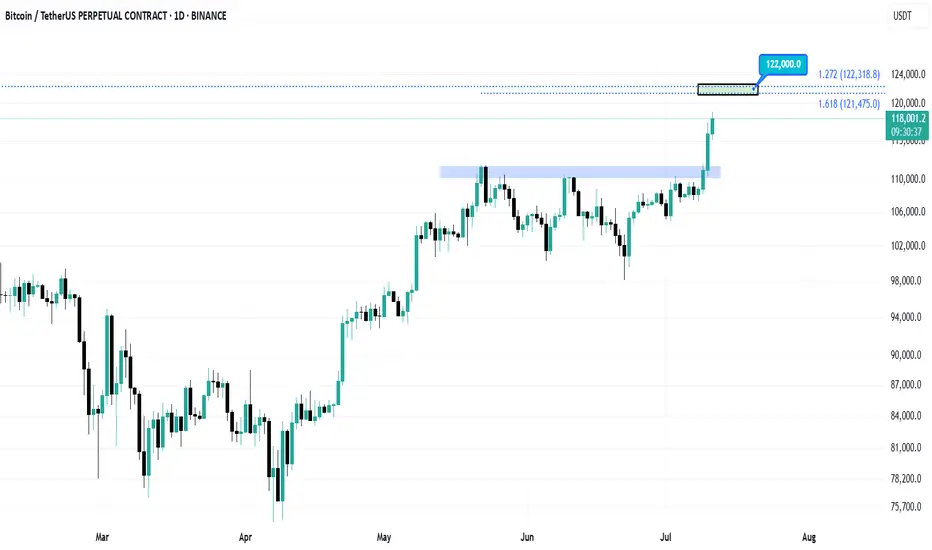
BitcoinThe next target for Bitcoin is $122,000.
I will update the chart when this target is reached.
Follow so you don't miss the next analysis.