BTC LongThis is a reversal trade, so be careful!. When its reversal trade, stick to SL regardless.
The reason for the trade is as simple as higher lows on 4h tf, broke a downtrend line.
Good luck everyone !!
Trade ideas

BTC Update – DecemberBitcoin continues to trade within its corrective structure, gradually moving toward the key $72,000 liquidity zone. This level remains our primary target before the market potentially confirms a strong bullish reversal.
As highlighted in our previous analysis, this correction is a normal part of market structure and may serve as the final pullback before the next major upward leg.


BTCUSDT: Trend in 1-H time frameThe color levels are very accurate levels of support and resistance in different time frames.
A strong move requires a correction to major support and we have to wait for their reaction in these areas.
So, Please pay special attention to the three accurate trend, colored levels, and you must know that SETUP is very sensitive.
BEST,
MT

BTCUSDT - The BottomI am looking at $75k-$80k for a bottom before a push upward to $128k or hopefully beyond

BTCUSDT – Bullish Reversal Setup at Key SupportBitcoin has made a sharp impulsive drop into a key higher-timeframe support zone (highlighted in yellow). This area has previously acted as strong demand, producing a significant bounce on Nov 27.
Price has now tapped back into this zone with a long lower wick, showing early signs of buyer absorption. If the support continues to hold, this area offers a potential long (buy) entry, as marked on the chart.
🔹 Key Points
Support Zone: 86,800 – 87,400
Entry Area: After confirmation within support (marked “ENTER”)
Market Reaction: Strong sell-off into support followed by initial rejection (blue circle)
Bias: Bullish as long as support holds
🎯 Target
Upside continuation toward 90,500 – 92,000 (target zone on chart)
⚠️ Invalidation
A clean break and candle close below the support zone would invalidate the long setup.

BITCOIN CAN RETURN TO 83K AFTER BREAKOUT 90k+There is a good chance that Bitcoin could return to a new target after the breakout.
There are more TA reasons that a correction could happen at Bitcoin.

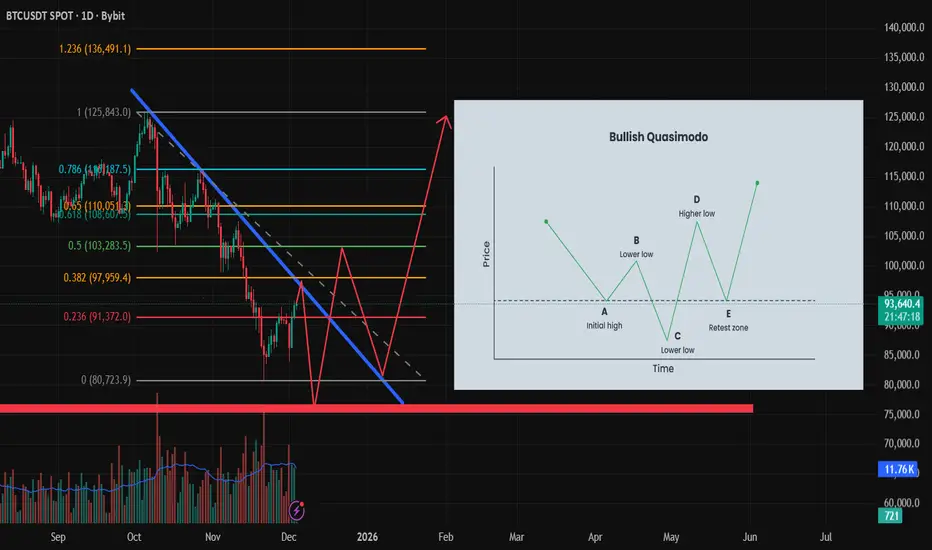
BTC Bullish Quasimodo Forming? Potential Reversal Setup 80k–125kBitcoin continues to trade below the macro descending trendline, respecting lower highs since the last major swing high. Price is currently around the 93k area, reacting to a minor resistance + Fibonacci cluster.
🔍 Why a Bullish Quasimodo Is Possible
A Bullish QM (Quasimodo) pattern forms when the market creates:
Initial High
Lower High
Lower Low (liquidity sweep)
Higher Low (retest zone)
Break of Structure to the upside
BTC appears to have formed steps 1 and 2, and may be setting up for a deeper sweep to complete the Lower Low around the major demand zone.
🧭 Projected Price Path
Short-term expectation (bearish liquidity sweep):
Possible rejection from the descending trendline
Decline toward 91,300 → 88k → 86k
Final liquidity sweep into ~80k, which aligns with a major demand zone and previous volume imbalance
Mid-term expectation (bullish reversal):
Strong bounce from the 80k zone
Formation of the Higher Low (QM retest zone)
Break above the descending trendline
Upside targets:
97,900
103,200
108,000
125,000+ (Fibonacci extension target)
🎯 Bias Summary
Short-term: Neutral to bearish (liquidity sweep expected)
Mid-term: Bullish reversal if QM structure completes and price forms a Higher Low
⚠️ Invalidation
A clean daily close below 78,500 invalidates the Bullish QM scenario.
Bitcoin (BTC) Update, Bearish Rejection?Bitcoin continues to struggle beneath the $94,000 resistance zone, with multiple failed attempts to break above it. The region aligns with daily resistance, the 0.618 Fibonacci, and VWAP, making it a critical barrier.
With weak bullish volume and rising rejection pressure, BTC risks rotating back toward the next major support at $78,430, which lines up with the weekly high-time-frame support and channel low.
Key Points:
- BTC consolidating below $94,000 with repeated failed breakouts
- Heavy resistance from 0.618 Fib, VWAP and daily level
- Losing the point of control could trigger downside acceleration
What to Expect:
If BTC breaks below the point of control, expect a flush toward $78,430. Bulls need strong volume to reclaim $94,000 and shift momentum.

Bitcoin (BTC): 100 EMA Holds | Entering Into Bear Market SoonBitcoin buyers are not giving away that 100 EMA easily; they hold this zone and as long as we are above that mark, we are looking for one last bullish movement here.
Now if we talk about cycle times and how long each cycle has been lasting, we can assume that we are about to enter the bearish market, but one last push should follow before the dip.
So we are looking for a bearish market to start around Dec-March, as soon as we get that one last pump.
Swallow Academy

BTC(based on NEo wave)this is not a trend-impulse...it is terminal and if it hit the limitation of wave 4 its a natural triangle and its not wave C of a flat.

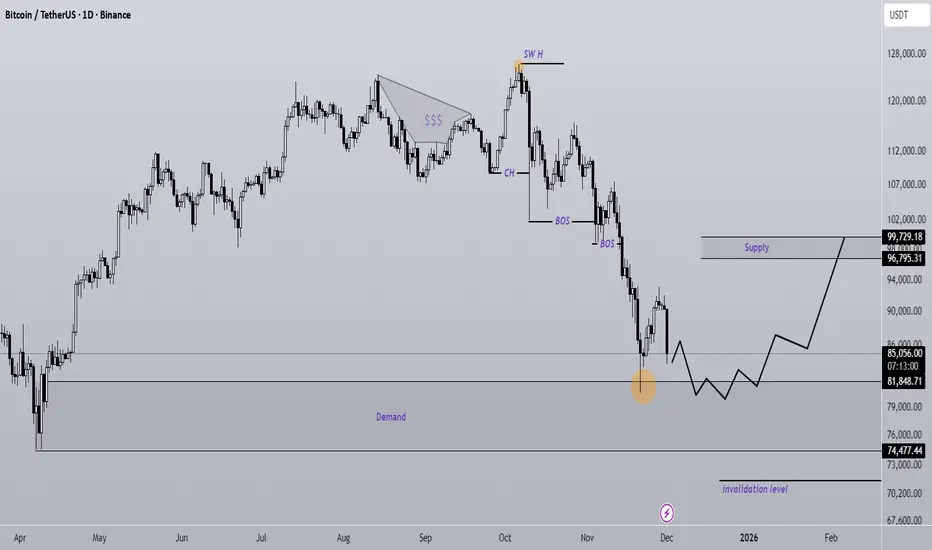
Bitcoin new update (1D)Bitcoin has not yet fully absorbed the buy orders in the marked support zone. This time, upon tapping the support area again, we can expect the price to form a stronger bullish move, at least toward the identified supply zone.
A daily candle closing below the invalidation level will invalidate this outlook.
Do not enter the position without capital management and stop setting
Comment if you have any questions
thank you
BTC. End of correction long.Only if we can take the 94.6 level the true long confirmed. Otherway it flat between 85 -95 +/-

Bitcoin Overall: Likely in Bear MarketI've had a blue parabola on my BTC charts--turns out if I switch the chart to log it becomes a line. In any case, we have a seemingly valid Elliott Wave top--ending diagonal wave 5--and now we seem to be on wave 4 of a 5-wave move down.
An alternative scenario is there's still upside, and this is currently a very severe expanded flat--but that is unlikely and would require fairly strong momentum from these levels.
If one still holds BTC I'd recommend a sell in the 94-100K range and buy back lower in 9 months or whatever.
Will do a little analysis to see if there's any probability of an alt season next.

BTCUSDT.P - December 1, 2025The chart shows Bitcoin breaking down sharply from a rising wedge‑type structure after failing to sustain prices above the 91,000–91,500 resistance band, confirming short‑term bearish momentum on the 15‑minute timeframe. Immediate support sits around 86,000–85,500 where price is currently reacting, but the highlighted lower zone near 82,000–81,500 represents the next downside target if this local support gives way, aligning with the projected stop level for any counter‑trend long attempt. The higher‑probability play is to wait for either a clear bullish reversal pattern and strong candles off the 85,500–86,000 area to target a corrective bounce back toward 91,000, or a weak consolidation followed by continuation selling into the lower support box to consider fresh shorts with stops above the broken intraday resistance.

Lingrid | BTCUSDT Major Resistance Rejection. Potential Sell BINANCE:BTCUSDT perfectly played out my previous trading idea. Price has broken sharply below the pullback channel after failing to sustain momentum into the 93,000 resistance zone — a heavy confluence of the mid-channel trendline and the broader descending structure. This rejection confirms another lower high, reinforcing the dominant bearish sequence visible since early November. The breakdown signals a shift back into trend continuation mode, with sellers retaking control after a corrective rally.
As long as CRYPTOCAP:BTC trades below 90,000–92,000, the downside path points toward the 81,000 support, where the previous bottom formed and where a potential double-bottom setup may emerge. Momentum remains pressured, and liquidity below the recent swing low increases the probability of a sweep toward 81,000, and possibly deeper into the buying zone.
➡️ Primary scenario: continuation lower → targets 81,100.
⚠️ Risk scenario: a breakout above 93,800 would neutralize the bearish outlook.
If this idea resonates with you or you have your own opinion, traders, hit the comments. I’m excited to read your thoughts!

Chart Analysis: BTC / USDT (Weekly Timeframe)Pattern: EMA Retest (Potential Breakdown Risk)
The chart shows Bitcoin (BTC) facing notable bearish pressure after recent highs. Price is currently testing the 50-week EMA, a historically important support zone that has previously triggered strong bullish rebounds. However, current momentum shows weakness as sellers dominate.
Key Observations
🔹 Support Zone: Around $100,900 (50 EMA) — acting as critical dynamic support.
🔹 June Low Support: Near $98,200, the next major level to monitor.
🔹 Bearish Candle: BTC down nearly 8% for the week, showing strong selling pressure.
🔹 Bull Bear Power (BBP) Indicator: signaling that bearish strength outweighs bullish demand, and selling momentum remains strong.
🔹 Previous Bounces: The last two retests of the 50-week EMA (circled) led to solid recoveries, but this time, price action looks weaker and sentiment more cautious.
Potential Move
If BTC fails to hold above the 50-week EMA, further downside targets could be:
🎯 Target 1: $95,000
🎯 Target 2: $90,000
Conversely, a strong bullish reaction from the 50 EMA may spark a rebound phase and signal renewed accumulation.
Summary:
Bitcoin is currently at a critical support retest on the 50-week EMA. The Bear Power indicator suggests growing downside pressure, and a weekly close below $100K could confirm a deeper correction. Holding this zone, however, might preserve the broader uptrend.
#Bitcoin #BTC #BTCUSDT #CryptoAnalysis #TechnicalAnalysis #TradingView #CryptoTraders #CryptoMarket #BullBearPower

Wave (I) Completed at 126K — Wave (II) in ProgressBINANCE:BTCUSDT
On the weekly chart, the advance clearly topped at 126K.
Momentum had already begun to fade before the peak, and several indicators confirmed it:
-- RSI : formed a lower high compared to the Wave 3 peak, signaling weakening upside momentum.
-- MACD : showed a noticeable loss of strength during the final push.
-- ADX (+DI/–DI) : reflected declining trend strength as +DI weakened and –DI gained traction.
Price also made a new high without matching momentum - a typical exhaustion pattern often seen near major market peaks.
Together, these weekly signals confirm that 126K marked the completion of Wave (I), and that the current decline represents the early phase of a broader Wave (II) correction.

BTC Next JourneyBTC must maintain 82,550 $ to survive from worse scenario, details in the attached monthly chart

Bitcoin – Technical + Fundamental Analysis
📊 Technical Situation
BTC remains inside its bullish ascending channel, with lower boundary still holding well.
Yesterday, price failed to break above the channel’s mid-line / resistance, suggesting consolidation is needed.
A drop toward the lower boundary of the channel could provide good liquidity and a support zone for a bounce.
If that support holds, price could attempt a new upward swing targeting ~94,000 USD, assuming resistance is overcome.
🌐 Fundamental Context
Risk sentiment remains shaky: as traditional markets show volatility, crypto tends to follow — higher Treasury yields and macro pressure have weighed on Bitcoin recently.
On the other hand, medium-term tailwinds remain: growing concerns over global money supply and potential monetary easing support Bitcoin as a hedge against inflation and currency debasement.
Institutional flows remain a mixed factor: while some investors are reducing exposure, others view dips as opportunities — this could generate volatility, but also strong rebounds if sentiment flips.
🎯 What I Expect
Ideally, BTC corrects toward the channel floor before resuming upward — this sets up a buy-the-dip opportunity.
If macro conditions worsen (rising yields, global risk-off), expect pressure toward lower channel support or even deeper.
If support holds and yields/market sentiment improve, Bitcoin could push toward 94,000 USD or higher.

BTCUSD - D11. Completed 5-Wave Decline
The downtrend from the triple-top region completed like this:
(1) bearish impulse
(2) corrective rally into BOS breaker block
(3) extended wave — largest impulse
(4) weak correction respecting trendline
(5) final capitulation into massive liquidity BUY zone (blue)
Your chart correctly marks the final liquidity sweep, which forms the foundation for reversal.
This 5-wave completion is the strongest indication that a trend reversal is starting on D1.
2. Liquidity Grab + ChoCH = Reversal Confirmation
At the bottom:
Price swept deep liquidity under the entire October–November structure.
Then formed a ChoCH (change of character) upward.
This is the D1 first sign of bullish strength.
Smart money accumulated in the blue zone → now initiating the markup phase.
3. Current Price Action – Ascending Structure Forming
Price is building:
A bullish wedge / re-accumulation structure
Multiple higher lows
Price breaking the internal descending trendline
This matches exactly the pattern drawn on your chart.
4. Expected Move (Based on Your Projection)
BTC is likely to follow a two-leg bullish cycle:
🔹 First Target Zone: 100,000 – 102,500 (Supply Zone)
This is the first major D1 supply, created during Wave (4) & internal bearish OB.
Expect:
A reaction
A short-term pullback
Possibly forming a higher low around 95,000–97,000

BTC-USDT
The 2-hour chart has reached its short-term support at 92,800 📌
If this level is broken,
it's likely that the correction could continue down to the psychological support at 90,000 dollars, which is natural after the good growth it had 📉💸
The next upward move will happen when the red resistance is broken, in that case, it could go up to 95,900 🔼✔️

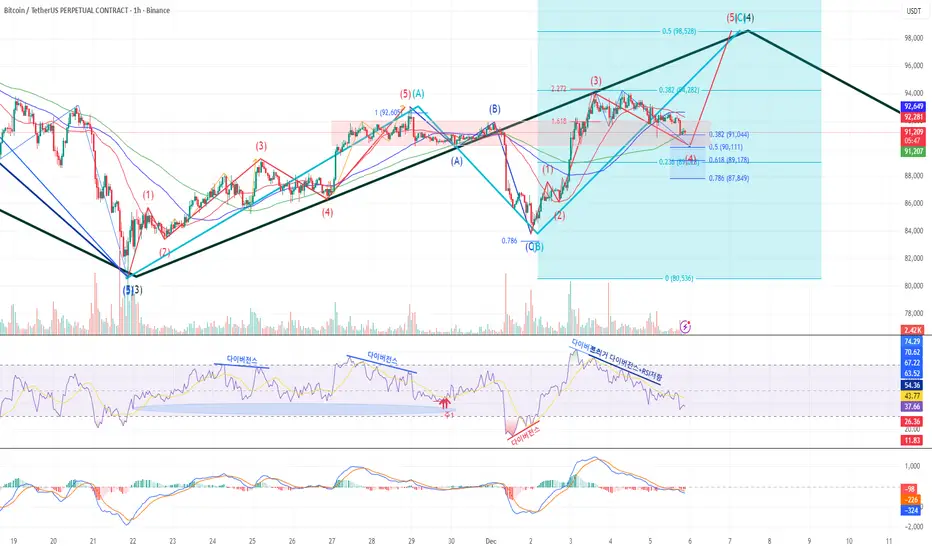
The larger Wave ④Bitcoin 1H Chart Analysis
Currently tracking a light blue ABC correction within the larger Wave ④.
Wave C is unfolding as a 5-wave structure; currently in Wave ④.
Adjusted the wave count this morning: what was initially labeled as Wave ① is now considered Wave ③, due to its extended size.
Wave ③ appears to have completed near the 2.272 Fibonacci extension.
A divergence formed, leading to the current Wave ④ pullback, which is finding support at a key supply-demand zone.
Watch for a MACD oscillator crossover — this could signal the start of Wave ⑤.
Focus on reactions at the support zone for trade decisions.