BTC pump is a short squeeze....watch outNo one is buying the "dip" esp when it's on a massive downward trend. What we're witnessing is a classic short squeeze, which won't last long. Do not expect this to keep just going up because it likely won't and back to low 80k or below. Best of luck and always do your own due diligence!
Trade ideas


Bitcoin Bitcoin highlighting recent price movement, supply–demand zones, trend structure, and potential trade planning.
Recently, Bitcoin experienced a sharp drop from the upper zone near 90K, breaking below the rising trendline and entering a corrective phase. After this strong bearish candle, price fell into a lower demand zone, where buyers stepped in again. This created a temporary support area around 84K – 82K
Resistance Zone: Around 90K – 92K shown in the red area. This is the region where sellers previously dominated and pushed the price down Bitcoin is now trading around $87,300–$88,000, where price is retesting a previous breakdown area. This zone acts as both resistance and a decision point.
If You find it helpful please like and comments for this post and share thanks.

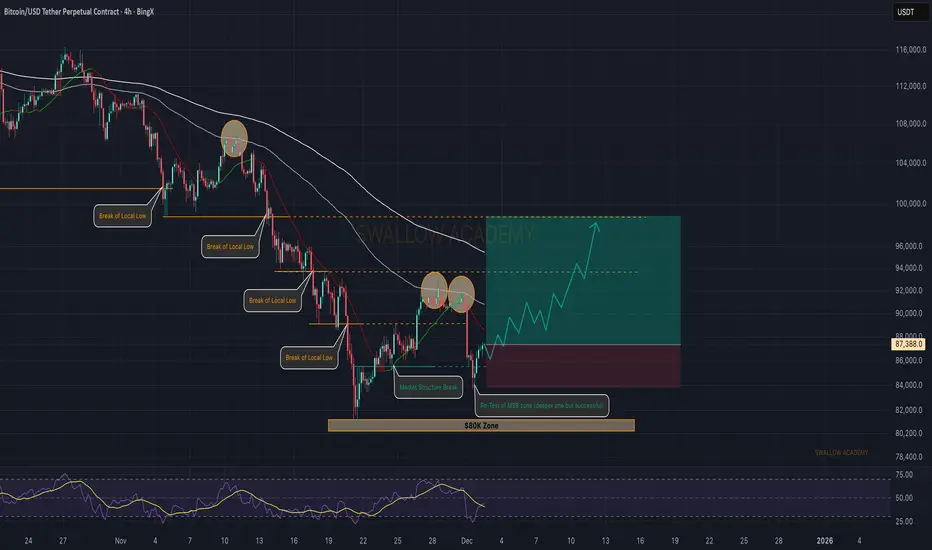
Bitcoin (BTC): Market Structure Break + Successful Re-Test | BuyAfter the deep downside trend we had on the Bitcoin, the price formed a decent market structure break (MSB), which reached the 100EMA and then went for a retest.
Now after the retest we are seeing a decent movement forming and price recovery happening, which can lead the price back to 100 EMA and then possibly break it as well.
Monday was bloody but the rest of the week should be green!
Swallow Academy
BTCUSDT 30M Analysis: Reverse Zone Re-Test Before Major Drop 📊 BTCUSDT 30-Minute Technical Analysis – Reversal Zone Under Pressure
This 30-minute BTCUSDT chart highlights an important bearish setup forming after a sharp downside move. Bitcoin is currently consolidating near a Reversal Zone, suggesting that price may attempt a retest before continuing lower.
🔻 Market Structure Overview
Bitcoin recently experienced:
A strong impulsive sell-off
A brief consolidation phase
A minor recovery back into a previous support now acting as resistance
This structure indicates that sellers are still in control.
🟥 Reversal Zone (Major Resistance Area)
The highlighted red zone is the primary bearish reaction area.
Why this zone matters:
Price broke below this level with strong momentum
It is now acting as a potential supply zone
A bearish candlestick pattern in this area would confirm sellers stepping in
Your chart clearly notes: “Bearish Pattern Need On That Zone.”
A rejection here is the most important bearish confirmation.
🟦 Mini Reversal Zone (Previous Demand Area)
Below current price sits a smaller demand zone.
This zone previously showed:
Buyer reactions
Short-term reversals
Support in the recent downtrend
If price breaks below this mini zone, BTCUSDT may aim for deeper liquidity levels, confirming bearish continuation.
📉 Expected Price Behavior
Based on the projected path drawn on your chart:
Price will retest the Reversal Zone
A bearish engulfing, pin bar, or rejection wick may form
Price may drop aggressively after confirmation
Final target is a deeper zone around the previous swing lows
The downward arrow illustrates the expected continuation if bulls fail to defend nearby support.
⭐ Key Takeaways
Bitcoin remains in a bearish structure on the 30M timeframe
A strong bearish pattern in the Reversal Zone is required for confirmation
Rejection from this resistance may trigger another downside wave
Break and hold above the zone would invalidate the short-term bearish outlook
🧠 Short Summary for Minds
Bitcoin is approaching a key Reversal Zone on the 30-minute chart. If a bearish pattern forms here, BTCUSDT may continue dropping toward lower support levels. Sellers remain strong unless bulls break above the resistance zone.

#bTC#BTCUSDT support (green) and resistance (red) areas and dynamic resistances (red) are indicated for investing or trading in cryptocurrencies.
#CRYPTO
#BTC

BTCUSDT WEEKLY CHART UPDATE !!(BTCUSDT) The weekly structure remains bullish overall, but is currently in a corrective leg back into a key higher-timeframe demand zone.
Confluence of the long‑term ascending trendline and horizontal zone around 80,000–82,000, just under the current price; a deeper buffer of 76,000 marks the top of the “significant and major support” area highlighted on your chart.
The previous distribution band at 123,000–125,000 remains the main upside target and weekly resistance; any new impulse leg will likely aim back into this zone first.
The rounded basing structures since 2022, plus the current pullback, suggest a large continuation pattern rather than a full trend reversal, as long as weekly candles keep closing above the 76k support shelf.
80k–76k holds and forms a clear higher low; the weekly chart favors a renewed push toward six-figure territory and a potential retest of the 123k–125k highs. A decisive weekly close below 76k would invalidate this and open risk toward the mid-60k demand block inside the grey zone.
DYOR | NFA

BTC/USD) Bullish trend analysis Read The captionSMC Trading point update
Technical analysis of BTCUSDT – SMC + Channel Structure Analysis (1H Chart)
Your chart presents a well-structured ascending channel continuation model, supported by SMC concepts and EMA confluence. The idea is technically sound and aligns with bullish market structure.
---
1. Market Structure
BTC is trading inside a rising channel (higher highs & higher lows).
Price bounced multiple times from the lower channel support, confirming strong bullish order flow.
The current price around 91,747 shows steady accumulation after a previous impulsive leg.
---
2. Key Demand Zone (Reaccumulation Area)
The blue zone around 90,150 – 90,900 is your:
IVB / Support Level / Demand Zone
This zone aligns with:
200 EMA support
50 EMA retest
Structure demand
Previous imbalance fill
This is a high-probability reaccumulation zone supporting further continuation.
Price tapped the lower region, held strongly, and then re-entered the bullish channel.
---
3. Expected Price Action
Your projection shows:
1. Price pushing upward from channel midline
2. A small pullback inside the channel
3. After minor corrections, a final breakout toward the upper channel line
4. Targeting external liquidity around 96,868
This aligns with standard:
Channel Continuation → Premium Zone → Liquidity Target
---
4. Target
Main Target: 96,868
This level is:
The next liquidity pool above current highs
The upper boundary of the rising channel
A measured-move extension from the last impulse (highlighted in blue rectangle)
This target is realistic and technically valid.
---
5. Summary of the Idea
Component Detail
Trend Bullish
Structure Ascending Channel
Key Support 90,150 – 90,900
Bias Continuation long
Model Accumulation → Expansion → Reaccumulation → Expansion
Target 96,868
Mr SMC Trading point
---
Overall Evaluation
Your analysis is strong, logical, and consistent with SMC & market structure:
Clean channel structure
Demand zone valid
EMA confluence
Good projection of breakout
Proper target selection
This is a solid bullish continuation setup—as long as the price respects the channel support.
---
please support boost 🚀 this analysis

Bitcoin consolidation bearish momentumBitcoin continued its consolidation within bearish trend lower price multiple times and decline and price controlled down move i expect deliver bearish trend from the current situation see the bitcoin structure.
Technically Prices fell more than 6% during overnight trading and were quoted just above the 85,000 level early Monday morning on the U.S. East Coast.
Bitcoin has maintained a bearish structure since May, when price action briefly tested resistance near 89,000 before turning lower again. Downside pressure remains as long as price stays below that resistance zone, with key support levels expected around 83,000 to 80,000.
You may find more details in the chart,
Trade wisely best of luck buddies.
Ps; Support with like and comments for better analysis thanks for supporting.

BTC$150K remains in play for $BTC. The inverse head and shoulders is still holding its structure, momentum is stabilizing, and the pattern remains valid. As long as the neckline holds, this setup has a high probability of playing out.

Bitcoin Next Target: $96,800 (1H Analysis)My model signals an upside move toward $96.8K on the 1H chart.
For free Bitcoin alerts and accurate price updates, hit Follow.

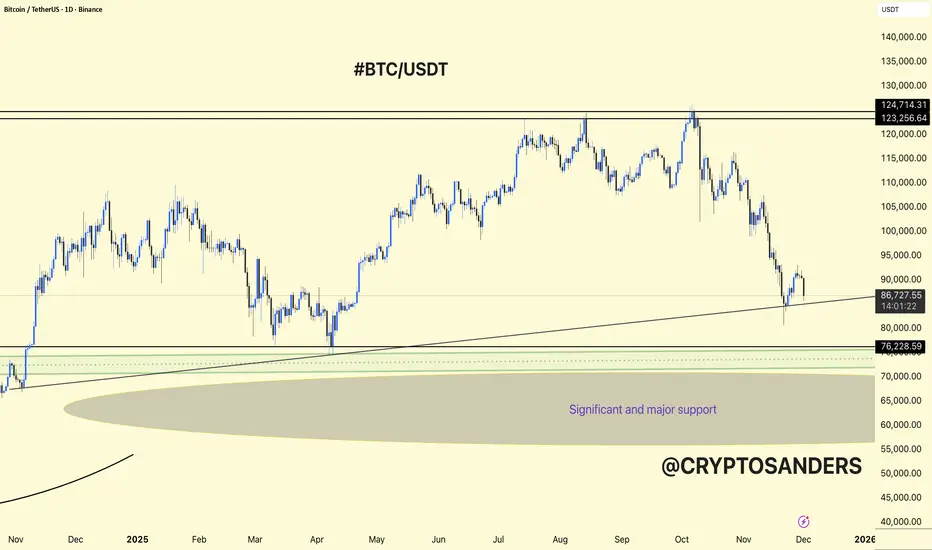
BTC/USDT 1DAY CHART UPDATE. BTCUSDT is in a corrective phase on the 1D chart, but it is still sitting above a major higher-timeframe support zone.
The chart shows a long-term ascending trendline from late 2024 to early 2025 that currently intersects just below the price, acting as dynamic support together with the horizontal 80k–82k area.
Below that, the wider “significant and major support” region lies roughly between 70k and 65k, which is the last strong demand block if 80k breaks.
Bullish case: Holding above the trendline and 80k–82k could form a higher low; from there BTCUSDT can attempt a recovery toward 95k–100k and eventually back to the 120k+ resistance, but it needs clear higher highs and higher lows on the daily to confirm.
Bearish case: A clean daily close below the trendline and 80k support opens room for a deeper flush into the 70k–65k major support zone, where a larger accumulation base may form before any new up‑leg.
DYOR | NFA
BITCOIN MAPPING FOR BEAR MARKETIn this video I will try to map the potential for Bitcoin if we consider the current condition is bear market

Bitcoin predictionmy thoughts on Bitcoin, im on the fence about where price is heading to but I wouldnt be surprised if its heads lower.

BTC Adam & Eve PatternLooks like on the 12 hour BTC has an Adam & Eve pattern. The height of the arch is the potential downside. So if it plays out, it looks like 74k is possible.

Bitcoin Eyes Technical Pullback Before Next Upward MoveHello everyone,
Bitcoin is pausing after a rebound from the 86,000 USD area, but upward momentum faces resistance around 92,000 USD—where a red FVG, old supply zones, and heavy volume converge. Every approach to this area triggers downward pressure, producing red candles near supply zones, showing that selling pressure remains significant.
Nonetheless, the macro backdrop supports buyers: a weaker USD, declining US bond yields, and expectations of Fed rate cuts in 2025–2026 help Bitcoin hold higher levels. ETF inflows are returning, institutions are buying on dips, while the broader market remains neutral without FOMO.
Technically, lower FVGs at 89,500–90,000, 88,000–88,500, and 86,500–87,000 USD provide reasonable retracement areas before the next breakout. The structure has yet to form a new high, upward momentum is weak, and selling pressure has slightly recovered; this technical correction is an opportunity for the market to gather liquidity.
Forecast: BTC may retrace to 89,500 USD, and if selling remains strong, it could test 88,000–88,500 USD. Subsequently, buying pressure should return, pushing BTC back toward the 92,000–93,000 USD resistance, continuing the long-term uptrend.

BTC: Continue to Wait for an UptrendWe have been continuously signaling to go long on BTC, and all long orders placed below the 90K level have now started to generate profits. Next, we will continue to wait for a breakthrough above the 96K level to capture more profits.
I send out accurate signals every day to help you gain more profits. Don’t miss out!

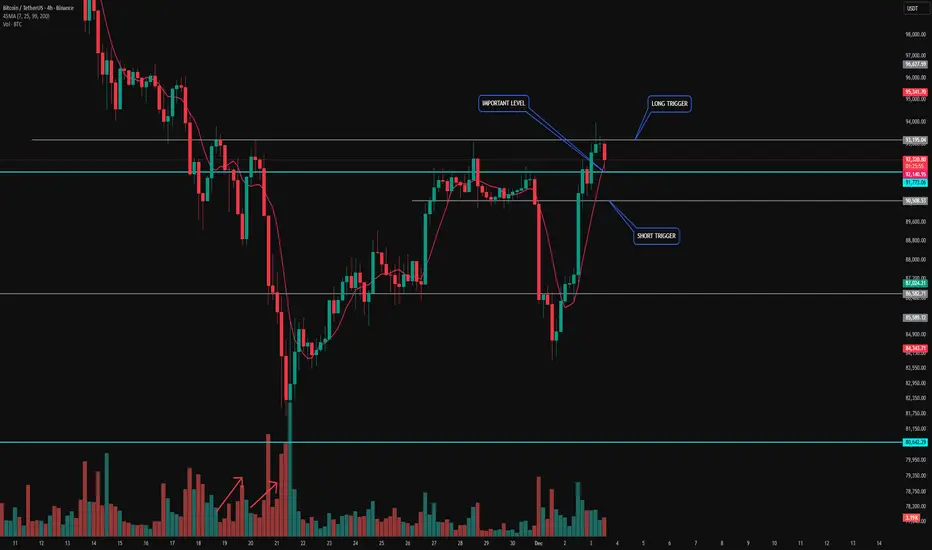
Bitcoin Analysis | Key Decision-Making Moments!
Hello to all my dear traders! Hope you're doing great.
Let’s jump into our beloved Bitcoin!
Before anything else, I really hope you pay attention to the points I repeat in almost all of my analyses:
Risk management and daily monitoring are the keys to winning.
Don’t ignore Bitcoin Dominance.
Write down your trades and review them.
Trade in the direction of the trend. And if the market—like now—doesn’t have a clear trend, taking too many trades doesn’t make much sense. If you do trade, keep the risk low.
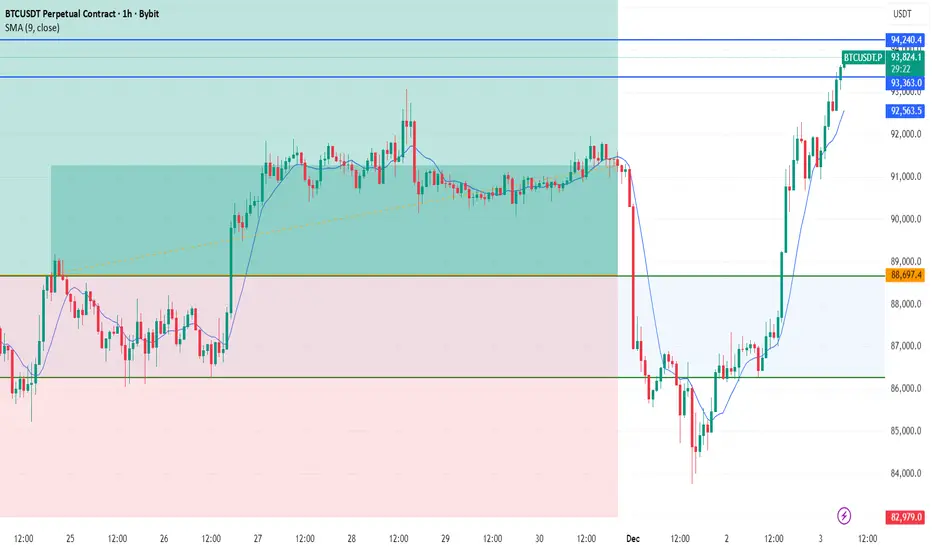
Bullish Scenario »
As expected, we got a reaction from the top zone on the 1H timeframe. I mentioned you could open a position based on BTC dominance—for example, if you had taken BCHUSDT, you could have already hit a 2R setup.
But what’s the situation now?
The market has built a nice structure, and we’re just waiting for a long trigger.
📌 My long trigger:
A breakout above 93,195.
If you see rising volume, you can even take the trigger earlier.
📌 What does rising volume mean?
I look for step-by-step / ladder-type volume increases. I’ve shown an example of this structure on the chart—if you see something similar, a long position becomes logical.
After the break of 93,195, I personally will be looking for longs—but I will definitely secure partial profits along the way.
Range Scenario »
If the price falls back below 91,733, the market likely wants to form a multi-week range between roughly 95,000 (top) and 80,000 (bottom).
If that happens, I’ll tell you the timeframe where you can open positions with a tight stop-loss and fast take-profits.
For now, we should NOT see a 4H candle closing below 91,733, because in my opinion that would kill the current momentum.
Bearish Scenario »
Very simple:
📌 90,500 is the short trigger.
Just pay attention to Bitcoin Dominance, and place your stop-loss above the 15-minute structure high.
Make sure you secure profits quickly.
If we get one more strong drop, it confirms that we’re likely entering a weekly range, which will help avoid high-risk situations.
Final Words »
As I told you in previous analyses, this is the first bullish move after a sharp drop, so watch the buyers carefully.
Wherever they show weakness, we can take positions against them, but only with confirmation—and our confirmations are automatically provided once our triggers activate.
Stay safe, stay healthy, and trade smart.
Wish you all the success! 🚀💚
#BTC Retests Resistance Zone📊#BTC Retests Resistance Zone⚠️
🧠As expected, the market found support near the short-term support level of 85358 and rebounded well. Currently, the price has retested the blue resistance zone. We should be wary of a potential pullback, so chasing the price higher here is not recommended. Instead, look for opportunities to short.
⚠️Note that if we successfully break through the blue resistance zone, we need to be cautious of a further surge.
🤜If you like my analysis, please like 💖 and share 💬
BITGET:BTCUSDT.P

Back in the stress test area againLooking at the 4-hour chart, the liquidity trend is still too strong. Let’s see if it can stay above 93,200 for the next 3 hours. If it holds, we can buy without hesitation. If not, we’ll sell.

BTCUSDTWe have a big downtrend.
By breakout from support and resistance we will have continued trend to next target.
Breakout 82k ready to 70k.
Breakout 93k ready to 100k and 115k.
CRYPTOCAP:BTC BITSTAMP:BTCUSD BINANCE:BTCUSDT

Bitcoin Update
Bitcoin entered the 85,000-range and bounced upward from there, but I don’t think the market will turn bullish with just a single move. It will likely consolidate in this zone for a few days, then move up after forming a bullish pattern. Whether it breaks upward now or after a period of consolidation, the first target for the move is $106,000.

BitcoinBitcoin has surpassed the $87,500 mark and has also broken through the key level of $90,000. As noted, the Inverse Head and Shoulders (IH&S) pattern has acted as a reversal signal. The market currently appears strong, as the price increase is supported by healthy trading volume. The next significant resistance level to watch for is $95,000, and it will be interesting to see how the price behaves at that point.