$BTC: Price Action Saved Us! The only reason i told you not to top-buy was this. Yes, news was bullish 25 bps rate cut, but even then crypto market showed clear manipulation.
Real question is: how did we stay safe? And how did i know that top buying was risky?
Answer is very simple price action warned us trend was bearish and entire crypto market was sitting in a supply zone. Until trend shifts bullish, staying out is always the safer option. “Charts don’t lie” 💯
Alhamdulillah based on this, I gave you all an early alert so you wouldn’t top buy and end up selling low.
Trade ideas

BTCUSDT SHORT📌 BTCUSD — Institutional Daily Analysis (MPI + ICT Framework)
(Professional Smart Money Market Breakdown)
1️⃣ Higher Timeframe Context
Bitcoin is currently trading inside a bearish dealing range:
Range High: 107,448 (Buy-side liquidity)
Range Low: 80,600 (Sell-side liquidity)
Within this range, price is in a retracement phase, not a reversal.
2️⃣ Market Structure (HH → LH → LL → MSS)
The structure confirms a bearish environment:
HH → LH → LL = bearish sequence
Liquidity sweep below
Internal swing high taken → MSS (Market Structure Shift)
This MSS indicates the start of retracement — not a trend reversal.
3️⃣ Internal Liquidity (94k–96k)
Price cleaned internal liquidity inside the 94k–96k range and confirmed
the internal dealing model (IDM).
This created the engine for a move into premium.
4️⃣ Premium Retracement Targets (FVG + OTE)
Institutional order flow suggests price will seek higher inefficiencies:
0.618 retracement: 97,190
0.705 OTE (Institutional Entry): 99,533
Daily FVG #1: 98k–100k
Daily FVG #2: 101k–103k
Possible sweep zone: ~100k
These are liquidity magnets before any major reversal.
5️⃣ Rejection Zone — Institutional Selling Area
A high-probability sell setup sits in the premium zone:
Daily FVG
0.705 OTE
Old support → new resistance
Breaker + inefficiency cluster
This area is the most likely region for a bearish rejection.
6️⃣ Higher Timeframe Draw-on-Liquidity
Once rejection occurs, institutional flow favors lower targets:
TP1: 80,600 (Range Low)
TP2: 76,000 (HTF imbalance)
TP3: 72,300 (Weekly EQ Low – March 2024)
Sell-side liquidity zone: 72k–76k
This zone is the long-term liquidity objective.
7️⃣ Summary
📉 Trend remains bearish
📈 Current move = retracement into premium, not reversal
🎯 Premium zone (98k–103k) = institutional sell area
🔥 Long-term targets: 72k–76k sell-side liquidity
This structure follows the classic ICT + MPI roadmap:
Sweep → MSS → Retracement → Premium → Rejection → Expansion Lower

#BTC Global analysis of BTC. Correction and decline to 65kBYBIT:BTCUSDT
BYBIT:BTCUSDT.P
COINBASE:BTCUSD
Bitcoin is currently in an uncertain phase for everyone, so I have analyzed the most likely outcome of the price movement in my opinion.
On D1, we see a downtrend and a reaction from support levels. As a result, Bitcoin corrected to the 0.5 Fibonacci level, after which it did not reverse the trend but continued to test the 0.5 level.
The trend short line on H8-D1 was broken after several serious touches, and now I am waiting for a retest from the 0.618 Fibonacci level and a further correction to 98500-100000, where the 0.618 and 0.702 Fibonacci levels are also located.
This is a serious resistance level for the price and the place where the structure (BOS) was broken. The price usually returns to this place for further movement along the trend.
I expect this scenario, as I have not noticed that the main cryptocurrency has gathered enough liquidity to update its highs and a global long scenario.
At levels 98500 - 100000, I expect a short scenario to levels 65000 - 75000.
From there, Bitcoin will likely delight us with a long-term outlook and attract a large number of investors.
In addition to this, it is known that a large number of investors hold stablecoins and are ready to buy Bitcoin. Until this happens, we can assume that investors and funds are waiting for a suitable favorable price for the main asset.

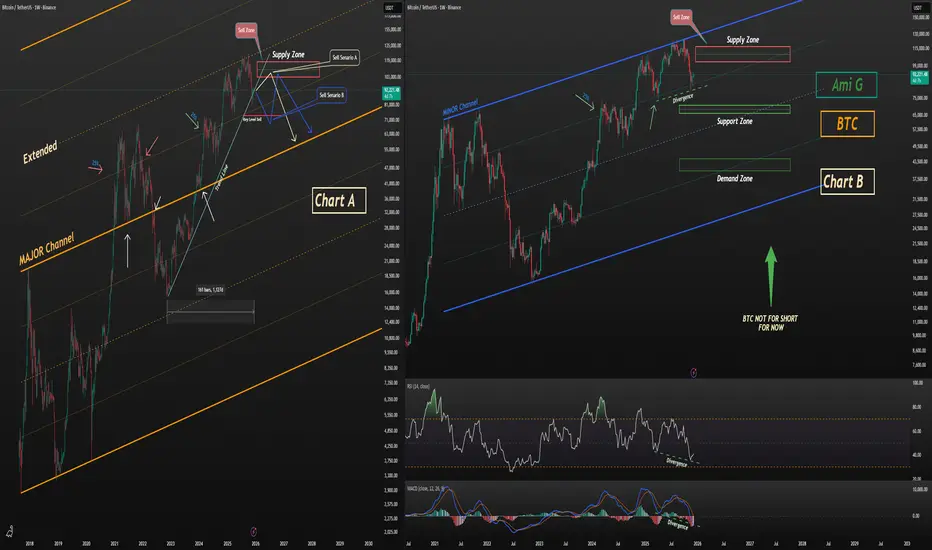
Bitcoin Short Setup – Why It’s Still Early📝 Bitcoin BINANCE:BTCUSDT Short Setup – Why It’s Still Early
At the moment, opening a short position on Bitcoin is premature.
This does not signal a buying opportunity here — it simply highlights that short positions (especially with leverage) carry high risk from this zone.
📊 Chart A – Major Channel Structure
Bitcoin is trading inside a major channel.
After breaking out of this structure and extending beyond it, price has shown clean and consistent reactions to the extended boundaries.
The latest rejection from the upper zone also aligns with the 50% mid-line, further confirming the significance of this major channel.
📊 Chart B – Short-Term Channel
The shorter-term channel also justifies the recent top.
However, shorting from the current zone is still too early, and here’s why:
Price has reached the 25% reaction zone on both charts
This level has repeatedly acted as a sensitive reaction point across multiple timeframes
Bitcoin is sitting on its 160-week trendline
Clear bullish divergence appears on both MACD and RSI
Given these factors, initiating a short here is high-risk and not technically justified yet.
📉 Short Scenarios (Only If Confirmed)
Scenario A — Chart A
Wait for price to revisit the marked supply zone, then short only with a clear trigger.
Scenario B — Chart B
A short becomes valid after breaking the key level, followed by a pullback into the supply zone.
📌 Outlook
My base view: Bitcoin is likely to correct toward the demand zone shown on Chart B.
📣 Final Note
Stay safe, trade smart.
Follow the profile so you don’t miss the daily live swing trades and day-trading setups shared here on TradingView.
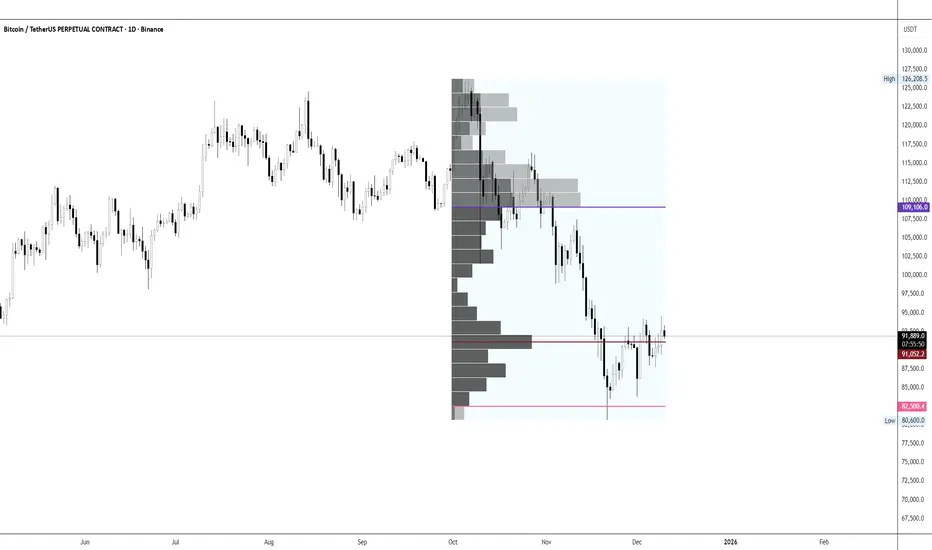
Quarterly BTC Key levels (Q4 BTC)These are key BTC Quarterly levels , invalidation to these levels are good for trading BTC
BTC/USDT Analysis. News-Driven Activity
Hello everyone! CryptoRobotics trader-analyst here, and this is the daily market analysis.
Yesterday, Bitcoin surged and reached our resistance zone at $94,000–$97,500 (volume area) after the release of positive U.S. labor market data.
At the moment, we are observing signs of buyer weakness: recent local highs are updated without momentum, and after testing the local support at $92,000 (pushing volume), the buyer is not showing initiative. Delta imbalance has shifted back toward sellers.
A key area to watch is around ~$93,500, where the highest concentration of absorbed spot-buying volume is located. If the price tests this level and reacts, we consider short positions targeting the 87,800–86,400 support.
An additional scenario is a repeated fake breakout of the local high. In this case, the downside potential remains the same.
Alternative scenario: a confident breakout of the current high. If this happens, the trading priority shifts fully to longs, and we will look for long setups on a retest, with targets above $100,000.
Buy Zones
• 87,800–86,400 (volume zone)
• $84,000–$82,000 (volume anomalies)
Sell Zones
• $94,000–$97,500 (volume zone)
• $101,000–$104,000 (accumulated volume)
• $105,800–$106,600 (local resistance)
This publication is not financial advice.

BITCOIN SELLING CONFIRM📉 Sell Trade Summary
Pair: BTC/USDT
Direction: Sell (Short)
Reason: Price swept the Buy-Side Liquidity Range, rejected from supply, and broke structure bearish.
Entry: Retest of the supply zone around $93.2K–$93.4K
Stop-Loss: Above liquidity sweep at $94.6K
Take-Profit: Demand zone at $89.5K–$90K
R:R: Approximately 1:3+
Bias: Bearish continuation toward lower demand.

BTC — My Plan: I am in the same position as in the previous reviBased on my previous idea, I am in a position with lower entry points. You can check my profile. I have already addressed part of it.
I expect something similar from BTC going forward. However, I do not rule out swings in different directions before the Fed. This is not financial advice, just my vision. Especially since I am in a position with lower entry points!

EcoByG Bitcoin Daily Analysis #7 — Daily BTC Market UpdateWelcome to My Analysis.
Now, let’s break down today’s Bitcoin structure.
Bitcoin is currently forming a range structure with a slight bullish bias.
After a strong upside spike, price has entered a compression phase, where candles are getting smaller and volume is dropping as the market “digests” the move.
The alignment of the moving averages shows that the market is slowly shifting out of indecision and leaning toward a mild bullish tendency.
Right now, price is trading exactly on the Equilibrium Zone following the major impulse move.
After being rejected from the 94K ceiling, Bitcoin is now testing whether it can break away from equilibrium and form a second bullish leg — or not.
Buyers vs. Sellers
Buyers
After the big upward spike, buying volume was clearly dominant in the bullish candles.
We still see soft defense around the 92,000 level.
Price holding above all three moving averages → buyers maintain light control.
Sellers
Strong selling pressure appeared at 93,200 – 93,700.
Upper wicks show sellers are preventing an easy breakout above this zone.
Overall: the market is balanced but slightly tilted toward buyers.
RSI
RSI is currently neither overbought nor oversold.
This means:
The market hasn’t chosen a clear direction yet.
The momentum from the previous bullish spike hasn’t fully faded.
But there isn’t enough energy for a strong breakout either.
In simple terms:
RSI says the market is in “waiting mode.”
Final Conclusion
The market is currently in:
“Range with Bullish Bias”
Bullish scenario
If Bitcoin stays above 92,000 → Next targets: 93,700, and if that breaks → 94,580.
Bearish scenario
If the 92,000 support breaks → Correction toward 91,450 is likely.
Breaking that → a deeper move back toward the heavy zone 89,800 – 88,700.
Dominant Scenario
A second bullish wave is possible if price stabilizes above 92,000, but the market has not yet gathered enough energy to break major resistances.
⚠️ Important Note:
The Federal Reserve has a meeting today and will announce the interest rate decision.
Trade cautiously — volatility may increase.
⚠️ Risk Alert ⚠️
Futures are not beginner-friendly. These triggers require solid experience.
Before using them, study risk management and practice with the learning content here.
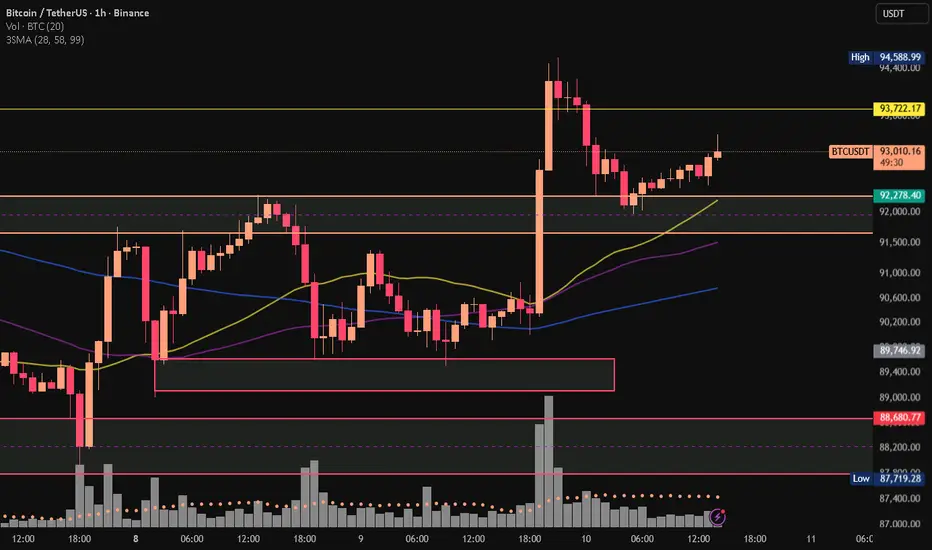
#BTCUSDT.P 3H ChartPrice recently broke above the previous high as expected however it failed to tap into our POI beforehand. It also got rejected off the S/R Flip at $94k and it is currently ranging in an ascending triangle. We will be removing our limits and wait for the breakout for further confirmation before entering any new setup on #BTC.

BTC-USDTBitcoin, after breaking $90,000, as I mentioned in the last analysis 📊🕯, has taken a good trend and even rose to $94,200 🪙
Currently, Bitcoin's supports are at $92,000 and then $90,000 🔽🪙
For Bitcoin to rise again, it needs to break the $94,000 resistance, in which case it can rise to $95,800 without any problem 🔼✔️


Brainiak | Bitcoin in ConsolidationAfter projecting a move toward the 94,000 level, the market has now reached that target. The only concern is the sharp rejection that occurred immediately after the test. This kind of reaction suggests a high probability that the market may not be ready to break upward yet.
Here are the major zones, ranked by likelihood, based on how deep the pullback goes and how that affects the chance of continuation:
The strongest continuation zone is above 89,000. If the pullback stays within this area and shows a clear reversal signal .. without forming a fast, aggressive V-shape drop .. then the probability of a bullish continuation remains high. The decline should be relatively slow and controlled for this zone to hold.
The next area is around 86,000. This is still workable, but price action will likely begin forming more sideways structure, meaning the market may dip first before attempting another push upward.
The least likely bullish zone is around 84,000. If price tests this zone, fails to hold, and breaks below it, then the market would need to move lower before any meaningful bullish structure can form again.
For now, the only thing left is to wait for price to retest 94,000 .. and ideally break above it. The next move hinges on that retest.

$BTC Critical Phase Update! CRYPTOCAP:BTC got rejected from marked supply, and I’m staying flat for now. Until red box breaks, CRYPTOCAP:BTC is in a critical phase.
Remember: breaking red box doesn’t mean we go straight to ATH. It just means 4H trend turns bullish, and we might see some upside move.
“So don’t assume breakout = ATH”

BTC long ideadespite all the choppiness and seemingly radical moves, I believe bitcoin is still on course towards 98000.

Bitcoin 09.12.2025The price has spent a period moving between VAL → POC → VAH.
We can now see that it is successfully tapping into the upper zone of the VAH.
If buyers continue to show interest in this upper area, we may witness some notable reactions and potential shifts in market behavior.

BTCUSDT Trade Plan (December 08, 2025)BTC Trade Plan (December 08, 2025)
(D1 Bearish / H4 Sell Rallies → Compression / H1 Neutral / M15 Chop)
⬛️ 1. Higher Timeframe Context (D1 and H4)
• D1 bias: bearish (descending channel post-ATH)
• D1 range (approx): 84,000 – 126,000 (current lower third)
• Key D1 zones:
• Supply: 100–105k (broken)
• Demand: 88–90k channel low
• H4 bias: sell rallies turning compression (ascending triangle forming)
• H4 zones of interest:
• H4 Sell Zone 1: – recent rejection + supply cluster
• H4 Buy Zone 1: – weekend low + trendline
Active setups counter-trend long on dip (whale accumulation support), trend-aligned short only on clear rejection.
⬛️ 2. Preferred Setups by Horizon
🔳 2.1 Swing Setup (D1/H4)
Counter-trend long the channel low / whale accumulation zone. Time horizon: multi-day to weeks.
🔲 2.2 Intraday Setup (H1 focus)
Buy dips to 89.5-90k or breakout above 92k. Time horizon: intraday to overnight.
▫️ 2.3 Scalp Setup (M15 focus)
Scalp range 90-92k or absorption plays — higher risk in chop.
▪️ 2.4 Arbitrage/Pairs: BTC dominance rising → BTC outperforming alts short-term.
🟩 3.1 Long Setup (Trend-Aligned with On-Chain / Swing-Intraday)
• Execution timeframe: H4/H1
• Trigger timeframe: M15
• Entry zone:
• Pattern tags: Trigger conditions:
• Successful defense 88-90k zone + CVD higher low
• H1/H4 BOS up on volume
• Whale accumulation continuation
🟥 3.2 Short Setup (Counter-Trend / Scalp Only)
• Execution timeframe: H1
• Trigger timeframe: M15
• Entry zone:
• Pattern tags: Trigger conditions:
• Clear rejection with delta divergence high
• Failure to break 94k pre-FOMC
🔴 4. Stops (Invalidation Levels)
Long setups: 87,500 (channel break = bear confirmation)
Short setups: 94,500 (breakout = squeeze)
🟢 5. Targets
Long (swing/intraday):
• TP1: 92,000 (VWAP/H1)
• TP2: 94,000-95,000 (supply test/H4)
• TP3: 100,000+ (HVN/D1 optional)
Short (scalp):
• TP1: 90,000
• TP2: 88,500
⬛️ 6. Position Sizing
• Baseline trend-aligned long (on-chain supported): 1.0%
• Counter-trend short: 0.4%
• Adjustments: +20% (whale buying + clean lev + Fed tailwind) → Effective: longs 1.2% risk, shorts 0.3% max
⬛️ 7. Risk Flags
• FOMC Wednesday → vol expansion risk
• Thin liquidity mid-week
• Residual weekend trauma → fake moves possible
• Macro correlation re-assertion if equities dump
⬛️ 8. Flip Conditions
Bull → bear flip: clean close below 88k with volume + funding negative
Bear → bull flip: H4 close >94.5k + CVD reset + whale continuation
⬛️ 9. Alternative Scenario
Reject hard at 92-94k → descending triangle breakdown → fast move to 84-87k LVN void (bear trap completion, high risk short only with tight stop).
⬛️ 10. Model Self-Critique
• Assumptions: whale accumulation continues, Fed delivers dovish cut, no macro shock
• Vulnerabilities: sudden risk-off equities dump, whale distribution resumption, FOMC hawkish surprise
• Behavioural: do not chase breakouts pre-FOMC, do not average into losing shorts against whales
⬛️ 11. Uncertainty and Constraints
Uncertainty: medium → require flow + pattern confirmation, no high lev, prefer size on confirmed absorption only.

BTC/USDT Analysis. Uncertainty, but Long Bias Remains
Hello everyone! CryptoRobotics trader-analyst here, and this is your daily market update.
Yesterday, Bitcoin failed to show a clear directional bias and continued trading within a narrow range, accumulating volume. Pressure on the cumulative delta remains on the sellers’ side, especially on spot markets, which adds uncertainty to the current structure.
Despite this, the overall long bias remains intact: the broader structure has not been broken, and the probability of upward continuation after a local liquidity sweep is still high. However, Bitcoin may first retest the $87,800–$86,400 (volume zone) before forming a new bullish impulse.
During this phase of consolidation, it is more prudent to stay out of the market and wait for a clearer setup — either a reaction from key support or a breakout through resistance. This will provide a much cleaner risk profile for new long positions.
Buy Zones
$87,800–$86,400 (volume zone)
$84,000–$82,000 (volume anomalies)
Sell Zones
$94,000–$97,500 (volume zone)
$101,000–$104,000 (accumulated volumes)
$105,800–$106,600 (local resistance)
This publication is not financial advice.

BTC/USDT | Consolidation and fall (READ THE CAPTION!)By examining the 4H chart of BTCUSDT, we can see that BTC is struggling to make a move and is consolidating over the IFVG. If it fails to make a move, a fall to the Demand Zone at 86,600 is possible. However, if it manages to go up, it'll face the FVG at 94,500 level, which then determines whether BTC can make an upwards move or falls again.

Wyckoff Distribution. Long term liquidity levels reached.Liquidity we have been tracking for months from orderbook instability in our lower time frame threshold tracker has just been absorbed, see horizontal boxes on screen. I believe we are happy here, waiting for fed…

Bitcoin Price Prediction: Recovery To $100,000 Could Be Tainted Bitcoin’s price is at $90,399 at the time of writing, sitting just below a downtrend that has persisted for one and a half months. BTC is attempting to flip $90,400 into a support level, which would mark the first step toward reversing the trend.
If macro conditions align and rate cuts revive broader market optimism, BTC could rebound sharply. A clean bounce from $90,400 may drive a retest of $95,000, and breaking that resistance would open a clear path toward the long-anticipated $100,000 level.
However, if short-term holders sell into strength, Bitcoin may struggle to maintain upward pressure. A rejection from $95,000 or failure to break the downtrend could send BTC back toward $86,822, invalidating the bullish scenario.

EcoByG Bitcoin Daily Analysis #6 — Daily BTC Market UpdateWelcome to My Analysis.
Now, let’s break down today’s Bitcoin structure.
Bitcoin attempted once again to break through the liquidity zone at 91,800–92,300, but since buyers showed no demand in that area, price was rejected again and returned back into the equilibrium zone.
Here, the moving averages have tangled back together, showing indecision.
The moving average values are:
28, 58, and 99.
The RSI shows that there is still no meaningful momentum entering the market — meaning Bitcoin hasn’t picked a direction yet.
This suggests the market needs more time before participants decide whether to put serious money in or not.
Most traders prefer to stay patient for now.
For short setups, the earliest possible level is around 89,000,
but for long setups, we still don’t have proper confirmation above 92,300.
Taking a long here would be unsafe and risky, and it’s better to give the market more time.
Trading volume is still balanced between buyers and sellers, which means the market remains in equilibrium.
⚠️ Risk Alert ⚠️
Futures are not beginner-friendly. These triggers require solid experience.
Before using them, study risk management and practice with the learning content here.

BTCUSDT: Update On Todays Market.BTCUSDT continues to scale slowly upward after dropping down to $80,534. the pair is moving on a momentum of higher highs and lows. presently the price is heading down towards the next low, in respect of the structure. the best alternative at this point is buying at lows and selling at highs
Possible outline;
A confirmed reversion above $84,071. would trigger a buy position, eyeing $96,146 as target.
Lets see how it plays out.
keep it simple, keep it trading.
Thanks for reading.
