BTCUSDTHello Traders! 👋
What are your thoughts on BITCOIN?
Bitcoin has recently broken above its all-time high and printed a new record high, signaling strong bullish momentum. Currently, the market has entered a consolidation phase, which is typical after such a major breakout.
A pullback toward the previous breakout level (the old all-time high) is expected, which now acts as new support.
After this consolidation and pullback, the price could resume its bullish trajectory and move toward higher targets, including the upper boundary of the current bullish channel.
As long as the price remains above the key support zone, the overall trend remains bullish and any dip could be seen as a buying opportunity within the broader uptrend.
Will this consolidation lead to the next leg up, or is a deeper correction ahead? Share your thoughts below! 🤔👇
Don’t forget to like and share your thoughts in the comments! ❤️
BTCUSDT.3S trade ideas
Breakout vs Fakeout: How to Spot the DifferenceHello, Traders! 🖖🏻
There’s probably no phrase that triggers more mixed emotions in crypto trading than: “Looks like we’re breaking out!”. Because let’s be honest…For every clean breakout that follows through with momentum…
…there’s a fakeout waiting to trap overconfident entries.
So, how do you tell the difference? Let’s break it down!
🧱 What Is a Breakout?
A breakout occurs when the price moves decisively beyond a key level, such as support, resistance, a trendline, or a range boundary, and holds.
What makes it a REAL breakout?
Volume Expansion: More participants step in as the price moves through the level.
Strong Candle Closes: Especially on higher timeframes like 4H or 1D.
Follow-Through: The market doesn’t just poke above the level. It builds on it.
No Immediate Rejection: You don’t see a sharp wick straight back below.
Example from BTC (2021):
Look back at January to February 2021. BTC had been stuck under the $42K–$43K resistance for weeks. Every push got sold off, until it didn’t.
When the breakout finally came, it was clean. The massive daily candle closed right through the level. Volume exploded. And there wasn’t even a polite little retest, price just launched straight toward $58K, leaving anyone waiting for a pullback completely behind.
Pure trend breakout energy. Everything lined up: the context, the volume, the structure — textbook 🤌🏻
🪤 What Is a Fakeout?
A fakeout, on the other hand, looks like a breakout… until it isn’t. The price briefly moves beyond a key level, but then snaps back inside the range, often trapping late buyers (or sellers) and triggering stop-losses.
Common Signs of a FAKEOUT:
Low or Declining Volume (at the breakout moment).
Quick Rejection with a Long Wick (especially on intraday charts).
Failure to Hold Above the Level on Retest.
Divergence Between Timeframes: For example, a 15M breakout that looks strong while the 4H still shows consolidation.
Classic BTC example:
This one was sneaky! After BTC hit its all-time high around $65K, the market started looking shaky. Price tried to recover by pushing back into the $58K–$60K zone, a pretty critical level at the time. It looked like a breakout attempt… but something was off. No real volume. No strong candle closes. And then, BOOM, hard rejection. The price popped just enough above resistance to lure in breakout traders (and probably clear out some stop-losses)… then completely reversed. And not just a minor pullback, this fakeout basically triggered the entire leg down toward $30K. Classic liquidity grab. The kind of move that looks like strength for a second… until it absolutely isn’t.
🕵️♂️ Key Differences: Breakout vs Fakeout (Checklist)
🧠 What Causes Fakeouts in Crypto?
Honestly, fakeouts aren’t some kind of accident. They’re almost baked into how crypto markets work.
Part of it comes down to simple liquidity hunting. The market knows exactly where traders tend to place their stop losses, right above resistance or just below support. Price often spikes into those zones, triggers stops, fills larger orders for bigger players… and then reverses completely.
Another reason? A lack of real conviction. Sometimes, it’s mostly retail traders chasing a move. Price pokes above a key level, but there just isn’t enough momentum to sustain it. Without bigger buyers or sellers stepping in, the move collapses right back.
And let’s be honest. When everyone on Crypto Twitter is watching the exact same level, fakeouts become almost inevitable. The more obvious the setup, the more likely it gets front-run, faded, or manipulated.
Plus, a huge mistake? People ignore the higher timeframe context. A breakout on the 15-minute chart might feel exciting… but if the 1D or 4H is still clearly in a downtrend, that breakout is fighting against the bigger picture. No surprise it fails. Fakeouts happen because the market’s job is to make most people wrong, at least for a moment.
🧭 Final Thought
Breakouts and fakeouts are part of the same game: they involve both liquidity and psychology. The market rewards patience, context, and waiting for confirmation. Sometimes, missing the first candle can save you from being a liability to someone else. So, next time an asset “breaks out,” take a second look. Is it really moving with force? Or is it just another trap waiting to be sprung?
What’s the last fakeout that caught you off guard? Drop your story in the comments. Let’s compare lessons learned!

Delayed Cycle Kicks Off This March? (Chart)🚀📈 Delayed Cycle Kicks Off This March? 🔥💡
March has (almost) arrived, and Bitcoin has officially confirmed $79,478 as major structural support—a critical level that had to be checked before the next move. This aligns perfectly with my previous idea of a delayed cycle playing out.
📌 Long above 79K
📌 Short below 79K
📌 Short-term target: GETTEX:87K+
With this structural support holding, I expect Bitcoin to push toward the next major test: $113,800. This is the all-time trendline, a level of historical significance.
🔑 What happens at 113K?
This is where Bitcoin’s fate for this cycle will be decided:
✅ A breakout above 113K could unlock a run to 150K - 200K, a true extension of this cycle.
❌ A terminal rejection at 113K could mark the end of this cycle, signaling a broader correction phase.
At the moment, the probabilities lean toward further upside, with an 80% chance of continuation. The 20% downside risk remains for a dip to FWB:65K-66K, but as long as Bitcoin stays above 79K, the bullish thesis remains intact.
💡 March looks strong, and I’m stepping on the gas today.
Let’s make it a powerful month! 🚀
One Love,
The FXPROFESSOR 💙
video:

BTC AI Prediction Dashboard - 6h Price Path
BTCUSDT Forecast:
Crypticorn AI Prediction Dashboard Projects 6h Price Path (Forward-Only)
Forecast timestamp: ~13:45 UTC
Timeframe: 15m
Prediction horizon: 6 hours
Model output:
Central estimate (blue line): ~118,370
40% confidence band (light blue): 117,719 – 118,563
80% confidence band (dark blue): 117,040 – 119,652
Volume on signal bar: 331.4
Observations:
Price currently near central estimate, within 40% band
Continuation likely as long as price remains within 80% band
Moves outside 80% = low-probability fade or potential breakout
Model does not repaint. Forecast is fixed once published.

BTC/USDT : Breaks Out – New Highs In Sight After Smashing $111K!By analyzing the Bitcoin (BTC) chart on the weekly timeframe, we can see that the price has finally started to rally as expected—successfully hitting the $111,700 target and even printing a new high at $111,999 with an impressive pump.
This analysis remains valid, and we should expect new all-time highs soon.
The next bullish targets are $124,000 and $131,800.
THE WEEKLY TF ANALYSIS :

Bitcoin's Consolidation Almost Over —200-220 DaysBitcoin's consolidation period before a bullish breakout tends to last some 200-220 days on average. We have four instances of this pattern since the 2022 bear market counting 2025. Let's look at those. This proves that Bitcoin is set to grow in a matter of days. Continue reading below and make sure to boost. When you reach the end of the article leave a comment with your opinion about this issue. Do you agree? Do you disagree? Can you see what I mean?
» Back in 2022 Bitcoin consolidated for 203 days before a bullish breakout.
» Back in 2023 Bitcoin consolidated for 203 days before a bullish breakout.
» Back in 2024, last year, Bitcoin consolidated for 217 days before a bullish breakout.
It really depends on where you start counting for the total days but it all adds up to 200-220 days. With 220 being the maximum.
» Currently, in 2025, Bitcoin has been consolidating for 210 days. Looking at previous patterns, this means that only a few days are left before Bitcoin produces a bullish continuation.
We also saw that once Bitcoin breaks out of a this long-term consolidation range/period/phase, it never moves back to the lows of the consolidation range. That is, Bitcoin will never trade below 80K nor 90K once it resumes growing.
I am estimating that the next jump can start as early as next week. The entire move can take months to develop. After a peak is reached, Bitcoin will then start a new consolidation phase with a bearish bias first. This bearish bias produces a low after several months yet a strong higher low compared to the previous consolidation period which is current prices. After this low, more consolidation and then a new bullish jump.
If we take into consideration a bear market, then the dynamics can be different. Bear markets only happen once every four years. Seeing how different market conditions are now, the next bear market will be interesting because it won't be anything like the bear markets of the past. Bitcoin will remain much stronger but that is an analysis for another time.
Summary
Bitcoin is going up. It is very close now. When Bitcoin breaks up and hits a new all-time high, just to continue growing, the altcoins market will explode. You've been warned.
Now you can leave your comment.
Share your opinion on the comments section below. I know you have something to say. You've been trading Cryptocurrencies for years, buying and selling, making profits so... Are you ready for the 2025 bull market?
Thank you for reading.
Namaste.

TradeCityPro | Bitcoin Daily Analysis #122👋 Welcome to TradeCity Pro!
Let’s dive into the latest analysis of Bitcoin and major crypto indicators. As usual, this update will focus on potential triggers for the New York futures session.
⌛️ 1-Hour Timeframe
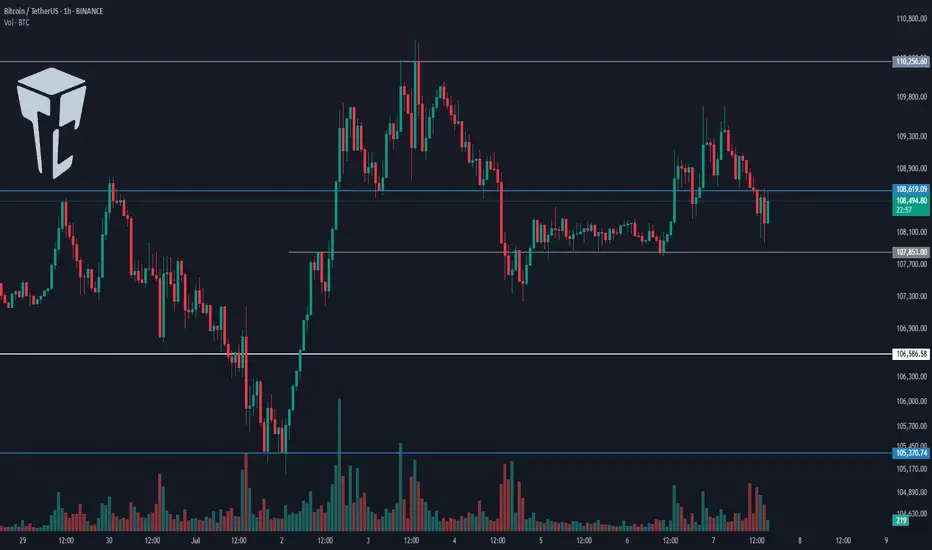
On the 1-hour chart, Bitcoin is once again ranging between the 107,853 and 108,619 levels.
✔️ Last night, Bitcoin briefly faked out below the bottom of this range, so we now need to wait and see how the price reacts upon revisiting this area.
💫 I believe it’s best to hold off on entering a short position until we identify the precise location of the support line. As price retests this area, we can pinpoint the true support level.
✨ Once that level is confirmed, and if it breaks, a short position could be considered. The next support zones would be at 106,586 and 105,370.
📊 Make sure to watch the volume closely for this trade, and I strongly recommend waiting for a volume confirmation before entering.
📈 As for a long position, if 108,619 breaks to the upside, we could consider going long. The buying volume in the current upward leg is increasing, and if this trend continues, a breakout above 108,619 would make a long position reasonable.
👑 BTC.D Analysis
Moving on to Bitcoin dominance — it has once again reached its trendline and is currently being rejected from it. If this rejection continues, BTC.D could decline toward 65.04.
🔍 However, if the trendline breaks, the 65.31 level will be the bullish confirmation trigger.
📅 Total2 Analysis
Now on to the Total2 index (altcoin market cap excluding BTC), it has bounced from the 1.14 support and is moving toward 1.16.
🔑 A breakout above 1.16 would serve as a bullish confirmation for long positions, with 1.17 acting as the main breakout trigger.
📅 USDT.D Analysis
USDT dominance is also moving downward and has reached the 4.78 support zone.
💥 A breakdown below this level would confirm a bearish continuation toward the 4.72 level..
❌ Disclaimer ❌
Trading futures is highly risky and dangerous. If you're not an expert, these triggers may not be suitable for you. You should first learn risk and capital management. You can also use the educational content from this channel.
Finally, these triggers reflect my personal opinions on price action, and the market may move completely against this analysis. So, do your own research before opening any position.

Macro view of BTC - why is nobody talking about this?Looking at the weekly BTC chart, there’s a clear long-term resistance that dates back to 2017 and still hasn’t been broken convincingly. There’s plenty of talk this cycle about Bitcoin hitting 150k, just like there was hype around 100k in 2021.
In 2021, BTC formed a significant resistance, which was retested and confirmed in late 2024 and early 2025. Now the common line is: “This time is different. We have institutional money.” That’s true to an extent, but market psychology doesn’t change. Profit is profit. And when sentiment turns, even institutional and ETF-driven retail investors will take it.
BTC is still considered a speculative asset, and for good reason. It doesn’t generate income or yield — it’s only worth what someone else will pay for it.
Right now, BTC appears to be forming a bull flag, but if it can’t push past the 116k to 120k range with strength, I’ll be looking to short it on the way down.
If we get a strong breakout and hold above 120k, then, and only then, do I see a path toward a 150k top.

Bitcoin Expecting Bullish FormationBitcoin could be triggered by negative news from the U.S. regarding tariffs, which may create market uncertainty and push investors toward risk-off or alternative assets like crypto.
Currently, Bitcoin is reacting to the decline caused by fundamental negative data, but bullish sentiment remains alive as buyers attempt to hold key support zones. The focus now shifts to the psychological resistance near 110K
You may find more details in the chart.
Ps support with like and comments for more better analysis.
BTC in a Bearish movementIt appears that BTC has already completed the C leg of a 60-minute harmonic pattern near 109680
BTC is forming a larger corrective pattern rather than taking a true direction, thus increasing the chances of completing this pattern before moving up again.
Currently, the price is positioned to complete the D leg of the pattern near 105700
I am looking for short-term targets near 107240; 106275 and 105715

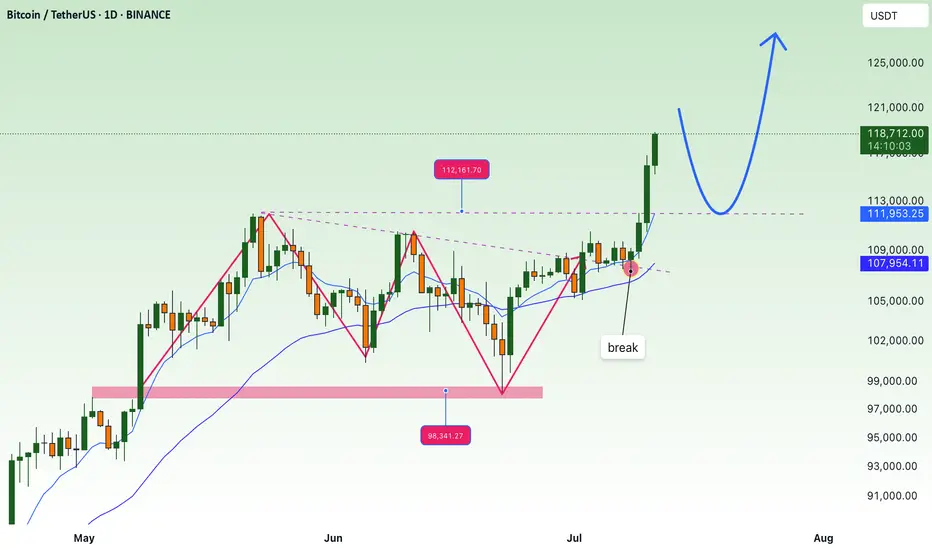
TradeCityPro | Bitcoin Daily Analysis #125👋 Welcome to TradeCity Pro!
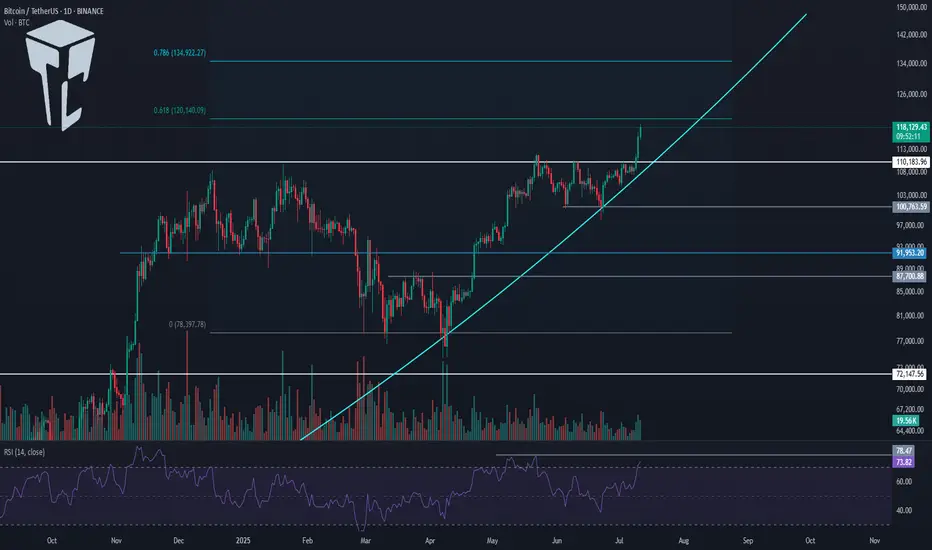
In this Bitcoin analysis, I want to switch to a higher timeframe and analyze the daily chart because a very significant resistance has been broken and it’s important to take a closer look.
📅 Daily Timeframe
On the daily chart, as you can see, a bullish trend started around the 80000 level and in the first leg moved up to 110183. After a prolonged correction, the price has now managed to break that previous high and begin a new bullish leg.
⚡️ As shown, volume was sharply decreasing during the correction phase, but in the past few candles, significant buying volume has entered the market, enabling the price to break above 110183.
💥 The RSI oscillator is entering the Overbuy zone in today’s candle, which could be a sign of continuation of this bullish move. The next RSI resistance is around 78.47.
🎲 Meanwhile, based on Fibonacci levels, 120140 and 134922 are key zones that could mark the end of this bullish leg. The price is currently very close to 120140, and we need to watch for the market's reaction to this level.
✅ If 120140 is broken, Bitcoin will likely head toward 134922. In that case, I believe this leg could be the final bullish leg of this bull run, since I’ve previously mentioned that my target range for Bitcoin in this cycle is between 130000 and 180000.
📊 The curved trendline I’ve drawn is very important in this leg. As long as the price remains above this trendline, the market momentum will stay bullish, and the likelihood of continued upward movement increases.
🔽 If this trendline is broken, we could see the first signal of a trend reversal. A close below 110183 would confirm that the breakout was fake, and a break below 100763 would open the door for a longer-term short position.
❌ Disclaimer ❌
Trading futures is highly risky and dangerous. If you're not an expert, these triggers may not be suitable for you. You should first learn risk and capital management. You can also use the educational content from this channel.
Finally, these triggers reflect my personal opinions on price action, and the market may move completely against this analysis. So, do your own research before opening any position.
BITCOIN CRASH INCOMING!!! (Brace Yourself Now???) I am breaking down MARKETSCOM:BITCOIN and the potential completion of the 4th wave on an leading diagonal which might work as an early warning of a crash towards $93k!
Wait for the confirmations, and play the market with a proper trading strategy that you have backtested enough to be able to say that you will be long-term profitable. That means make sure your trading system is good enough that you always have an edge and a great enough money management system to make sure that you are giving your edge enough space to play out in the long run and be robust against losing streaks!

Bitcoin Monthly · New ATH vs 2021, Indicators & MoreLast month Bitcoin produced its highest close ever, $107,146. The last three months all closed green, the close was higher than the open, and this is the fourth green month so far.
Bitcoin tends to produce a period of bullish consolidation before a major move, and this is exactly what we are seeing now. Bitcoin tends to produce a correction before a major bullish move, and this is exactly what happened between January and April. Bitcoin is set to grow.
Past action · consolidation
We already looked at the consolidation period that happens between each major price advance. Since 2022, Bitcoin has been moving sideways for some 200-220 days before each advance. This happened in 2022, 2023, 2024 and also now in 2025.
Looking at it from the monthly timeframe, the consolidation period was capped each time at 7 bars, 214 days. Current consolidation has already been going for more than 215 days. Bitcoin is set to continue growing.
Indicators · MAs, RSI & MACD
Bitcoin is trading above all moving averages. The monthly RSI is very strong, beyond 70.6.
The monthly MACD is moving at all-time high levels, trending up with room available for additional growth.
Chart patterns · candlestick reading
The chart patterns now has no similarities to 2021. Many people were saying that Bitcoin produced a double-top similar to 2021 and was set to move down. I completely disagree with this analysis.
In 2021 both instances when Bitcoin peaked the month ended up closing red. In 2025 the months when Bitcoin peaked the months ended closing green.
The same month the peak was hit in 2021 was followed by bearish action, twice. And of course, the bear market. In 2025 the market has been consolidating for months and trading near its all-time high.
Finally, in 2021 each peak was 7 months apart, 214. In 2025, the last two peaks are 4 months apart, only 120 days.
This difference is good to point out because market conditions are not the same. Not the same market conditions means that Bitcoin is not likely to go into a bear market now, instead, it can produce something difference. The market has only three directions: Down, sideways and up.
Down has been eliminated based on past action.
Sideways is happening now.
Something different only leaves the upside open; Bitcoin is going up.
Namaste.

TradeCityPro | Bitcoin Daily Analysis #119👋 Welcome to TradeCity Pro!
Let’s go over the analysis of Bitcoin and the key crypto indexes. As usual, in this analysis I’m going to review the futures triggers for the New York session.
⏳ 1-Hour Timeframe
Yesterday, the price broke out of the range box between 108619 and 110256 that I had marked for you, and with the heavy selling volume that entered the market, this bearish move took place.
✔️ This move continued to the 107448 zone, and as you can see, we are now in a consolidation and rest phase, and once again the volume has dropped significantly.
✨ As I mentioned in yesterday’s analysis, I believe this low volume will persist through the weekend, and for a solid move to happen, we’ll need to wait for the new week to begin.
💥 For now, the price has room to move up to 108619 and perform a retracement. A break above the 50 zone on the RSI greatly increases the likelihood of this move.
📊 If selling volume re-enters the market and the price moves downward, the short trigger we have is the 107448 level, and breaking it could start the next bearish leg.
📈 For a long position, the price must first stabilize above 108619, and then, if we see that buying volume continues and increases, we can enter a long position. The main trigger will be 110256.
⭐ I myself won’t be opening any positions for now and will wait until the market shows some proper volume and trend before entering. If you plan to open a position based on these triggers, I suggest you take on very little risk so that in case your stop-loss is hit, you don’t lose much money.
👑 BTC.D Analysis
Let’s look at Bitcoin dominance. Yesterday, dominance touched the trendline I had marked and is still dealing with this dynamic resistance.
💫 A bottom has formed at 65.38. If this bottom is broken, we’ll get confirmation of rejection from the trendline, and dominance could have a bearish move down to 65.04.
⚡️ If the trendline is broken instead, we’ll have a new trigger at 65.52, and breaking it would confirm a bullish reversal in dominance. The main trigger will still be a break of 65.64.
📅 Total2 Analysis
Now let’s move on to Total2. This index dropped to the 1.13 zone and has now pulled back to 1.14. It seems like it’s getting ready for another downward move.
☘️ If Bitcoin dominance gets rejected from the trendline and moves down, and if Bitcoin moves upward, Total2 could make a very sharp move.
🔑 Even if Bitcoin drops, Total2 might range or even move up. For now, our short trigger is 1.13, and aside from 1.14, we don’t have any specific long trigger.
📅 USDT.D Analysis
Finally, let’s look at Tether dominance. This index made a bullish move to 4.85 after breaking 4.78 and is now in a corrective phase.
📊 If 4.85 is broken, the next bullish leg could continue up to 4.93. If a correction happens, dominance might pull back to 4.78.
❌ Disclaimer ❌
Trading futures is highly risky and dangerous. If you're not an expert, these triggers may not be suitable for you. You should first learn risk and capital management. You can also use the educational content from this channel.
Finally, these triggers reflect my personal opinions on price action, and the market may move completely against this analysis. So, do your own research before opening any position.

CoinMarketCap chart and correlation with BTC
Hello, traders.
If you "Follow", you can always get new information quickly.
Have a nice day today.
-------------------------------------
(USDT.D 1D chart)
USDT dominance is showing a downward trend along the medium- to long-term downtrend line.
The decline in USDT dominance can be interpreted as an upward trend in the coin market.
Therefore, if it remains below 4.91 or continues to decline, the coin market is likely to enter a bull market.
The coin market is expected to show a major bull market until 2025.
At this time, the USDT dominance is expected to fall to around 3.42 and then rise, causing the coin market to enter a bear market.
Therefore, a major bear market is expected in 2026.
-----------------------------------------------
(BTCUSDT 1M chart)
You might think that it would be good if it continued to rise in a bull market, but in reality, that is not the case.
The reason is that if the price continues to rise, you have to buy more money.
Therefore, it will show a pattern of falling when appropriate and rising again when appropriate.
As I mentioned earlier, 2025 is a major bull market, so it will eventually show a rising pattern.
So, when should we buy and when should we sell?
It would be nice if we could know this a little bit faster, but we can never know.
Currently, BTC is renewing its ATH, so it is even more difficult to predict the movement.
Therefore, we can only predict it through predictable chart analysis techniques.
Among them, the method I use is to predict and respond to the high point using the HA-Low, HA-High indicators and the DOM (DMI + OBV + MOMENTUM) indicator using the Heikin-Ashi chart.
The DOM indicator indicates the end of the high and low points, and the HA-Low and HA-High indicators are used to establish a basic trading strategy.
The sky blue (#00bcd4) arrow is generated, indicating that the DOM (60) indicator is likely to be generated soon.
In other words, it means that the end of the high point is becoming more likely.
When the DOM(60) indicator is created, there is a high possibility of resistance, so the price is likely to fall.
Therefore, you should think about a countermeasure for the decline.
However, as I mentioned earlier, since 2025 is expected to show a major uptrend, it is recommended to sell in installments at an appropriate level to preserve profits.
The reason is that we cannot know how far it will fall.
The start of a full-scale decline is likely to begin when it falls below the HA-High indicator.
Therefore, if it falls after the DOM(60) indicator is created, we should observe whether a new HA-High indicator is created.
If a new HA-High indicator is created, the key point is whether there is support in the vicinity.
If a new HA-High indicator is not created, it is likely to fall to the current HA-High indicator location of 73499.86.
-
A trend line has been formed between highs, but a trend line between lows has not yet been formed.
Therefore, it is difficult to predict how far it will fall once the decline begins.
In the 2025 bull market, BTC is expected to rise to around the Fibonacci ratio of 2.618 (133889.92).
Therefore, we should also consider countermeasures for this.
------------------------------------------------
(BTC.D 1M chart)
When will the altcoin bull market start?
I think the timing is when BTC dominance falls below 55.01 and is maintained or continues to decline.
I think the rising BTC dominance means that the funds flowing into the coin market are concentrated toward BTC.
Therefore, we should consider that a market for trading BTC has been formed.
If BTC dominance fails to fall below the 55.01-62.47 range, BTC dominance is expected to rise to around 73.63-77.07.
At this time, it is highly likely that it will encounter strong resistance and begin to decline.
Since it has not fallen below the mid- to long-term trend line, it seems likely that it will continue to rise.
In order to eventually turn into a downtrend, BTC dominance must fall below 60.
If not, I think it will be difficult to expect an uptrend in altcoins.
----------------------------------------------------------------------
(BTCUSDT 1D chart)
This period of volatility is expected to continue until July 11.
Therefore, the key issue is whether there is support near 111696.21.
If there is support at the 111696.21 point, it is expected to rise to the right Fibonacci ratio 2.24 (116940.43).
If not, we need to check whether there is support near 108316.90.
As I mentioned in the previous idea, three conditions must be met to break through the 111696.21 point upward.
- The StochRSI indicator is showing an upward trend with K>D,
- The PVT-MACD oscillator is showing an upward trend (if possible, above the 0 point),
- The OBV indicator of the Low Line ~ High Line channel is maintained above the High Line,
If the above conditions are met, I said that there is a high possibility of a stepwise upward trend from the 111696.21 point.
-
The next volatility period is expected to occur around July 18 (July 17-19).
Therefore, we need to see if it can be maintained above 111696.21 until the next volatility period.
If it fails, we need to check if it is supported above the M-Signal indicator on the 1D chart, near 108316.90.
If not, it is likely to fall to the M-Signal indicator on the 1W chart or near 99705.62.
-
The basic trading strategy is to buy near the HA-Low indicator and sell near the HA-High indicator.
However, if the HA-High indicator rises, there is a possibility of a stepwise uptrend, and if the HA-Low indicator falls, there is a possibility of a stepwise downtrend.
The end of the stepwise uptrend is a downtrend, and the end of the stepwise downtrend is an uptrend.
That is, we can see that the support around the HA-High ~ DOM(60) section and the DOM(-60) ~ HA-Low section will be important turning points for the future trend.
----------------------------------------------------
On the USDT dominance chart, it seems likely that August 3rd will be the volatility period.
Looking at the BTC chart, it seems likely that August 2nd to 5th (August 1st to 6th) will be the pre-movement for the volatility period of August 1st to 6th.
-
Thank you for reading to the end.
I hope you have a successful trade.
--------------------------------------------------
- This is an explanation of the big picture.
(3-year bull market, 1-year bear market pattern)
I will explain more details when the bear market starts.
------------------------------------------------------

BITCOIN: BULL TRAP???! (Be careful if you are long)Yello! I am breaking down Bitcoin, and sharing with you the Elliot Wave descending Leading diagonal formation, Rising wedge aka contracting triangle where E wave might be forming a corrective mode wave triangle itself and, after that’s formed we might start crashing if we will get the confirmations we are waiting for, and which some of them I shared with you in this video. Enjoy Paradisers!

TradeCityPro | Bitcoin Daily Analysis #121👋 Welcome to TradeCity Pro!
Let’s dive into the Bitcoin analysis and key crypto indicators. As usual, I’ll walk you through the triggers for the New York futures session.
⏳ 1-Hour Timeframe
As you can see on the 1-hour timeframe, the upward move Bitcoin made yesterday turned out to be a fakeout, and the price is now heading downward.
⚡️ I’m not moving the 108619 line for now. I’ll wait to see if the price reacts to it again in the future, then decide whether to adjust it.
✅ Currently, if the 107853 level breaks, we can enter a short position. We already have volume confirmation, and if this increase in volume continues, we could see a sharp downward move.
📈 Next support levels for Bitcoin in this timeframe are 106586 and 105370, which can be used as targets.
✨ If Bitcoin starts moving upward again, the long trigger remains the 110256 level. A breakout here would mark the beginning of a true uptrend.
👑 BTC.D Analysis
Bitcoin dominance continued its downward move today, dropping close to the 65.04 level.
🔼 We’re currently seeing a reaction at this level, suggesting some support. A break below 65.04 could trigger a strong downtrend.
📅 Total2 Analysis
This index is still in an uptrend but showing significant weakness. It’s currently sitting on key support at 1.15.
⚡️ A break below this level could give us a short position. Additional support levels are 1.14 and 1.13. For a long position, the only trigger we have right now is 1.17.
📅 USDT.D Analysis
Looking at Tether dominance, it’s still hovering around the 4.78 level. After a brief fakeout below, it has returned above that zone.
📊 If this level breaks again, Tether dominance could move down toward 4.72.
❌ Disclaimer ❌
Trading futures is highly risky and dangerous. If you're not an expert, these triggers may not be suitable for you. You should first learn risk and capital management. You can also use the educational content from this channel.
Finally, these triggers reflect my personal opinions on price action, and the market may move completely against this analysis. So, do your own research before opening any position.
Where Can Bitcoin Go? Part 8 –(MASSIVE 'Resistance or Breakout')🚀📊 Where Can Bitcoin Go? Part 8 – The Final Test is Near! 🔥🔍
Welcome to Part 8 of “Where Can Bitcoin Go?” – the update of this long-running series. Since mid-2023, not much has changed in the structure. That’s the power of solid technical analysis – levels don’t lie.
🟨 The Setup
Bitcoin is now approaching a third test of a major structural resistance. If you’ve followed my 1-2-3 strategy, you know this is where decisions are made:
✅ Test 1: Rejection
✅ Test 2: Rejection
⏳ Test 3: Now pending… the TERMINAL and DECISIVE 'Breakout or Rejection', and this will change everything.
But here’s the deeper layer:
We’re not just testing one sequence. We now have two separate sets of 1-2 rejections —
🔹 One set from 2021 (the Red 1 and 2)
🔹 And a recent one in 2025 (the white 1 and 2)
This upcoming test is the third rejection attempt on both timeframes, making it a rare and extremely significant technical moment.
📐 Price is now near a critical ascending trendline around $115K–$116K, which has been the gatekeeper to parabolic moves in previous cycles.
🔄 Based on historical halving cycles:
548 days post-halving in 2016 → ATH 2017
565 days post-halving in 2020 → ATH 2021
Halving #4 was in April 2024 → 👀 Could this point to a new ATH by end of 2025?
📊 Probabilities
🔹 83% chance we see the third test before year-end
🔹 57% chance of breakout
🔻 43% chance of rejection
⚠️ And here’s the reality check:
If we see that breakout — the market unleashes itself. We’re talking major pumps, potential follow-through moves, and price discovery into untouched zones like $188K, $197K, and beyond.
But... if we get rejected, it won’t be pretty. We could retest major levels like $66K or worse, and lose momentum that took years to build.
And unfortunately — this isn’t like 18K, or 40K, or even the 79K retest.
Things are much more complicated now.
The sentiment, the structure, the risk profile — they’ve all evolved. We cannot afford to have the same blind bullishness we had in those earlier phases. This is a mature part of the cycle, and it demands discipline over emotion.
💬 What’s your take?
Will Bitcoin finally break through?
Is this just another fakeout in disguise?
Are you feeling this same tension in the market?
Let’s talk structure. Let’s talk price. Let’s talk reality.
One Love,
The FXPROFESSOR 💙
Disclosure: I am happy to be part of the Trade Nation's Influencer program and receive a monthly fee for using their TradingView charts in my analysis. Awesome broker, where the trader really comes first! 🌟🤝📈

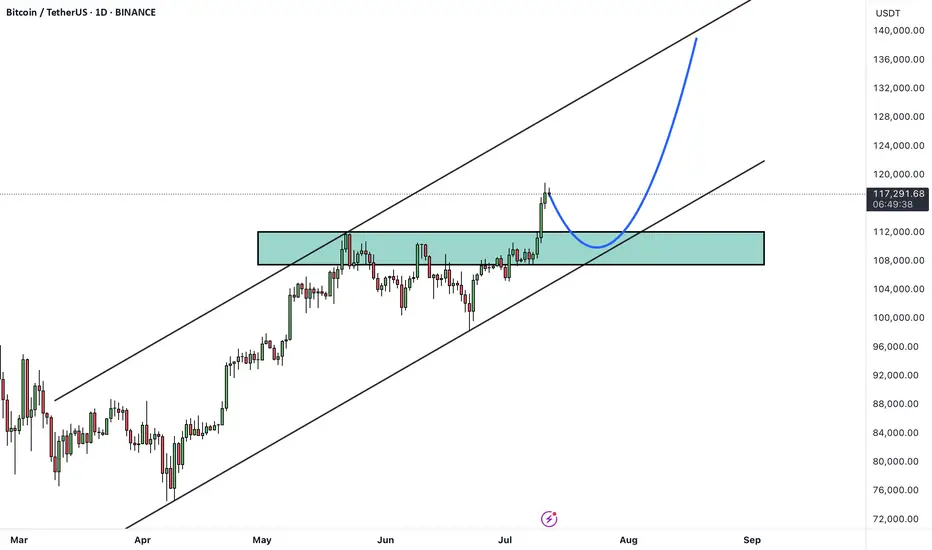
BTC is Back in Price Discovery Mode — Targeting $140K!After a clean break above the previous all-time high, Bitcoin has officially entered a new impulse phase, trading within a steep rising channel.
The green zone around the previous ATH is now acting as a strong support zone, confirming the shift in market structure.
🟠 The macro trend remains intact, and bulls are clearly in control.
🌀 Corrections continue to offer opportunities for trend-following entries, and if momentum holds, BTC could be on its way toward the $140,000 mark — the upper boundary of the macro channel.
Until then, every dip is a gift in this bullish cycle. 🔥
🧠 Trade with the trend. Manage your risk. Stay ready.
📚 Always follow your trading plan regarding entry, risk management, and trade management.
Good luck!
All Strategies Are Good; If Managed Properly!
~Richard Nasr

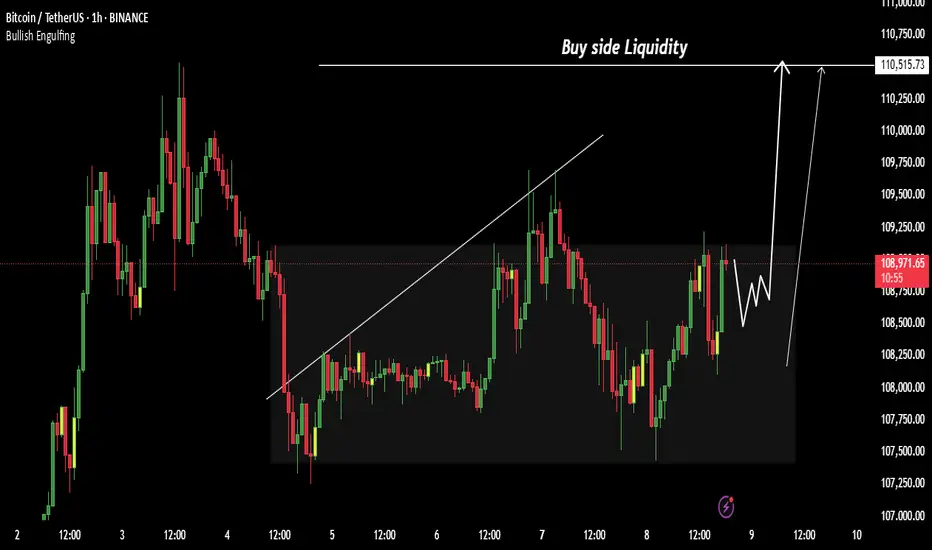
Bitcoin Tests Range High — Breakout or Rotation lower?Bitcoin is currently trading at a critical resistance level — the previous all-time high — which also marks the upper boundary of its multi-month high time frame range. While many are watching for a breakout, price action suggests that a continuation of range-bound behavior is still the more likely scenario. Without decisive volume or structural confirmation above this resistance, BTC may be gearing up for another rotation toward lower support.
Key Technical Points:
- Key Resistance at ATH: Bitcoin is retesting its prior all-time high, which is the current range high
- Volume Remains Weak: Lack of breakout volume signals indecision and caution
- Liquidity Now Resting Below: Upside liquidity has been cleared; downside offers more incentive for market makers
Bitcoin’s price has once again returned to the range high, aligned with its previous all-time high — a level that has consistently capped price over recent months. This area has acted as a significant inflection point where momentum has historically slowed, and price has failed to push through with conviction.
Currently, price action is showing signs of stalling, and importantly, there has been no influx of volume to suggest a true breakout is underway. When volume fails to accompany a test of resistance, it often signals weakening demand or exhaustion from buyers — increasing the risk of a false breakout or rejection.
Additionally, the upside liquidity has already been taken, meaning there’s now less incentive for large players to push price higher in the immediate short term. In contrast, resting liquidity lies beneath current levels, offering greater appeal for a downward move — particularly for market makers seeking efficiency and liquidity capture.
From a technical perspective, Bitcoin remains range-bound until a decisive breakout above the highs occurs with supporting volume and strong candle closures. As of now, this has not happened, keeping the likelihood of a rotation lower well on the table. Should price begin to trade down, watch for a move toward the mid-range or even the lower boundary of the range, depending on how momentum unfolds.
Unless Bitcoin breaks above its all-time high resistance with strong volume, expect the range structure to hold. A lack of bullish follow-through may lead to a rotation toward lower support levels.
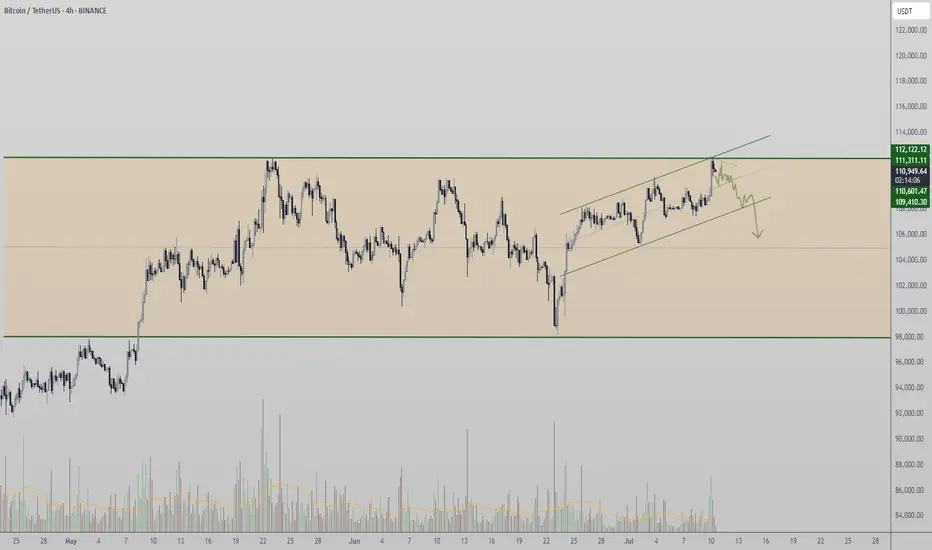
BTC/USDT Chart Analysis (4H)Patterns and Structure:
Bitcoin remains inside a larger converging structure (symmetrical triangle/wedge) visible from the diagonal trendline.
The price has recently broken above the descending resistance trendline but is hovering near the red resistance area (~$109,000–$110,000).
Ichimoku Cloud:
The price is currently above the Ichimoku Cloud, which acts as support (~$107,000–$108,000 area).
The cloud below the price is green, indicating bullish momentum.
Key Areas:
Resistance Area: $109,000–$110,000 (red box). Multiple previous rejections from this area.
Support Zone: $106,000–$107,000 (cloud and trendline support).
Key Lower Support: The green box near $98,000–$100,000, in case of a deeper retracement.
Possible Scenario:
As your blue arrow suggests, if Bitcoin consolidates above the breakout level (~$108,000), a rally towards the next major resistance between $112,000–$114,000 is likely.
Conversely, losing the breakout zone could see BTC return to retest lower support levels around $106,000 or $100,000.
Short-term Outlook:
The trend bias remains bullish as long as BTC stays above ~$107,000.
Monitor price reaction to the red resistance zone for breakout confirmation or potential rejection.
Conclusion:
BTC is showing signs of strength, but the $109,000-$110,000 resistance zone is crucial. A confirmed breakout above this zone could accelerate the move towards the $112,000-$114,000 targets.
Stay tuned for updates and key levels to watch!
Thanks for your support!
DYOR. NFA

War news are actually good news for Crypto & GoldI Love Global Peace and hope all Wars end soon.
Here are my thoughts about Crypto when war Starts between two countries or more.
i think After wars so many reasons will help Crypto to see gain specially for Bitcoin which is the King of this market.
Some of the major Reasons in my view are:
A. Countries currency or Markets start to fall :
Usually with starting of war, we have two countries that are involved and due to negative effects of war on different Economic parameters cause weaker country or both currencies lose the power of Their currencies and it start To dump.
weak countries Bank can get hacked or worst scenario a countries currency can get 0 by the time.
most of the times Their stock markets also Face with huge losses.
B. People start to Buy more Gold or Bitcoin and ...
with things mentioned above and other reasons their People start to Buy more Crypto usually and Metals like Gold.
C. People start to migrate to other countries with their Crypto Wallets Only
Some start to leave their countries and Sell their Cars homes and ... and turn them to BTC or... and transfer their money and life to a peaceful country.
D. Spies and bribery gets more in those countries which all is done with Crypto usually
Corruption & Spy jobs and ... increases in those countries usually and the money on this Fields usually transfer Via Crypto or Gold and Silver which is harder to track.
And with these reasons which mentioned Above usually in the past all the Attention comes to Metal like Gold and the Value of it increase in Wars, but now Days Bitcoin(&Crypto Tokens) also gets more value and attention in war in my personal View and See gain in price too.
DISCLAIMER: ((trade based on your own decision))
<<press like👍 if you enjoy💚

FOMO price increase, create new ATH💎 Update Plan BTC weekend (July 11)
Continuously creating a new ATH, preparing to have a short sale?
The reinforcement of Bitcoin price around the upper boundary of the previous consolidation area was broken at $ 108,355, which ended on Wednesday. The price has soared to the highest level of the new time of $ 116,868 on Thursday. At the time of writing on Friday, the price is fluctuating above $ 116,600.
When BTC entered the price exploration regime and if the trend of increasing continues, the price can expand the momentum to an important psychological level of $ 120,000.
Technical analysis angle
Our community has continuously chose the trend of increasing as the mainstream for all previous transactions and currently preparing to welcome 120k as forecast.
The relative power index (RSI) on the daily chart reaches 71, higher than the excess buying 70, showing a sharp increase. However, traders should be cautious because the ability to adjust the decrease is very high due to over -purchase. Meanwhile, the average divergence dynamic indicator (MACD) has shown a price intersection at the end of June. The indicator also shows that green histograms are increasing on neutral zero, showing that the rising momentum is being strengthened and continues to increase.
However, if BTC must be adjusted, the price may extend the decline to search and support around the upper boundary of the unified area that has been broken earlier at $ 108,355.
Plan has been constantly accurate in the past 2 months, which is the positive signal of the channel that brings value to the community.
Please follow the channel to receive accurate scenarios about gold and BTC
==> Comments for trend reference. Wishing investors successfully trading
July 10th Market Outlook –Charted Waters & Uncertain Momentum🗓️📊 July 10th Market Outlook – Charted Waters & Uncertain Momentum 🌊⚠️
Today’s breakdown is a reality check for traders navigating a market full of setups but short on clarity. Resistance is stacking across the board, but that doesn’t mean we can’t break through — it just means we need to stay sharp and keep our charts close.
🔎 Highlights from the 19-minute video:
Bitcoin is approaching a third and crucial resistance test. A breakout could trigger ultra-FOMO, but failure here could send us lower.
Ethereum is in a pressure zone — the "Symplegades" setup from Greek mythology reflects today’s narrow trading path.
Bitcoin Dominance is clinging to support — if it breaks, altseason could be on. If it holds, alts may stay sidelined.
NASDAQ & Nvidia have delivered massive runs, but signs of exhaustion and reversal risk are showing.
Dollar Index (DXY) showing a Golden Cross, but unresolved rate expectations could catch markets off guard.
💬 I also speak candidly about market manipulation, being someone else’s exit liquidity, and why we might be heading toward a formative trap before any true breakout.
🎥 Watch the full video to catch all the details — from long-term setups to real-time chart reactions.
📌 Stay tuned for detailed updates today on Bitcoin, Ethereum, Bitcoin Dominance, NASDAQ and more.
One Love,
The FXPROFESSOR 💙
Disclosure: I am happy to be part of the Trade Nation's Influencer program and receive a monthly fee for using their TradingView charts in my analysis. Awesome broker, where the trader really comes first! 🌟🤝📈
