Trade ideas

Brainiak | Bitcoin in ConsolidationAfter projecting a move toward the 94,000 level, the market has now reached that target. The only concern is the sharp rejection that occurred immediately after the test. This kind of reaction suggests a high probability that the market may not be ready to break upward yet.
Here are the major zones, ranked by likelihood, based on how deep the pullback goes and how that affects the chance of continuation:
The strongest continuation zone is above 89,000. If the pullback stays within this area and shows a clear reversal signal .. without forming a fast, aggressive V-shape drop .. then the probability of a bullish continuation remains high. The decline should be relatively slow and controlled for this zone to hold.
The next area is around 86,000. This is still workable, but price action will likely begin forming more sideways structure, meaning the market may dip first before attempting another push upward.
The least likely bullish zone is around 84,000. If price tests this zone, fails to hold, and breaks below it, then the market would need to move lower before any meaningful bullish structure can form again.
For now, the only thing left is to wait for price to retest 94,000 .. and ideally break above it. The next move hinges on that retest.

$BTC Critical Phase Update! CRYPTOCAP:BTC got rejected from marked supply, and I’m staying flat for now. Until red box breaks, CRYPTOCAP:BTC is in a critical phase.
Remember: breaking red box doesn’t mean we go straight to ATH. It just means 4H trend turns bullish, and we might see some upside move.
“So don’t assume breakout = ATH”

BTC long ideadespite all the choppiness and seemingly radical moves, I believe bitcoin is still on course towards 98000.

Bitcoin 09.12.2025The price has spent a period moving between VAL → POC → VAH.
We can now see that it is successfully tapping into the upper zone of the VAH.
If buyers continue to show interest in this upper area, we may witness some notable reactions and potential shifts in market behavior.

BTCUSDT Trade Plan (December 08, 2025)BTC Trade Plan (December 08, 2025)
(D1 Bearish / H4 Sell Rallies → Compression / H1 Neutral / M15 Chop)
⬛️ 1. Higher Timeframe Context (D1 and H4)
• D1 bias: bearish (descending channel post-ATH)
• D1 range (approx): 84,000 – 126,000 (current lower third)
• Key D1 zones:
• Supply: 100–105k (broken)
• Demand: 88–90k channel low
• H4 bias: sell rallies turning compression (ascending triangle forming)
• H4 zones of interest:
• H4 Sell Zone 1: – recent rejection + supply cluster
• H4 Buy Zone 1: – weekend low + trendline
Active setups counter-trend long on dip (whale accumulation support), trend-aligned short only on clear rejection.
⬛️ 2. Preferred Setups by Horizon
🔳 2.1 Swing Setup (D1/H4)
Counter-trend long the channel low / whale accumulation zone. Time horizon: multi-day to weeks.
🔲 2.2 Intraday Setup (H1 focus)
Buy dips to 89.5-90k or breakout above 92k. Time horizon: intraday to overnight.
▫️ 2.3 Scalp Setup (M15 focus)
Scalp range 90-92k or absorption plays — higher risk in chop.
▪️ 2.4 Arbitrage/Pairs: BTC dominance rising → BTC outperforming alts short-term.
🟩 3.1 Long Setup (Trend-Aligned with On-Chain / Swing-Intraday)
• Execution timeframe: H4/H1
• Trigger timeframe: M15
• Entry zone:
• Pattern tags: Trigger conditions:
• Successful defense 88-90k zone + CVD higher low
• H1/H4 BOS up on volume
• Whale accumulation continuation
🟥 3.2 Short Setup (Counter-Trend / Scalp Only)
• Execution timeframe: H1
• Trigger timeframe: M15
• Entry zone:
• Pattern tags: Trigger conditions:
• Clear rejection with delta divergence high
• Failure to break 94k pre-FOMC
🔴 4. Stops (Invalidation Levels)
Long setups: 87,500 (channel break = bear confirmation)
Short setups: 94,500 (breakout = squeeze)
🟢 5. Targets
Long (swing/intraday):
• TP1: 92,000 (VWAP/H1)
• TP2: 94,000-95,000 (supply test/H4)
• TP3: 100,000+ (HVN/D1 optional)
Short (scalp):
• TP1: 90,000
• TP2: 88,500
⬛️ 6. Position Sizing
• Baseline trend-aligned long (on-chain supported): 1.0%
• Counter-trend short: 0.4%
• Adjustments: +20% (whale buying + clean lev + Fed tailwind) → Effective: longs 1.2% risk, shorts 0.3% max
⬛️ 7. Risk Flags
• FOMC Wednesday → vol expansion risk
• Thin liquidity mid-week
• Residual weekend trauma → fake moves possible
• Macro correlation re-assertion if equities dump
⬛️ 8. Flip Conditions
Bull → bear flip: clean close below 88k with volume + funding negative
Bear → bull flip: H4 close >94.5k + CVD reset + whale continuation
⬛️ 9. Alternative Scenario
Reject hard at 92-94k → descending triangle breakdown → fast move to 84-87k LVN void (bear trap completion, high risk short only with tight stop).
⬛️ 10. Model Self-Critique
• Assumptions: whale accumulation continues, Fed delivers dovish cut, no macro shock
• Vulnerabilities: sudden risk-off equities dump, whale distribution resumption, FOMC hawkish surprise
• Behavioural: do not chase breakouts pre-FOMC, do not average into losing shorts against whales
⬛️ 11. Uncertainty and Constraints
Uncertainty: medium → require flow + pattern confirmation, no high lev, prefer size on confirmed absorption only.

BTC/USDT Analysis. Uncertainty, but Long Bias Remains
Hello everyone! CryptoRobotics trader-analyst here, and this is your daily market update.
Yesterday, Bitcoin failed to show a clear directional bias and continued trading within a narrow range, accumulating volume. Pressure on the cumulative delta remains on the sellers’ side, especially on spot markets, which adds uncertainty to the current structure.
Despite this, the overall long bias remains intact: the broader structure has not been broken, and the probability of upward continuation after a local liquidity sweep is still high. However, Bitcoin may first retest the $87,800–$86,400 (volume zone) before forming a new bullish impulse.
During this phase of consolidation, it is more prudent to stay out of the market and wait for a clearer setup — either a reaction from key support or a breakout through resistance. This will provide a much cleaner risk profile for new long positions.
Buy Zones
$87,800–$86,400 (volume zone)
$84,000–$82,000 (volume anomalies)
Sell Zones
$94,000–$97,500 (volume zone)
$101,000–$104,000 (accumulated volumes)
$105,800–$106,600 (local resistance)
This publication is not financial advice.

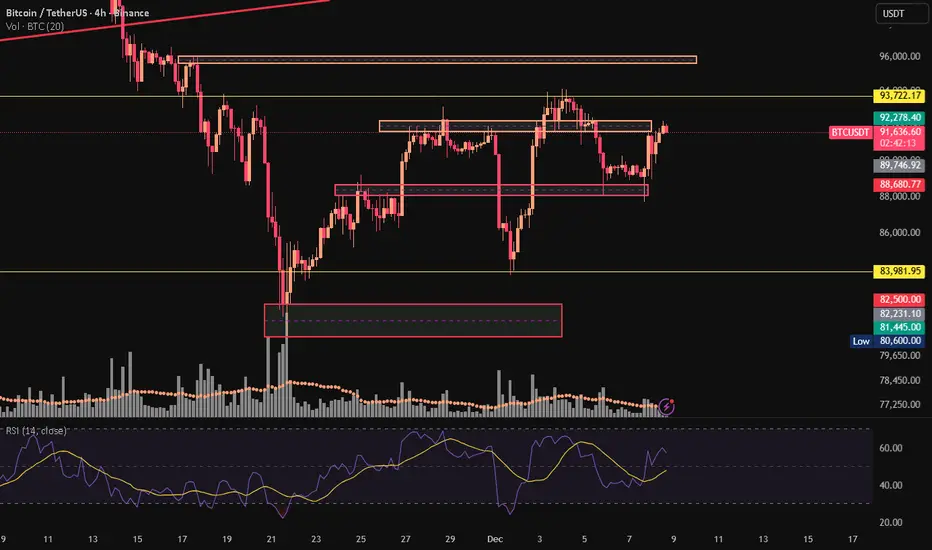
BTC/USDT | Consolidation and fall (READ THE CAPTION!)By examining the 4H chart of BTCUSDT, we can see that BTC is struggling to make a move and is consolidating over the IFVG. If it fails to make a move, a fall to the Demand Zone at 86,600 is possible. However, if it manages to go up, it'll face the FVG at 94,500 level, which then determines whether BTC can make an upwards move or falls again.

Wyckoff Distribution. Long term liquidity levels reached.Liquidity we have been tracking for months from orderbook instability in our lower time frame threshold tracker has just been absorbed, see horizontal boxes on screen. I believe we are happy here, waiting for fed…

Bitcoin Price Prediction: Recovery To $100,000 Could Be Tainted Bitcoin’s price is at $90,399 at the time of writing, sitting just below a downtrend that has persisted for one and a half months. BTC is attempting to flip $90,400 into a support level, which would mark the first step toward reversing the trend.
If macro conditions align and rate cuts revive broader market optimism, BTC could rebound sharply. A clean bounce from $90,400 may drive a retest of $95,000, and breaking that resistance would open a clear path toward the long-anticipated $100,000 level.
However, if short-term holders sell into strength, Bitcoin may struggle to maintain upward pressure. A rejection from $95,000 or failure to break the downtrend could send BTC back toward $86,822, invalidating the bullish scenario.

EcoByG Bitcoin Daily Analysis #6 — Daily BTC Market UpdateWelcome to My Analysis.
Now, let’s break down today’s Bitcoin structure.
Bitcoin attempted once again to break through the liquidity zone at 91,800–92,300, but since buyers showed no demand in that area, price was rejected again and returned back into the equilibrium zone.
Here, the moving averages have tangled back together, showing indecision.
The moving average values are:
28, 58, and 99.
The RSI shows that there is still no meaningful momentum entering the market — meaning Bitcoin hasn’t picked a direction yet.
This suggests the market needs more time before participants decide whether to put serious money in or not.
Most traders prefer to stay patient for now.
For short setups, the earliest possible level is around 89,000,
but for long setups, we still don’t have proper confirmation above 92,300.
Taking a long here would be unsafe and risky, and it’s better to give the market more time.
Trading volume is still balanced between buyers and sellers, which means the market remains in equilibrium.
⚠️ Risk Alert ⚠️
Futures are not beginner-friendly. These triggers require solid experience.
Before using them, study risk management and practice with the learning content here.

BTCUSDT: Update On Todays Market.BTCUSDT continues to scale slowly upward after dropping down to $80,534. the pair is moving on a momentum of higher highs and lows. presently the price is heading down towards the next low, in respect of the structure. the best alternative at this point is buying at lows and selling at highs
Possible outline;
A confirmed reversion above $84,071. would trigger a buy position, eyeing $96,146 as target.
Lets see how it plays out.
keep it simple, keep it trading.
Thanks for reading.

BTC Most Likely Scenario -- 98K -> 70KBTC Most Likely Scenario -- 98K -> 70K
Probability for BTC next move is to go to 98k-100k level. Then go take the liquidity between 70-74k. We probability will make a bullish divergence on that level. Will see then if we make a LH in upcoming months or another ATH.

EcoByG Bitcoin Daily Analysis #5 — Daily BTC Market UpdateWelcome to My Analysis.
Now, let’s break down today’s Bitcoin structure.
Bitcoin isn’t bullish yet — it’s just ranging inside a downtrend.
And unless one level breaks, the market is preparing for another move down.
Here’s the breakdown.
Market Structure
The primary trend is still bearish — price is trading below broken structures and several major resistances.
The current move is mostly a corrective rally inside the downtrend, not the start of a new uptrend.
Price action & candle behavior
Price is currently oscillating inside a tight range between 89,800 and 93,700.
The recent upward move is a correction wave inside the bearish structure.
The last pullback bounced exactly off 88.7K support, and price is now heading back toward the range top.
Volume
There was a strong volume spike at the 88.7K bottom → indicating buyer entry.
However, volume has declined during the recent rise, which shows the rally lacks full conviction.
RSI
RSI bounced from the range bottom (near 30).
A small bullish divergence is visible.
Still, RSI remains well below buyer power (below 70) → the upside is not yet fully confirmed.
Final summary
Overall structure: still bearish.
We are inside a corrective range within a downtrend.
93,700 is the key level for either breakout or reversal.
Until 93,700 is cleanly broken, the range continues and the probability of another drop back to 88.7K is high.
Deeper supports: 84K → 82K.
⚠️ Risk Alert ⚠️
Futures are not beginner-friendly. These triggers require solid experience.
Before using them, study risk management and practice with the learning content here.
Analytics: market overview and forecasts
WHAT HAPPENED?
Last week, for bitcoin, we reached the upper limit of a significant support zone and almost immediately received a powerful boost. This led to a change in the local trend to an upward one.
As part of the growth, the resistance of $94,000-$97,500 (volume zone) was reached, from which the correction began. Now we've pushed off from the support of $87,800-$86,400 (volume zone) and maintain the upward context.
WHAT WILL HAPPEN: OR NOT?
The movement potential is aimed at updating the local maximum. To fully reverse the trend, the buyer needs to demonstrate more strength.
The $94,000-$97,500 zone remains relevant, as a significant part of it hasn't been tested. The implementation of a positive scenario is possible both through a confident breakdown of this range, and through the formation of a weak correction in terms of volume and price action.
A negative factor for the development of the long rally this week is the selling pressure on the spot market, as seen by the cumulative delta. The situation is better in futures, but the market needs more "fuel" for a final turnaround.
Alternative scenario: with a strong defense of the nearest resistance, a sideways trend may form in the range of $84,000-$94,000.
Buy Zones
$87,800–$86,400 (volume zone)
$84,000–$82,000 (volume anomalies)
Sell Zones
$94,000–$97,500 (volume zone)
$101,000–$104,000 (accumulated volumes)
$105,800–$106,600 (local resistance)
IMPORTANT DATES
We're following these macroeconomic developments this week:
• Tuesday, December 9, 15:00 (UTC) — publication of the number of open vacancies in the labor market (JOLTS) USA for October;
• Wednesday, December 10, 2:45 (UTC) — announcement of Canada's interest rate decision;
• Wednesday, December 10, 19:00 (UTC) — US FOMC statement and economic forecasts, as well as the announcement of the US Federal Reserve interest rate decision;
• Wednesday, December 10, 19:30 (UTC) — US FOMC press Conference;
• Thursday, December 11, 9:00 (UTC) — press conference of the National Bank of Switzerland;
• Thursday, December 11, 13:30 (UTC) — publication of the number of initial applications for unemployment benefits in the United States for the week;
Friday, December 12, 7:00 (UTC) — publication of the UK GDP for October, as well as the German consumer price index for November.
*This post is not a financial recommendation. Make decisions based on your own experience.
#analytics

Vanguard Turns Pro Crypto | Bitcoin Responds InstantlyBitcoin surged massively on Dec 2–3 after Vanguard ( a $11T asset manager long known for its anti-crypto stance ) opened its platform to spot ETFs for BTC, ETH, XRP, and SOL. This gives 50M+ traditionally conservative investors direct access to crypto products for the first time
The shift follows the appointment of new CEO Salim Ramji, formerly at BlackRock and involved in launching IBIT, a clear signal of strategic realignment
Market response was immediate:
- BTC jumped minutes after the U.S. open
- IBIT hit Billions $ in volume in the first few minutes
- Analysts noted a “ wave of Vanguard clients moving at once ”
Despite the Coinbase Premium Index still negative, U.S. spot demand is improving. A move back to neutral or positive premium could set up the next leg toward the $100K zone
With Vanguard now engaged, this is not a short-lived catalyst. Even a 0.5% allocation of its AUM would mean $55B in potential flows, larger than the entire first year inflow of the 2024 ETF cycle
Vanguard joining the market marks the true beginning of institutional scale crypto adoption

Wait for Nice!I placed an order with 25% cash on the price of $61,800.
After that, we will monitor the trend, volume and behavior of the market around this price.
Let's see what will happen!

Buy before Pump! BTCUSDTAccording to the areas, previous halving trends, and weekly candles, 2 points for step-by-step purchase of Bitcoin are identified in the chart.
Don't forget capital management! be profitable.

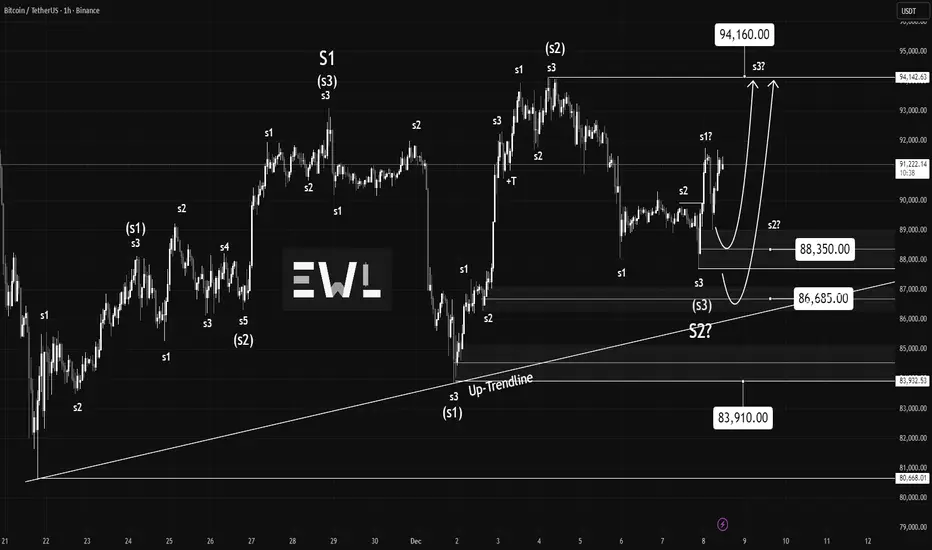
Brainiak | Bitcoin at an in-between stageBitcoin is showing a strong likelihood of pushing up to test the 94,160 level. It’s almost there already. Once price reaches that zone, the next thing to watch is whether it can hold above 94,160. Ideally, it should consolidate and continue higher... not break slightly above the level only to slam back down with force.
If that kind of rejection happens, price would likely swing inside the 94,160–83,910 range again, and that scenario isn’t very promising. The dominant trend that sent price down earlier was bearish, and the current structure is leaning more sideways than decisively bullish, which usually signals continuation to the downside.
But here’s the conflict: the current S1–S2 formation (large degree) is sitting right inside what can only be described as a true “buy the dip” zone .. the same large demand area that previously launched Bitcoin into its prior ATH. It’s a region where buyers naturally step in, and volume can spike hard. The long-term trend still favors the bulls.
This creates a tension between two forces:
- Short-term behavior and Sideways movement hinting at downward continuation.
- Macro context and Price sitting in a deep discount zone aligned with the major uptrend.
With the idea that trend is your friend, the primary bias leans toward looking for buy setups rather than sells .. even though the short-term structure looks messy.
There are three main buy zones I’m watching:
88,350
86,685
83,910
The second and third zones (86,685 and 83,910) are especially attractive because they sit deeper in the range .. meaning the reward-to-risk becomes heavily favorable if price bounces there.
But 88,350 also shouldn’t be ignored. Price could easily retest that level and rally straight from there. It’s a legitimate buy area as long as you keep a proper stop-loss.
If you want to be even more conservative, wait for the 15-minute structure to develop a bit more. The current small S1/S2 sequence on the far right looks a little compressed, and it may need more formation before a clean upward leg.
If price breaks below 83,910, step aside. Let it form a new structure.
Right now, trading within the range gives the most advantage: buy near the lower boundary and take profit near the top of the box around 94,160.
Another thing to note is the Up-Trendline. A trendline is just a guiding framework .. if it breaks, the probability of a continued move upward decreases, but it doesn’t drop to zero. It only becomes zero once price breaks below the key zone I mentioned earlier (83,910). If that level fails, I’ll step aside and wait, because sometimes it can still turn out to be a false break.
That’s the outlook for now.
Thanks to everyone who commented and showed support. I’ll keep updating the chart as things unfold.
BTCUSDT Buying IdeaThis area is identified as a strong buying zone, where price has historically found support and buyers have stepped in. The market shows signs of accumulation, indicating that bullish momentum may develop if the zone holds.
Traders should wait for a confirmation signal, such as a bullish candle or a shift in market structure, before entering long positions.
📍 Zone: Strong buying area
📍 Structure: Accumulation forming / higher lows
🎯 Bias: Bullish continuation potential
⚠️ Wait for confirmation before entry

BTCUSDT: Trend in 4-H time frameBitcoin has dropped to around $102,300. The key support level and the 50 MV in weekly time frame are both located near $99,700. It’s important to note that there’s a $3,000 price gap, which makes a retest of that zone quite possible.
Looking at Bitcoin’s current setup, there’s also a chance it could retest the 200 MV in daily time frame, situated near $106,800.
A major resistance level can be found around $115,800, and price action around that zone should be watched closely.
Overall, market conditions remain uncertain and unsettled, making it difficult to define a clear trend for Bitcoin or the broader market. That said, the overall trend remains bearish, with potential downside targets across different timeframes around $91700, $81200, $75100, and $70300. Reactions at these levels are to be expected — but if this downward trajectory continues, altcoins are likely to suffer more severely, possibly testing even lower price levels.
The color levels are very accurate levels of support and resistance in different time frames.
A strong move requires a correction to major support and we have to wait for their reaction in these areas.
So, Please pay special attention to the two accurate trends, colored levels, and you must know that SETUP is very sensitive.
BEST,
MT

Chapter II: Mirrors and Reflections The apprentice moved quickly, hands darting across wires and tools with impressive confidence. His speed was his pride... proof of his growing skill. Yet in the reflection of the tech’s watchful eyes, that very strength began to reveal its cracks.
What once seemed mastery now showed signs of haste: bolts tightened too fast, readings skimmed instead of studied, conclusions drawn before the silence of the machine had spoken. The mirror of his own reflection showed him not triumph, but fragility.
The tech did not scold. Instead, he recalled Terry...the mentor whose lessons were never rushed. Terry’s path was steady, deliberate, and patient. He taught that true understanding was not measured by speed, but by depth.
“Your quickness,” the tech said, “is a gift. But gifts can betray you if you lean on them too hard. Strength without patience becomes weakness. Terry knew this. He walked the slower road, and because of that, he saw further than most.”
The apprentice lowered his tools, realizing that reflection was not about seeing himself as he wished to be, but as he truly was. In the mirror of his mistakes, he found the lesson: patience is not the opposite of progress...it is the foundation of it.
BTCUSDT – Final Liquidity Sweep Before a Push to 95–96K?DISCLAIMER:
Not Investment Recommendation or Financial Advice.
This analysis is purely for educational purposes and to test a trading strategy.
BTCUSDT – Final Liquidity Sweep Before a Push to 95–96K?
Bullish scenario forming on the 4H despite macro resistance
BTC continues its recovery from the strong correction that drove price from $125K down to $81K. Since that capitulation low, the market has been printing a sequence of higher highs and higher lows, forming a constructive 4H bullish structure.
After reaching a rebound high around $94K, BTC corrected again into the $88K zone, where liquidity was collected and buyers defended the level. Price is now consolidating near $89K, directly below key dynamic resistance.
🔥 Key Technical Factors
1. Weekly & Daily EMA-50 Acting as Dynamic Resistance
BTC is running out of time to break above the EMA 50 on both weekly and daily timeframes, a major level controlling the macro trend.
A confirmed break above this band would re-activate bullish continuation toward prior supply.
2. Higher-Timeframe Market Structure Remains Constructive
From the $81K low, BTC has developed:
Higher lows showing demand absorption
Higher highs confirming controlled bullish momentum
Well-defined liquidity zones above and below price
3. 4H Indicators Signaling Momentum Shift
Multiple 4H indicators are aligning:
MACD curling upward
Stochastics crossing up from oversold
ADX rising, indicating trend strength building
These signals support the potential for a bullish breakout.
4. Liquidity Mechanics
There is still untapped liquidity below the recent local low.
A final liquidity sweep into this area could be likely be the catalyst for the next upward leg.
🎯 Upside Target Zone: 95K–96K
BTC next logical targets based on:
liquidity heatmaps
volume profile gaps
prior breakdown levels
…are between $95,000 and $96,000.
Fundamentals may support this: the expected 25bps Fed rate cut this week could inject short-term bullish momentum into risk assets.
📌 Summary
BTC remains in a structural uptrend on the 4H chart.
The most probable sequence:
Sweep remaining downside liquidity
Bullish reversal confirmation
Continuation toward 95–96K
As long as $87.8K–$88K holds, the bullish setup remains intact.
