big fall or not?actually all of this falls is related to japan 10y papers
i think this is the start of market falling maybe a little go up but 68000 is mostly possible
this is not a good time to invest in crypto and i think there is no ALT SEASON yet
its just idea and not for trade in anything do your strategy
Trade ideas

BTC Bear Market AnalysisBitcoin confirms bear market with monthly MACD turning red, echoing past downturns. Price slid to ~$86K, down 4.55%, mirroring 2022 trajectory post-FTX with 16-17% November losses.
Key Bearish Signals
Bear flag breakdown targets $66.8K; immediate supports at $85.5K-$82K.
Lower highs/lows, EMAs sloping down, bearish engulfing on daily.
Whales distributing, weak ETF demand fuel deeper retests
#BearMarket #Bitcoin #TradingSetup

BTC Weekly Update📊 BTC Weekly Update
Right now, BTC is testing an important support zone in blue 🔵.
If this support breaks down,
the next major support zone is around $65,000.
However, BTC could first stabilize near $71,000 before moving lower.
At the moment, BTC is more bearish than bullish —
there are no strong bullish signs on the higher timeframes.
As you already know:
when BTC drops, many altcoins dump even harder,
so if you're only holding, be careful.
But remember —
you can still make money in a shorting market.
As long as BTC does not break above $97,000,
I remain more bearish for now.

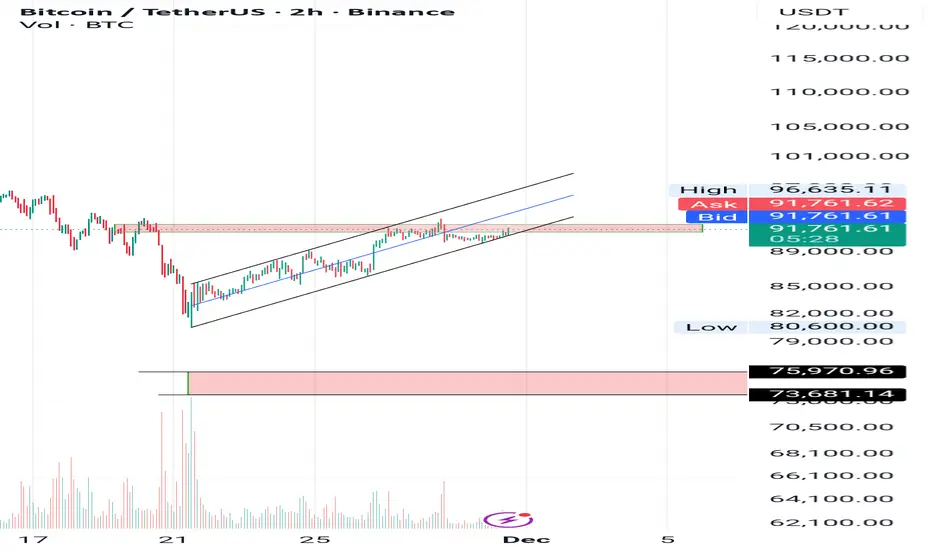
BTC Update — Head & Shoulders Wipeout Loading🌊📉🏄♂️
BTC pushed all the way into that 90K resistance wall last week, cracked above it for a split second, but the bulls just couldn’t keep the board steady up there. The breakout had zero follow-through. As soon as the new week opened, sellers smacked price right back below 90K 💥 — pure rejection energy.
And then comes the spicy part:
BTC printed a clean head & shoulders reversal pattern right on top of that level. You don’t see them that perfect at macro resistance too often 🤙⚠️. It’s basically the market throwing up a big glowing sign saying “momentum’s fading, brace yourself.”
Since that rejection, price has been sliding with almost no fight — smooth downside flow, weak bounces, and candles drifting like they’re just following gravity. Right now BTC is cruising toward the 80K support zone, but let’s keep it real: that zone is not the strongest reef on the map 🪨😅. It’s more like a soft sandbar than a rock-solid base.
If bears keep their rhythm and push with conviction, the next meaningful level where price could actually stabilize is the 75K region — a spot with deeper memory, stronger liquidity, and way more structure behind it.
The vibe here?
The chart is moving clean, respecting levels, and flowing exactly the way the pattern suggests. No need to panic, no need to guess — just ride the structure and let the waves tell the story 🌊📊🔥.
Could BTC still bounce inside this move? Totally. But until we see stronger reactions from buyers, the downside waves are the ones with real shape and momentum.
This is one of those conditions where patience, awareness, and discipline pay more than prediction.
💬 What do you think about this scenario? Only share your idea if you’ve got another opinion — otherwise just hit that button 👍
#BTC #Bitcoin #Crypto #Trading #TechnicalAnalysis

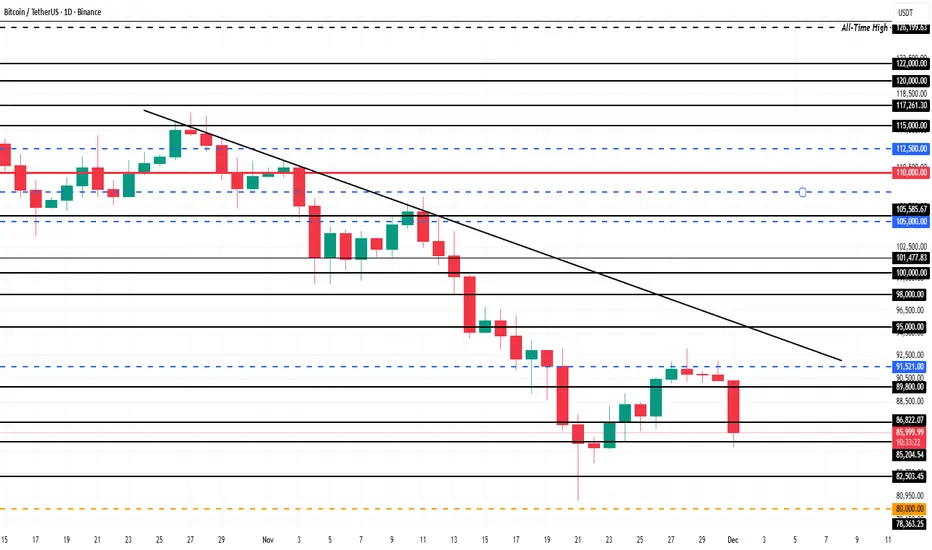
Bitcoin Price Falls To $86,000; Will It Shake Out Weak Hands?Bitcoin is trading at $86,005, holding just above the $85,204 support level. The asset remains trapped under a persistent downtrend that has lasted more than a month. This would preventing any sustained recovery attempts.
If market conditions worsen or short-term holder selling accelerates, Bitcoin could break below $85,204. A drop through this support would expose the price to $82,503 and potentially deepen losses as fear rises across the market.
However, if buyers step in and support strengthens, Bitcoin could reclaim upward momentum. A bounce from current levels could send BTC toward $89,800. A decisive move above that resistance would be essential for Bitcoin to retest $90,000 and invalidate the bearish thesis.
price reductionWe can predict a price decline to the support floor in the inverted triangle pattern.

Bitcoin's massive fall to $50,000. OMGA massive bankruptcy for a strategy company with Bitcoin falling to $50,000, and this event will be the driving force behind the price explosion to $500,000 over the next 10 years, making it the biggest investment opportunity of the century. So, follow the market direction without bias and know that huge companies have gone bankrupt before with the fall of even gold, but gold has always recovered and remained a store of value, and this time it is Bitcoin's turn to test.
Patterns, fundamentals, technicals, and all indicators and oscillators confirm this scenario, so let's remain unbiased.

Analytics: market outlook and forecasts
WHAT HAPPENED?
Last week, we continued the upward movement to the next selling zone. After reaching it, the market moved sideways, forming a pivot point at $ 90,000. We expected a reaction and continued purchases to the next zone, but a less likely and more negative scenario worked out.
Today, at the opening of trading, an active seller increased the pressure, which led to a breakdown of the lower consolidation boundary. The context abruptly changed to a top-down one. The decline stopped in the local buying zone of $88,000-$86,000. At the same time, all volumes from below are absorbed by limit orders, and the reaction of buyers doesn't give grounds to expect a rapid recovery in growth.
WHAT WILL HAPPEN: OR NOT?
The base scenario is a correction to the zone of volume anomalies of $84,000-$82,000. Increased protection can be expected from this area. However, if the selling pressure persists, resistance may already appear at the levels of $86,000-$88,000.
If protection doesn't appear, the week will turn out to be bearish again, and the decline will continue at least to the level of $ 74,500.
Buy Zones
$84,000–$82,000 (volume anomalies)
Sell Zones
$89,800–$90,800 (cluster anomalies, mirror zone)
$94,000–$97,500 (volume zone)
$101,000–$104,000 (accumulated volumes)
$105,800–$106,600 (local resistance)
IMPORTANT DATES
We're following these macroeconomic developments:
• Monday, December 1, 14:45 (UTC) — the publication of the index of business activity in the US manufacturing sector for November;
• Monday, December 1, 15:00 (UTC) — publication of the US manufacturing price index for November;
• Tuesday, December 2, 1:00 a.m. (UTC) — speech by Fed Chairman Jerome Powell;
• Tuesday, December 2, 10:00 a.m. (UTC) — publication of the European Consumer Price Index for November;
• Tuesday, December 2, 15:00 (UTC) — publication of the number of open vacancies in the labor market (JOLTS) USA for September;
• Wednesday, December 3, 13:15 (UTC) — publication of changes in the number of people employed in the US non-agricultural sector in November;
• Wednesday, December 3, 14:45 (UTC) — publication of the index of business activity in the US services sector for November;
• Wednesday, December 3, 15:00 (UTC) — publication of the index of business activity and the index of prices in the non-manufacturing sector of the USA for November;
• Thursday, December 4, 13:30 (UTC) — publication of the number of initial applications for US unemployment benefits for the week;
Friday, December 5, 15:00 (UTC) — publication of the basic price index of US personal consumption expenditures for September.
*This post is not financial recommendation. Make decisions based on your own experience.
#analytics

BTC: Continue Going LongAfter testing the resistance level of 92K, BTC declined again to build up momentum, waiting for the next upward movement. As I have mentioned multiple times, levels below 90K are suitable buying opportunities, and today we continue to go long on BTC.
BTC Trading Strategy for Today:
BTCUSDT buy@86000-87000
TP:90000-92000
All signals for consecutive long positions have been profitable. I will continue to send accurate signals at the opening of the market every day—don’t miss out.

BTC vs QQQWhy the BTC dump? Nasdaq future gapped down, then BTC dumped with high volume 30 minutes later.
Now the day BTC is highly correlated with tech stocks, especially on the down side.


Bitcoin prediction 2022,End of Feb we expect market reversal The end of February we expect reversal of down trend market movement(Head and shoulder reversal pattern expected) after series of down fall from $69K ATH(All time high). Follow the chart clearly to learn what i saw before market reversal.

Bitcoin to hit $32K($32000) level Feb 2022Bitcoin is expected to reach $32,000 level to finishing Head and shoulder pattern .

Bitcoin prediction 2022, BTC Temporary pullback to $36,000 Bitcoin temporary pullback to $36,000 level or beyond if sellers dominate.


BTCUSD Prediction November 2025I,m on buy position on BTCUSD since it hit support,opened a day with bullish bias ,Volume tool support it too .

Bearish on BTCBTC next target 75k-73k
Today is the close of November and its Red so the DEC will be Also Red with target maybe till 69k previous TOP
BTC USDT continuationThis is a new setup and possibility in conjunction with the previous one that might be of help to some, please leave comments and ideas!!!! Best of luck to all

Possible Long sclapPossible Long scalp trade on BTCUSDT in the immediate short term, wait for entry level to confirm firs before enter

BTC Quick Outlook 2026As long as Bitcoin trades below 100K, downside pressure dominates. There’s roughly a 55% chance of dropping to 78–76K and about a 30% chance of a deeper fall to 70–66K. If these drops occur, the typical rebound target is 92–100K, and only a solid daily close above 100K opens the path toward 108–112K and potentially 116–124K. If price climbs without a deeper correction, the realistic ceiling remains 108–112K, with a stronger scenario reaching 116–124K.

BTCBTC is in an important resistance area if the resistance area at 94 is broken but I would prefer it to go past 97 to be safer and I think it will go up to test the area 109...110 for the moment. After that we have an important resistance area at 117.....119 .// if it breaks this area I think we will have a historical maximum

Bitcoin prediction 2025-NovBitcoin price has a motive to buy and it's now retraced to a bullish order block as way of correcting price with same Bullish bias from earlier trade call.
