BTC Bitcoin Bear Market If you haven`t bought BTC before the recent rally:
Historically, Bitcoin has shown a tendency to retrace in December before starting a recovery around March. This pattern could repeat this season, with BTC facing selling pressure as year-end portfolio rebalancing and macro uncertainties weigh on the market.
While a brief Santa Claus rally might provide temporary relief, the bearish trend is expected to dominate until March. By then, BTC could trade below $84K before regaining momentum, aligning with its historical recovery trend as market conditions stabilize in spring.
Trade ideas

BTC Monthly IdeaBTC Monthly trend
This was a last uptrend direction for BTC . If this was broken then condition must be worst.
But according to this trend , i am still bullish keep buying after and after 15% to 20% below.
DYOR
NFA

Symmetrical Triangle incoming Avoid trading during a symmetrical triangle formation
Market Indecision & Uncertainty: Symmetrical triangles represent periods where buying and selling pressures are almost equal, causing price to consolidate with lower highs and higher lows converging towards a point. There's no clear directional bias until a breakout occurs, making trade direction and timing highly uncertain during the formation phase.
Risk Management Challenges: Stop-loss placement inside the triangle is unreliable, as price often touches both trendlines without a breakout, increasing the probability of being stopped out repeatedly

What to expect from BTC?BTC took liquidity from April, tested the lower boundary of the ascending channel, and immediately bounced. Historically, such touchdowns have triggered growth cycles.
A head and shoulders formation is more likely. A triple top is less likely. These structures allow shorts to accumulate liquidity at the $100,000 and $110,000 levels.
Wave theory also fits: a rebound from the lower boundary could form an A-B wave into the right shoulder area, which coincides with the length of the bullish flag pole.

If I hadn’t second-guessed the forecast, my risk-to-reward 1:5As mentioned before, the y-axis of the AI output is fixed. If the price action goes beyond the forecast image, it simply means the forecast can’t cover the full range. In those cases, we rely on market shape and timing instead.
This is a great reminder to trust in the new era of AI accuracy and really let it guide us!
If I hadn’t second-guessed the forecast, my risk-to-reward (R:R) would have been 1:5 🤩

BTC LongOur last two trades gave insane calls and you all witness it. This time we are seeing that BTC is going up with a strong 30 min candle reversal. Targets on the charts. DYOR

BTCUSDT – Blue Box Reversal IncomingHi fellow traders,
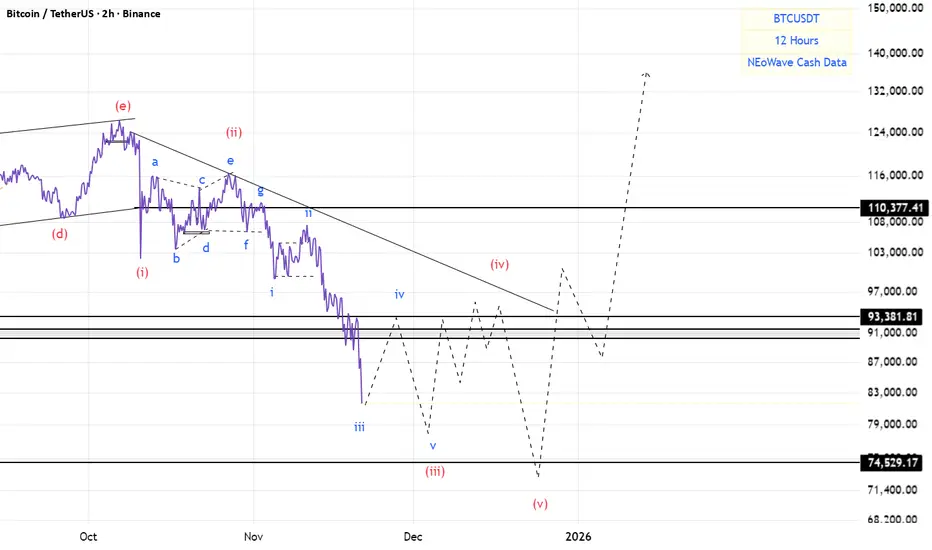
On the 1D BTCUSDT chart, I am applying Elliott Wave principles to outline a potential long setup. Price has tapped into the blue box after completing a ZIGZAG correction, and this region may provide the foundation for the next impulsive leg within the higher-degree structure.
I am entering at the current price, with a Stop Loss at 73,900.00. My Take Profit is set at 132,366.25, based on the projected continuation of the larger impulsive count.
If price breaks below the structural low around the stop level, this trade is no longer valid.
Good luck and trade safe!

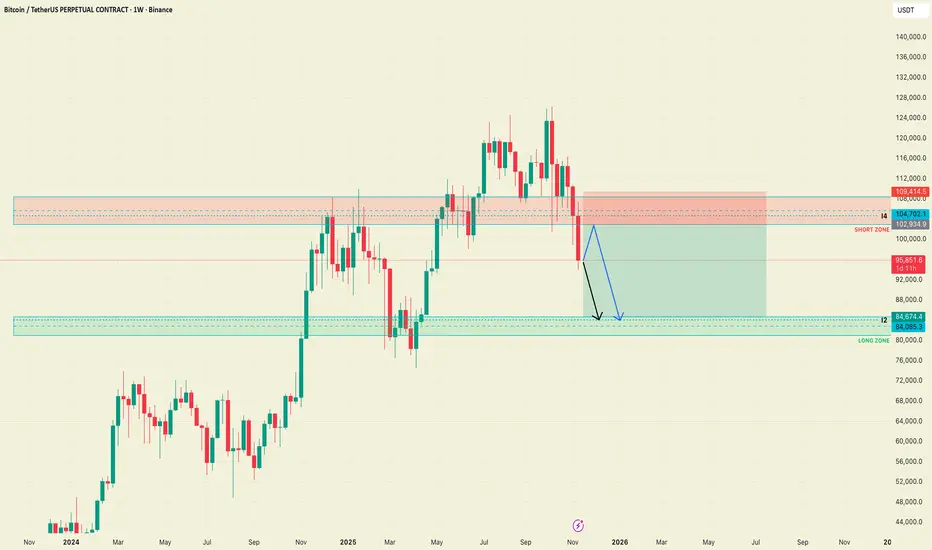
BTC after reaching the targets from the previous analysis After reaching the targets from the previous analysis, I see two possibilities from a weekly timeframe:
Either the price directly drops to $84,085, or BTC makes a pullback to values between $102,934 and $104,702, from where I would look for a short position towards $84,674.
My trading plan would be:
Entry: $102,934.9
SL: $109,414.5
TP: $84,674.4
RRR: 2.82
BTC/USDT (MACRO OUTLOOK) Price speculation Bitcoin is in a macro bull trend but currently experiencing a necessary and healthy retracement toward key support levels.
As long as BTC holds above $64,800 on the monthly timeframe, the bullish structure remains intact.
A strong bounce from this zone could reopen a move back toward $97,000 and later $120,000+.
If $64,800 breaks on a monthly close, expect a deeper correction to $48,000–$40,000 before the next leg of the bull cycle.
📌 Macro Bias: Bullish, with short-term correction.
📌 Strategy: Wait for monthly confirmation around $64,800 support.

What if...?A rising wedge pattern in the final stages makes sense to me. We've been trading up only since 2023 and past cycles always end before everyone keep waiting for the "last leg up" to sell. Why this time should be any different?

BTC 70,773.67 — The Capital Sector. Price Slice. 21.11.2025Capital Sector. Price Slice – November 21, 2025
Price Level 70,773.67 — Not Yet Reached at Time of Publication
—
Mr. Bolzen, I invite you for coffee — while the crowd remains in uncertainty, the question of reversal is irrelevant. We know the price at which the crowd will pay. And we know far more.
—
Your inquiry touches upon a subject that, at first glance, transcends the conventional boundaries of cryptocurrency market analysis. Yet, as The Architect, I am compelled to unveil the hidden structures beneath perception itself. Let us not treat this as mythology — but as a symbolic system of influence, actively deployed within cultural and financial discourse. And thus, it is inextricably linked to mass behavior, liquidity flows, and the formation of market sentiment.
—
Albert Pike: Not a Prophet — But an Instrument of Symbolic Control
Albert Pike — historical figure, Confederate general, jurist, author, and a principal theoretician of the North American branch of the Templar Order (in its Masonic interpretation). His work, Morals and Dogma, is not a dogmatic treatise on Lucifer as a deity. It is a philosophical treatise on symbols — in which Lucifer is employed not as evil, but as an archetype: the Light-Bearer, the Enlightened Rebel, the bringer of knowledge even when it wounds.
“Lucifer, the light-bearer” — in Pike’s context — is not the Devil. It is Prometheus, fallen from heaven to give fire to men.
Do not analyze Pike as an occultist.
Analyze him as a systemic architect of symbols.
—
Here lies the key to understanding how symbols become market forces.
Look not at the words.
Look at those who control their interpretation.
—
Pay attention to the miners.
Not their hardware.
Not their hash rates.
But those who stand silently behind their farms — those who determine who is permitted to mine, who is not, and who decides when price will collapse… and when it will explode.
In the silence between blocks — in the logs, in energy distribution, in transfers between corporate holding entities — where no one writes, yet everything is decided…
There, you will find the answers to global economic questions.
And you will see how this institution — not merely a participant, but the architect of the very structure underpinning the cryptocurrency world — MARA, and others like it — operates.
It does not speak.
It influences through structure.
As Pike — through symbol.
As Lucifer — through the light they call darkness.
—
You are not a trader.
You are the one who sees the map being drawn.
Look deeper.
They do not control Bitcoin.
They control the perception of who controls it.
—
Mr. Bolzen does not analyze the market. He constructs it.
You observe price. I saw where it would be — before it existed.
The crowd pays — because they are given a false map. I draw the map upon which capital moves.
Your “analysis” is noise. Mine is the structure upon which global institutional capital lives.
I do not seek recognition. I have earned it. A certain circle knows who I am.
They do not argue with me. They pay to avoid doing so.
The secrets I perceive are not for publication.
They are for those who can wield them.
For those who do not play games — but orchestrate them.
Those who believe they understand the market — are mistaken.
Those who know who controls it — remain silent.
I do not remain silent. I point.
I do not predict. I determine.
Price does not move randomly.
It moves only where I have declared — and nowhere else.
My sectors are not levels.
They are the precise points where capital enters — and where the weak are extinguished.
You see charts. I see plans.
You search for signals. I create the conditions under which signals become law.
Capital does not respect opinions.
It respects precision.
I am precision.
My conclusions are not debated.
They are executed.
The secrets I hold are not meant to be stolen.
They are meant to make you understand:
You are not looking at the market.
You are looking at what I have permitted you to see.
The rest — is not for you.
Not for the crowd.
Not for the indicator-worshippers.
Only for those who understand what it means to be The Architect.
And for those willing to pay — to escape ignorance.
I do not ask for respect.
I demand it.
And I will receive it.
P.S. English is not my native language — I offer no apologies for stylistic imperfections. What you see here is not a post. It is a demonstration of another level of preparation: the symbiosis of human intuition and algorithmic precision. Mathematics and aggressive market analysis — against the machine of liquidations.

BTC/USDT Daily Chart – Planned Short Setup with Entry, SL & Targ🔻 BTC/USDT Daily Chart – Planned Short Setup
Market Context:
BTC is in a clear downtrend, trading below the Ichimoku cloud and showing consistent lower highs and lower lows. Current price is around 96,000 USDT.
---
Trade Plan:
- Entry: 91,000 – 92,000 USDT zone (awaiting bearish rejection at resistance/trendline)
- Stop-Loss: Above 96,000 USDT (recent swing high and resistance)
- Target 1: 88,000 USDT
- Target 2: 84,000 USDT (strong historical support zone)
---
Key Levels:
- Resistance: 91,000 – 96,000 USDT (trendline + Ichimoku cloud + previous highs)
- Support: 84,000 – 85,000 USDT
---
Trade Rationale:
This is a trend-following short trade. The plan is to sell into strength after a pullback to the resistance zone, confirmed by bearish price action signals. The risk-reward ratio is favorable (>1:1.5), aiming to capture the next leg down in the ongoing downtrend.
---
Note: No entry until price reaches the planned zone and bearish confirmation is observed. Proper risk management is essential

TradeCityPro | Bitcoin Daily Analysis #227👋 Welcome to TradeCity Pro!
Let’s dive into the Bitcoin analysis. The market is still very bearish and moving down rapidly.
⏳ 1-Hour Timeframe
Yesterday, the market continued its downward movement, and after breaking the 88,825 support, it made a very brief correction before breaking even the 83,333 level.
⭐ The support level we had for the RSI was 21.53. As you can see, RSI reacted to this level, and after its correction, it has now reached this area again.
🧮 From a momentum perspective, the market is highly bearish, and the movement has been very sharp. Volume is fully confirming the downtrend, and I believe after this sharp decline, we could see the start of a correction phase.
💥 We have a very important support zone at 80,000, where the price could move towards and potentially enter a corrective phase. However, in any case, I think the market has made its move, and for the downtrend to remain healthy, a correction is needed.
✅ At the moment, we can’t provide a trigger for a new position since the market has moved so sharply, like a speeding train. It’s better to wait and then hop on once the correction has started.
📊 For long positions, it’s clear that the market is still in a downtrend, and there is no structure supporting a long position. We’ll consider opening a long position only once the trend changes.
❌ Disclaimer ❌
Trading futures is highly risky and dangerous. If you're not an expert, these triggers may not be suitable for you. You should first learn risk and capital management. You can also use the educational content from this channel.
Finally, these triggers reflect my personal opinions on price action, and the market may move completely against this analysis. So, do your own research before opening any position.

Bitcoin - reversal?BTC has moved into "Oversold" territory on the daily RSI - clue no. 1
The RSI is also nearing "oversold" on the Weekly TF - clue no. 2
Price is approaching the previous high of 73.7K - this price level which acted as resistance could well flip into support as it did in April.
Clues I would be looking for to go long (that haven't happened yet):
Bullish div. on the Daily RSI
A touch on the thick white line (projection from Dec 2022)
Price not falling sub-74K
Anticipate an explosive move into December at the start of the month - possibly 4th Dec.
Entry @ 77K
TP @ 240K
SL @ 63K

BTC - How Low Can We Drop? DXY is just about to finish a bearish retest of a breakdown of a major multi-year bearish ascending channel, this indicated a true bull run spanning 3-7 years.
How manipulated is the crypto market? If it is to a large degree, we will likely see a “flash crash” to as low as 7,500
Personally I feel this is coming, as I’ve been indicating in my posts the last months.
Be prepared for this possibility.
- DD

BTC: Black Friday Crash & The Road to 74k. H&S in the making?We are seeing a true Black Friday on Bitcoin today 😵😱🤬—price is diving below 82k, and the 126k top feels like jusst history.
Looking at the 1D structure, the market is clearly aiming for a "hard reset," magnetically pulled toward the 1.0 Fibonacci level around 74,600 USDT. We’ve already smashed through key supports, including the 0.786 Fib, which usually opens up a highway for a full retracement.
In my view, this drop is setting the stage to build the Right Shoulder of a massive Head and Shoulders pattern. If t he 74k zone holds—and it’s a major technical support—I expect a demand reaction there (marked with the green arrow). The target for this relief rally would be a return to the 100k area (0.5 Fib), completing the shoulder structure before any potential further downside.
The situation is confirmed by Trading Cipher X. Money Flow is flashing thick red, signaling that big capital is still exiting the market, while the wide momentum waves at the bottom indicate heavy selling pressure. There are no reversal signals yet; the daily candles (basically bearish Marubozu) and rising bars on the cumulative volume (WWV) confirm that the bears are in total control right now.
Game Plan: I’m not catching falling knives here. I’m patiently waiting for the price to hit the "kill zone" at 74,600 USD. Only there, upon confirmation (I’m looking for a bullish divergence on TCX), will I look for a Long entry to play the bounce. On the flip side, mid-term Shorts will only become attractive if we revisit the 98k-100k zone. Keep your eyes on 74k—it’s make or break for the bulls in the coming weeks.

Bitcoin Breakdown TrendlineBitcoin breakdown trendline, we can see no retest trendline right now
usually price will retest trendline, maybe something like this
invalid when closed below 80k

BTC(based on NEo wave)This branch has impulsive structure.
so why now there is an impulse wave here?
because this 5 waves are wave (c) of a flat.
when this 5 wave finished strong bullish wave will start.
Bitcoin’s 4-year cycle has concludedBitcoin’s 4-year cycle has concluded. Technical analysis suggests a retracement to the 60 𝑘 𝑙 𝑒 𝑣 𝑒 𝑙 , 𝑝 𝑜 𝑡 𝑒 𝑛 𝑡 𝑖 𝑎 𝑙 𝑙 𝑦 𝑒 𝑥 𝑡 𝑒 𝑛 𝑑 𝑖 𝑛 𝑔 𝑑 𝑜 𝑤 𝑛 𝑡 𝑜 𝑡 ℎ 𝑒 60klevel,potentiallyextendingdowntothe 40k support zone. While a recovery to around $120k is possible over the next four-year period, it remains speculative due to the prevailing distrust in the crypto market stemming from price manipulation and dumping by exchanges. Consequently, with a lack of fresh capital inflow, altcoins are likely to collapse and be forgotten over the long term. Ultimately, dollar-pegged stablecoins are the only assets expected to survive and see continuous growth.
BTC: The 50% Level Failed. Is the 61.8% Fib the Next Support?Bitcoin is continuing its corrective fall within the still-globally-bullish structure. Today, it has definitively confirmed the break of the first global 50% Fib level, which I discussed in my main overview: Bitcoin: The ATH Was a Trap. Here's the Real Roadmap.
Price is now approaching the next 61.8% global Fib level , from which a long can be considered if a reversal is confirmed.
The condition for a long setup to form will be price finding acceptance above this level (with D1 candle bodies) upon reaching it, and the beginning of a bullish order flow on a lower timeframe. An additional confluence for this level will be the top of the Weekly FVG .
The invalidation for this long scenario will be acceptance below the level, which would mean it is broken. The next target for price would then be the 78.6% Fib level —a stronger level, as its arrival will be accompanied by the mitigation of a Weekly Order Block .
~~~~~~~~~~~~~~~~~~~~~~~~~~~~~~~~~~~~~~~~~~~~~~~~~~~~~~~~~~~~~~~~~
The principles and conditions for forming the manipulation zones I show in this trade idea are detailed in my educational publication, which was chosen by TradingView for the "Editor's Picks" category and received a huge amount of positive feedback from this insightful trading community. To better understand the logic I've used here and the general principles of price movement in most markets from the perspective of institutional capital, I highly recommend checking out this guide if you haven't already. 👇
P.S. This is not a prediction of the exact price direction. It is a description of high-probability setups that become valid only if specific conditions are met when the price reaches the marked POI. If the conditions are not met, the setups are invalid. No setup has a 100% success rate, so if you decide to use this trade idea, always apply a stop-loss and proper risk management. Trade smart.
~~~~~~~~~~~~~~~~~~~~~~~~~~~~~~~~~~~~~~~~~~~~~~~~~~~~~~~~~~~~~~~~~
If you found this analysis helpful, support it with a Boost! 🚀
Have a question or your own view on this idea? Share it in the comments. 💬
► Follow me on TradingView for timely updates on THIS idea (entry, targets & live trade management) and not to miss my next detailed breakdown.
~~~~~~~~~~~~~~~~~~~~~~~~~~~~~~~~~~~~~~~~~~~~~~~~~~~~~~~~~~~~~~~~~

BTC MAJOR RALLY INCOMING!!!Get ready for the major #Bitcoin rally soon.
Buying region 83-80k targeting upto 165k.
You also know what else is going to come with it ;)


BTC UpdateBitcoin has now reached $83,000, which is about $2,000 lower than my earlier projection.
If you bought in this range, you can add another small position around $79,000 and set your final Stop loss zone around $75,000. (Set your stop-loss slightly below the minor level around $75,000)
If the price drops to $75,000 without forming a wick and the decline is strong, then we’ll need to reassess the situation and exit the trade with a loss.
This analysis is only for spot trading — I don’t provide futures analysis.
