BITCOIN → The hunt for liquidity before the fallBINANCE:BTCUSDT.P continues to update lows within the global downtrend. The retest of 91K confirmed the dominance of bears...
The downtrend continues. The technical and fundamental situation for the crypto market is neutral to weak.
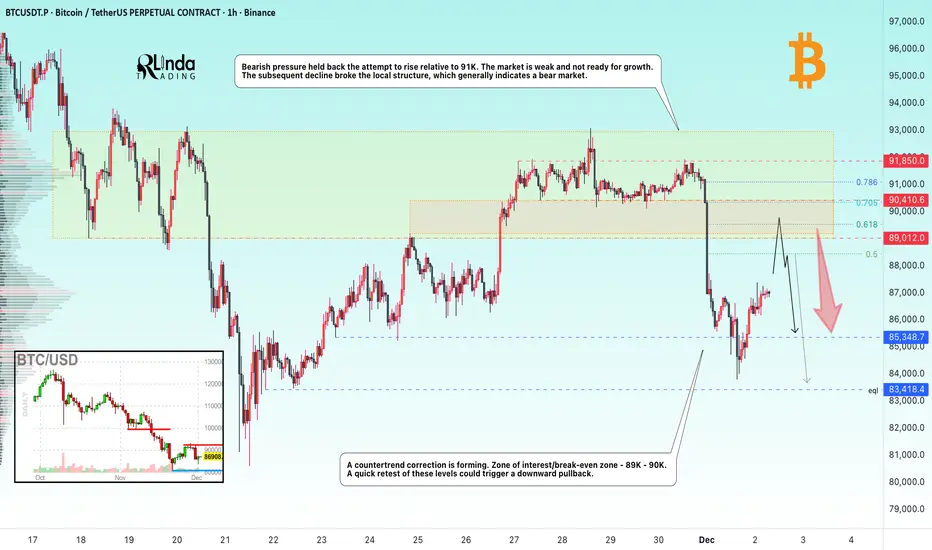
Bearish pressure held back the attempt to rise relative to 91K. The market is weak and not ready for growth. The subsequent decline broke the local structure, which generally indicates a bear market, but after updating the local minimum to 83700, a countertrend correction is forming. Zone of interest/break-even zone - 89K - 90K. A quick retest of these levels could trigger a downward pullback.
Resistance levels: 89K, 90K
Support levels: 85,400, 83,400
A retest of the range boundary and zone of interest could trigger a liquidity squeeze and a further decline if the bears keep the price below these boundaries.
Best regards, R. Linda!
Trade ideas
The Most Underrated Skill: Reading the Market Without Bias!Most traders focus on indicators, patterns, and strategies…
But very few focus on the skill that actually moves the needle:
Learning to read the market without forcing your bias onto the chart.
Here’s the truth 👇
When you zoom out and remove the noise, the market is always telling one of only three stories:
📘 1. Impulse → Market is moving with strength
An impulse leg is a clear, strong movement in one direction.
Candles are decisive. Pullbacks are shallow. Speed is visible.
When you identify an impulse, the message is simple:
“Don’t fight me, follow me.”
This is where continuation trades thrive.
📔 2. Correction → Market is taking a breath
A correction is messy, slow, overlapping price action.
The market is not reversing; it’s reloading.
Most beginners confuse corrections with trend reversals… Professionals don’t.
The key question becomes: “Where will this correction end?”
Because that’s where the next impulse usually begins.
📕 3. Reversal → Structure shifts, and momentum dies
A reversal is structural.
You see new lower lows in an uptrend, or new higher highs in a downtrend.
Momentum slows. Failed impulses appear. Trendlines break.
A true reversal is never a single candle; It’s a story told over multiple chapters.
🔑 The Skill: Listening Instead of Predicting
Most traders lose because they try to predict what comes next.
Professionals focus on reading what’s happening now.
Ask these questions every time you open a chart:
- Is momentum increasing or decreasing?
- Are corrections getting deeper or shallower?
- Is structure still intact?
- Which key level holds all the power?
Master these, and you’ll start seeing the market in HD.
💡 Why This Matters
Your entries, exits, and risk management improve automatically when you can answer one simple question:
“Is the market impulsive, corrective, or reversing?”
This removes emotional trading, kills hesitation, and builds confidence, because you’re no longer guessing... You're listening.
🤔 Final Thought
Strategies don’t fail because they’re bad.
Strategies fail because traders apply them at the wrong time.
Read the market first. Trade second.
⚠️ Disclaimer: This is not financial advice. Always do your own research and manage risk properly.
📚 Stick to your trading plan regarding entries, risk, and management.
Good luck! 🍀
All Strategies Are Good; If Managed Properly!
~Richard Nasr

BTCUSDT – Major Distribution Zone Detected! Potential Drop Ahead📉 BTCUSDT – Distribution Completed, Correction Likely
1️⃣ Previous Range Accumulation (Left Zone)
Price moved sideways in a tight consolidation box.
After holding for some time, BTC broke down sharply, showing clear supply pressure.
---
2️⃣ Strong Recovery Rally (Middle Zone)
After the breakdown, price created a bullish accumulation zone.
A strong impulsive move up followed — this is a classic liquidity grab + reversal.
The diagonal trendline shows the momentum slope of the recovery.
---
3️⃣ Current Market Structure (Right Zone)
Price is currently inside another consolidation box, similar to the first range.
This suggests distribution, not accumulation.
Momentum is weakening near 93,000–94,000, with repeated rejections.
---
4️⃣ Expected Move (Bearish)
Your drawn projection is correct:
After sideways movement, BTC is likely to break down from this range.
Target region shown (~91,000 zone) makes sense because it aligns with:
Previous support
Unfilled imbalance
Ichimoku lower cloud support
---
5️⃣ Key Levels
Resistance: 93,800 – 94,200
Support: 92,000 → 91,000
Break Confirmation: Closing below 92,200
Bearish target: 91,000 – 90,800
---
🔍 Summary
BTC is forming a distribution zone after an overextended move. Market shows signs of exhaustion.
Unless BTC breaks above 94,200, the probability favors a move down toward 91,000.

Bitcoin (BTC): Seeing Bullish Signs | Need To Re-Claim 100 EMAThe 100 EMA has been tested multiple times on BTC, yet buyers did not manage to fully secure this area. What we see is a continuation of attempts to break this zone completely and secure it, and as buyers are showing volume, we are looking for it to happen.
Setup looks decent; the zone of liquidity is our stop zone, where the major target is the 200 EMA as of now!
Swallow Academy

BTC/USDT 4HOUR CHART UPDATE !!BTCUSDT is consolidating within an ascending channel after a sharp bounce from lower levels, and the price is currently retracing towards mid-channel support around 88,000–87,000 USDT.
The lower boundary of the channel and horizontal levels at 88,000, 87,013, and 84,584 act as step-down support; as long as candles remain above around 84,500, this will remain a healthy corrective pullback in the short-term uptrend.
Below that, key higher-timeframe supports near 80,550, and 76,200 are the next demand zones where a deeper flush could still maintain the larger bullish structure.
The price drops towards the lower channel area, finds support, and then rotates higher for another leg up, with the green zone around 94,000–95,000 being the first major resistance on the way back towards the large grey supply above 100,000.
DYOR | NFA

Funds Are Coming Back – Will BTC Surge?Hello traders, wishing you a great day! Let’s take a look at BTCUSDT together.
If we had to name one asset that is recovering after a storm and starting to attract capital again, Bitcoin is definitely the leading candidate right now. Expectations that the Fed will soon cut interest rates are bringing risk appetite back , the USD is cooling down, and part of the capital flow is returning to crypto – therefore BTC has a solid chance to recover after the sharp drop at the end of November.
On the 12H chart, BTC remains inside a downward channel , but is moving steadily above the short-term support around 85,700, which is marked as Immediate support . The current pullback is mainly a pause to regain momentum after the first rebound, without breaking the latest lows , and is showing signs of forming a higher low.
If price continues to hold above 85,700 and forms an accumulation pattern as projected, the resistance zone 93,900 near the upper boundary of the channel and the Ichimoku cloud will be the next natural target.
Given that macro news is gradually supporting risk assets and technical signals show weakening selling pressure, I personally prefer the scenario where BTC continues to recover toward 93–94k , rather than breaking support immediately.

BTC Weekly Analysis – Major Bearish Setup Forming?#BTC has broken below the key trendline and continues to hold in a bearish structure. On the weekly timeframe, the price action is showing a potential Head & Shoulders formation, and what makes this pattern even more significant is the strong bearish divergence appearing on the head of the structure.
This combination of trendline break + bearish market structure + divergence strengthens the probability of a larger downside move.
However, patience is key.
Before taking any short position, I will wait for:
Completion of the right shoulder
A clear break below the neckline
A clean retest of the neckline to confirm bearish continuation
Only then will I look for a short entry with strict risk management and clear invalidation levels.
If this setup plays out, #BTC could deliver a high-probability move on the weekly chart. Watching this closely.
If you find this analysis helpful, hit LIKE and drop your thoughts in the comments. Follow for more advanced #BTC setups, market structure breakdowns, and confluence-based trading ideas!
#BTC #Bitcoin #Crypto #TradingView #CryptoAnalysis #HeadAndShoulders #BearishDivergence #PriceAction #TrendlineBreak #WeeklyTimeframe #CryptoTrader #RiskManagement #BTCAnalysis #CryptoSetup

$BTC/USDT ANALYSISBitcoin on the 8-hour chart is consolidating within an ascending triangle formation, showing clear higher-low structure support near the rising trendline. The price is currently trading below both the 50-period moving average and the Ichimoku Cloud, which are acting as strong dynamic resistance levels. The highlighted red zone around 92,000–93,500 USDT represents a heavy supply area where previous rejections occurred.
As long as Bitcoin holds above the ascending trendline support near 86,000–86,500 USDT, the structure remains intact, suggesting buyers are still defending this zone. A clear breakout above the 50 MA and the 92,000 USDT resistance region would confirm a bullish continuation toward 95,000 USDT and beyond. However, failure to hold the rising support trendline could trigger a short-term correction toward 84,000 USDT before any recovery attempt.

$BTC/USDT ANALYSISOn the 2-hour chart, BINANCE:BTCUSD is still trading inside a wide consolidation range, but the overall structure shows a slow upward trend supported by the rising diagonal trendline below the price. Every time BTC has dipped toward that ascending line, buyers have stepped in and pushed it back up, which means the market is still respecting bullish pressure from the bottom. On the upside, the main problem remains the heavy supply zone around 93,500 to 94,500, where price has repeatedly rejected and failed to break through. Each attempt into that zone has triggered selling and pulled the market back down, showing that sellers are still defending this level strongly. At the moment, price is sitting near the mid-range, recovering after a sharp drop, but it has not shown any clean breakout or breakdown yet. As long as the ascending support trendline holds, the market stays in a slow bullish structure, but unless BTC breaks above the 94,500 zone with strength, the chart will continue to move sideways between support and resistance.

BITCOIN SIGNAL: THIS IS WHERE THE CRASH WILL STOP!!!? (watchout)Yello Paradisers! Enjoy the video!
We are discussing a lot of technical stuff—Elliott Wave theory. We are going through multiple time frames, and I'm updating you about the price action, development structure, and important levels, as well as what the highest probability next move is.
And Paradisers! Keep in mind to trade only with a proper professional trading strategy. Wait for confirmations. Play with tactics. This is the only way you can be long-term profitable.
Remember, don’t trade without confirmations. Wait for them before creating a trade. Be disciplined, patient, and emotionally controlled. Only trade the highest probability setups with the greatest risk to reward ratio. This will ensure that you become a long-term profitable professional trader.
Don't be a gambler. Don't try to get rich quick. Make sure that your trading is professionally based on proper strategies and trade tactics.

#BTC/USDT is currently strongly bullish#BTC
The price is moving in a descending channel on the 1-hour timeframe. It has reached the lower boundary and is heading towards a breakout, with a retest of the upper boundary expected.
We are seeing a bearish trend in the Relative Strength Index (RSI), which has reached near the lower boundary, and an upward bounce is expected.
There is a key support zone in green at 88200, and the price has bounced from this level several times. Another bounce is expected.
We are seeing a trend towards stabilizing above the 100-period moving average, which we are approaching, supporting the upward trend.
Entry Price: 88900
First Target: 90000
Second Target: 91123
Third Target: 92300
Remember a simple principle: Money Management.
Place your stop-loss order below the green support zone.
For any questions, please leave a comment.
Thank you.

Is this the calm before the Bitcoin storm?Is this the calm before the Bitcoin storm?
I think if Bitcoin fails to break above $90,500, it will most likely see a major drop in the coming hours. This is my personal opinion.

BTC updates📌 Bitcoin Technical Analysis
🔻 Support Levels:
• 90,850 – First key support; holding above this level keeps short-term bullish structure intact.
• 88,650 – Major support; a breakdown could increase selling pressure.
• 85,907 – Strong support zone; losing this level would significantly weaken the bullish trend.
🔺 Short-Term Resistance:
• 93,539 – Immediate resistance; a breakout above this level may open the way for higher targets.

If 89220 is not touched,a scenario of a rise to 108k is possibleThere are two supports at the 89220 point that should be used in lower declines. Touching this value indicates further declines and failure to reach this price again confirms the upward process.

correct for 3 weeks straight! LETS GOTime after time, I am calling the market weeks ahead of time
This is what it looks like to master the art of Gann
Before this forecast, I called the market 5 weeks ahead of time with unmatched accuracy...
And here we are again, Gann methods being correct for 3 weeks straight! LETS GO!!

$BTC/USDT ANALYSISBitcoin is moving inside a symmetrical triangle on the 8-hour chart and the price is sitting near the middle of the range, trading below the 50MA which is acting as a resistance zone on top. Bulls are defending the lower trendline while sellers are active near the upper trendline, creating a squeeze where volatility is slowly reducing. If price holds above support, it may continue to move sideways inside the triangle, but a strong candle above the 50MA and triangle top would show strength, while a drop toward the ascending support would show weakness. Right now market is neutral and waiting for a clear break from this pattern, so upcoming moves around these trendlines will decide the next direction.

max longin BTC hereMax longing BTC here, houghts?
Price is sitting on a strong support zone with clear signs of seller exhaustion. As long as this level holds, the long setup offers a solid risk-reward. A reclaim of nearby resistance could trigger continuation upward, while a break below invalidates the idea. Open to hearing everyone’s view.

btc live tradeHello friends
Given the sharp upward movement we had, you can see that the sellers have made a high, which increases the possibility of a price correction, and we can witness a price increase in the price correction until the specified targets are reached.
This analysis is purely from a technical perspective and is not a buy or sell recommendation, so please observe risk and capital management.
*Trade safely with us*

BTCCRYPTOCAP:BTC is retracing toward support, a level that has produced strong reactions before. As long as this zone holds, the base case remains a continuation leg and a breakout from the current range. Structure is still intact.

BTC/USDT: Bulls Defend 89K as Price Eyes 96K ResistanceBTCUSDT is holding firm above its ascending trendline after defending the 89,000 support zone, preserving the broader bullish structure. The recent dip swept short-term liquidity before buyers re-entered, signaling a corrective move rather than a full reversal.
As long as price stays above 89,000, BTC has room to climb toward the 96,000 resistance zone near the weekly high. Continued higher lows and trendline respect favor upside, with consolidation phases adding strength to the bullish case.
➡️ Primary scenario: higher lows hold → continuation toward 96,000 resistance area.
❗️ Risk scenario: a break below 89,000 would invalidate the bullish setup and shift focus toward deeper support zones.

BTCUSDT.P - December 10, 2025Price is pulling back from a sharp spike into resistance around 94,400–94,800 and is currently retesting the rising trendline that has defined the recent upswing. A defended higher low above this trendline and a push back through 92,900–93,000 would keep the short-term uptrend intact and favor continuation toward the prior highs. A clean break below the trendline with follow-through toward 90,300–90,100 would signal weakening momentum and raise the risk of a deeper correction toward the prior consolidation lows.

BTCUSDT.P - December 12, 2025The market is in a short‑term downtrend, with price rejecting the recent spike into resistance near 92,600–92,900, where the short entry is positioned. The stop region around 94,500 caps the prior swing high and defines the invalidation level for this bearish structure. As long as price holds below resistance and momentum stays weak, the path of least resistance favors a move back toward the 90,000 support area and potentially the lower band near 89,300.

FED RATE CUT idea - bull trapA head-and-shoulders setup suggesting a potential Fed rate cut on December 10, followed by a fake-out (bull trap).
