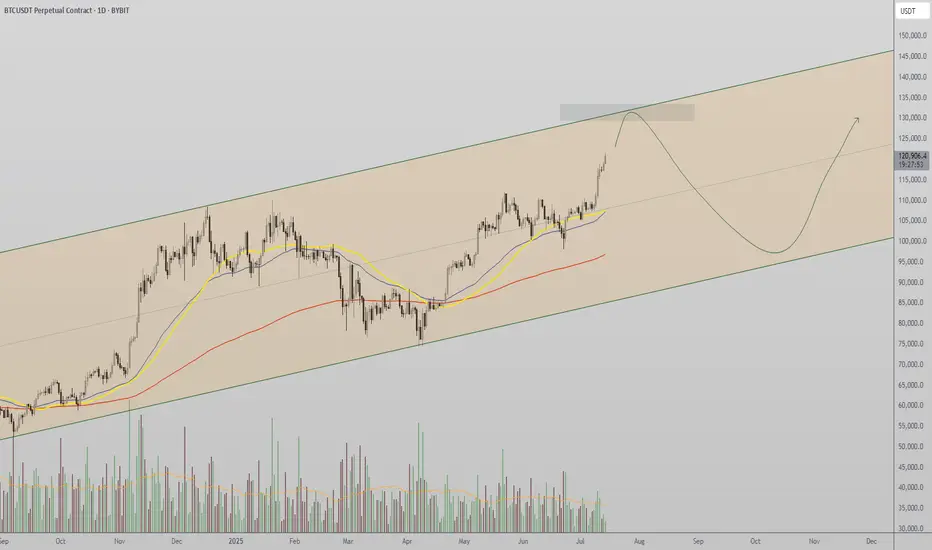
Bitcoin - Will hit 135k in the short-term, Elliott and FIBOBitcoin is rising! That's what everyone sees at the moment, but we don't want to get drunk and establish our profit target. Where to take profit? Because we are in the price discovery mode, there is no previous price action above the current price. At this moment we really cannot use any horizontal lines, gaps, volume profiles, imbalances, previous ranges, or previous swing highs to establish our profit target. So we have to use special tools, such as Fibonacci extension or Elliott Wave.
The Fibonacci extension is a great tool - in bitcoin's case we have a 1:1 FIB extension sitting at 135,096. This level is also in confluence with a major trendline that we can see on the chart. This gives us a really good profit target in the short term for this particular trade. This is also an opportunity to short Bitcoin here, if you trade futures. From the Elliott Wave perspective, we are in wave (3), so I made a prediction on where this wave should terminate and also where wave (5) should terminate. I think my analysis definitely makes sense! Please share your analysis in the comment section, only copy your link here.
Trading tip at the end: Avoid the Obvious / Market Traps - Some obvious trading situations are kind of a trap where the chances are that everyone else has also spotted a wonderful trade situation which eventually sets you up for a disaster. Many people get trapped in some obvious good looking trades. Some obvious trades can sometimes be the market traps as they are hyped, professional traders stay away from these traps. Write a comment with your altcoin + hit the like button, and I will make an analysis for you in response. Trading is not hard if you have a good coach! This is not a trade setup, as there is no stop-loss or profit target. I share my trades privately. Thank you, and I wish you successful trades!
BTCUSDT.P trade ideas

Drop Your Token – I’ll Do The AnalysisHey everyone! Hope you’re having an amazing weekend !
Want me to analyze your favorite token ? Just drop your request in the comments using this format:
Request Format
Project Name: Bitcoin
Token Symbol: BTC( BINANCE:BTCUSDT )
Important Notes:
I’ll pick and analyze only the first 10 tokens requested .
One request per person — so choose wisely!
I’ll reply directly under your comment with the analysis.
If you find this helpful, don’t forget to Like ❤️ and Share this post with your friends!
Here’s to your success — health, wealth, and great trades! 🚀

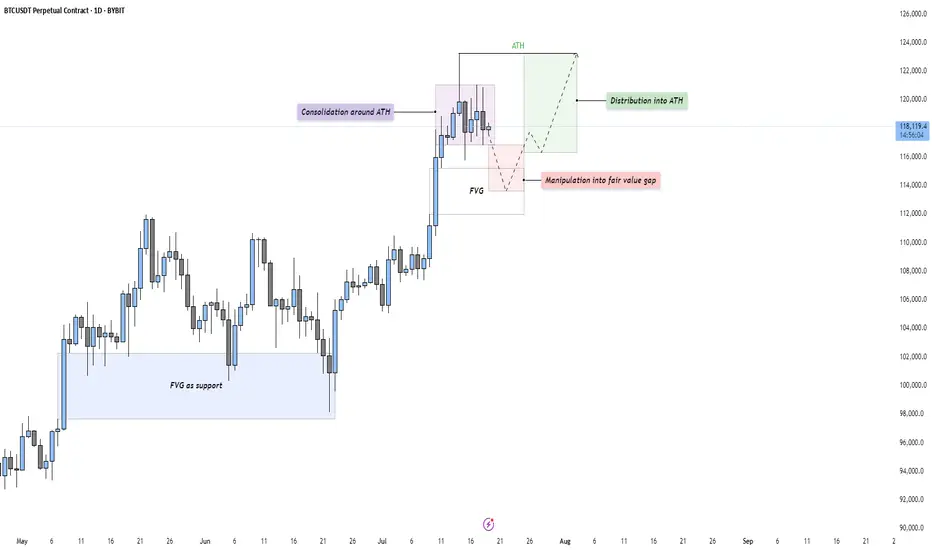
BTC - Consolidation, Manipulation & DistributionMarket Context
After a strong impulsive rally, Bitcoin is currently consolidating just beneath its All-Time High (ATH). This type of consolidation following an extended move higher often indicates indecision in the market — a pause that either leads to continuation or reversal. The current structure suggests that price is building energy for the next leg.
Consolidation and Liquidity Above ATH
The price action is tight and sideways around the ATH, which likely means liquidity is building above. Many stop-losses and breakout orders are sitting just overhead — classic conditions for a Buy Side Liquidity Sweep. This range may serve as a trap for early breakout traders, providing an opportunity for smart money to manipulate price lower before taking it higher.
Fair Value Gap Retest Scenario
Below the current range, we see a Daily Fair Value Gap that aligns with prior bullish imbalances. A move down into this Gap would represent a manipulation phase — shaking out weak longs before rebounding. The Gap also acts as a potential support level where buyers might be waiting. If price reaches into this zone and reacts strongly, it may offer a high-probability long setup.
Distribution or Reaccumulation?
While this could be interpreted as distribution beneath resistance, it’s equally valid to consider it a reaccumulation phase — a temporary markdown into demand before a fresh expansion. If the market dips into the Gap and quickly reclaims the range, it opens the door for a clean breakout above the ATH and continuation toward the 124,000–126,000 region.
Final Thoughts
Price rarely moves in a straight line. It pauses, retraces, and often tricks participants before making the real move. This type of consolidation presents opportunity — but also demands patience and clarity.
If you found this breakdown insightful, a like would be much appreciated! And I’d love to hear your thoughts in the comments — are we about to sweep down into demand, or is the rocket already on the launchpad?
BTCUSDTHello Traders! 👋
What are your thoughts on BITCOIN?
Bitcoin has recently posted a new all-time high and is now undergoing a healthy correction. This pullback is expected to extend toward a key support zone, which aligns with both the previous breakout level and the bottom of the ascending channel.
Once the correction is completed near the channel support / previous high, we anticipate a bullish continuation.
The next leg higher could take Bitcoin toward the upper boundary of the current channel.
As long as price remains above the key support area, the overall structure stays bullish and this correction is likely to be a buy-the-dip opportunity within a broader uptrend.
Will Bitcoin use this pullback as a launchpad for new highs? Share your view in the comments! 🤔👇
Don’t forget to like and share your thoughts in the comments! ❤️

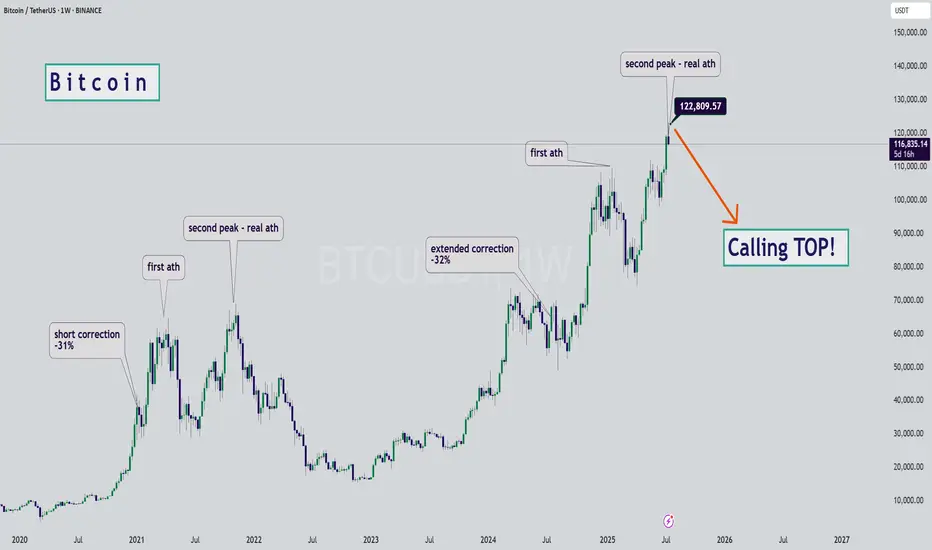
BTC - Calling the Start of the Bearish SeasonHello Watchers ☕
This was my previous Bitcoin update where I had a target of $116K, and also then closed all open positions at $122K:
I'm calling the top here mainly because of the way the chart looks, it really is classic Wyckoff if you look at the duration of the current bullish cycle, which has lasted a whole 973 Days with a 564% increase. What goes up, must come down!
Just for interest sake, the previous bullish cycle ran for 600 days with a 700% increase.
Atomic Pump Exploded, You Missed It! Now What?Ever opened your charts after a few hours off and realized the market just exploded upwards without you?
That feeling of missing out, regret, and mental chaos is real.
But here’s the thing: if you missed the move, what should you do next?
This post is for you the ones who feel like the train left the station, but still want to win the next round.
Hello✌
Spend 3 minutes ⏰ reading this educational material.
🎯 Analytical Insight on Bitcoin :
Volume remains the decisive factor driving BINANCE:BTCUSDT toward higher price levels 📈. Across various scenarios whether it’s market battles, FOMO spikes, institutional capital flows, or extended periods of consolidation volume confirms the strength behind the move. Discussions about Bitcoin as the new global currency continue to fuel interest and momentum. In the short term, I’m targeting $129,000 for Bitcoin, representing roughly a 6% upside from current prices 🚀.
Now , let's dive into the educational section,
🧠 Understanding the Trader Psychology After Missing a Market Nuclear Explosion
When the market suddenly pumps, the first thought for many traders is: “I missed it.” That’s where the mental storm begins. Your mind starts blaming you, your analysis, or even bad luck. But all of that is just an emotional response.
The real question is can you use this moment to build your self-awareness and grow as a trader?
🧨 Turning Mistakes into Opportunities Without Self-Blame
Missing a pump isn’t necessarily a mistake it’s just an outcome. Maybe you didn’t check the charts, maybe fear held you back. What matters is: what did you learn?
A real trader documents every misstep, studies it, and adjusts next time. Turn that missed opportunity into a "pivot moment".
Keep a trading journal. Write why you missed it. What signs were there that you ignored? What can you do differently next time?
📊 TradingView Tools to Hunt the Next Big Move 🚀
When the market explodes, jumping in without a plan is a recipe for disaster. Step one? Turn off your emotions. Step two? Open up TradingView.
In moments like these, a few key tools can help you figure out whether the pump is over — or just getting started. One of the most powerful tools is Volume Profile Visible Range (VPVR). It shows you where volume is stacking up.
Heavy pumps usually lead to corrections, but if VPVR shows strong volume still holding higher levels, the opportunity may not be gone yet.
Next is the Relative Strength Index (RSI). If RSI is already above 70, chances are you're showing up late. But here’s the twist if there’s a small dip, RSI cools down, and then starts rising again… that might be your real chance to enter.
💥 When the Market Blows Up Like a Nuclear Bomb, How Do You React?
When green candles start stacking and everyone’s flexing profits, you’re left behind staring at a chart that feels like it betrayed you.
This is exactly when people make emotional decisions. But urgent hype is the enemy of good analysis. Your first job here: stay calm and look at the trend like a surgeon.
🧩 Greed vs. Logic Entering at the Top or Waiting for a Pullback?
The question isn’t whether to enter now. The real question is: why are you entering?
Because you feel left out? Or because your system gives you a signal?
If your decision isn’t based on a clean setup, you’re not trading you’re gambling. Logic must win over emotion. Every. Single. Time.
🧱 Coping With the Psychological Wall of Missing Out
The pain of missing out is real. It’s like arriving at the station just to see the train’s dust.
But here’s the truth: this wasn’t the last train.
One of the best traits of a great trader is the belief in future opportunities. If you chase what’s already gone, you’ll keep losing.
Instead, focus on rebuilding your mindset.
🎯 Smart Goal Setting: Prepare for the Next Wave, Don’t Chase the Previous One
Don’t chase a pump that’s already peaked. Instead, watch for early signs of the next one.
Look at coins that haven’t moved yet but are building momentum.
Focus on price action, volume behavior, hidden news, and reliable chart patterns. Let logic lead the way not FOMO.
🔄 What’s the Best Move After Missing a Pump? Maybe… Do Nothing
Sometimes, doing nothing is the best strategy.
The market isn’t a one-time lottery ticket. It gives out chances regularly but your impatient mind makes you believe you’re running out of time.
If your next move feels rushed, pause. Train your discipline to only trade with a cool head.
💡 Pro Tips to Come Back Stronger in the Next Big Move
Instead of regret, build a killer watchlist.
Set smart price alerts.
Go back to your past data and find recurring setups.
Sharpen your skills, study tools that help, and prepare for different scenarios.
Being prepared = staying ahead.
✨ Need a little love!
We pour love into every post your support keeps us inspired! 💛 Don’t be shy, we’d love to hear from you on comments. Big thanks , Mad Whale 🐋
📜Please make sure to do your own research before investing, and review the disclaimer provided at the end of each post.

BITCOIN → Consolidation, retest of 120K. Correction of dominanceBINANCE:BTCUSDT , after a rapid rally and touching 123K, rolled back and entered consolidation, giving altcoins a chance. At the same time, Trump signed new crypto laws, but will these laws open new doors?
On June 18, the GENIUS Act was signed. Information can be found in the sources, but there is no direct reference to BINANCE:BTCUSDT.P , except perhaps indirectly: increased confidence in the crypto market, increased liquidity, possible new rules, and pressure on decentralized assets. Bitcoin has not always grown on positive news; more often it has been a deep pullback and liquidation before the momentum.
Technically, Bitcoin is currently consolidating, and I would highlight several key areas: the upper range is 120K-120.9K. The zone between these levels is particularly important, as this is where buyers were previously liquidated and sellers gathered (liquidation is possible).
The bottom is 117K (confirmed) - 116.2K. There is a liquidity pool on the support side.
additional scenario if the market does not reach resistance and decides to form a long squeeze before growth
Theoretically, I am not yet expecting a breakout and growth of Bitcoin. I think that consolidation may continue for some time, especially against the backdrop of a pullback in altcoins and a deep correction in the dominance index.
Resistance levels: 120100, 120850
Support levels: 117000, 116230
Since the opening of the session, the price has been working off the liquidity capture from 117K. There is a reaction - growth, which could bring the price to the zone of interest at 120K. But the question is: will the price hold in the 120K zone? A false breakout of resistance could trigger a correction to 117-116K. Thus, I expect the market to remain in consolidation for some time or even expand the current trading range...
Best regards, R. Linda!

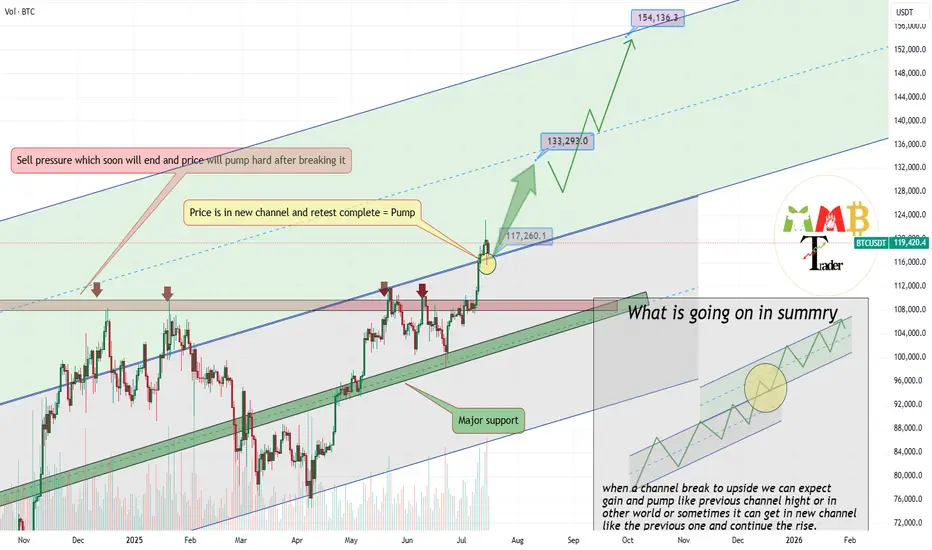
Bitcoin retest of breakout completed soon 133K$As we can see price broke previous channel and now is in new Ascending channel and pointing targets like 133K$ & 150K$.
Major support now is around 116000$ to 117000$ and price hold strong and market can easily continue more pump here like the green arrow.
BINANCE:BTCUSDT is now hitting ATH constantly and this just beginning of this bull run because ALT coins are not yet started.
DISCLAIMER: ((trade based on your own decision))
<<press like👍 if you enjoy💚
Top Altcoins Choice —Your Pick · Bitcoin Hits New All-Time HighBitcoin is once again trading at a new all-time high and as this happens the altcoins go boom.
The first instance circled around the fact that Bitcoin was strong and range trading between $100,000 and $110,000. When Bitcoin goes sideways within a bull market, the altcoins tend to blow up, and blow up they need. Now, when Bitcoin moves to hit a new all-time high and keeps growing; the 2025 Cryptocurrency bull market is fully confirmed.
» Which one is your favorite altcoin trading pair?
» Which project you think will grow the most in 2025 & 2026?
» What is your TOP ALTCOIN CHOICE?
Top Altcoins Choice —Your Pick
Leave a comment with some of your favorite altcoins pairs, the ones you like most and I will do a full analysis for you. I will publish in my profile and also answer directly in the comments section. I will pick and choose.
If you see other commentators that have a pair that you like, make sure to boost their comment and reply. The more boosts a comments gets, higher priority will be given to the project and trading pair.
Boost this publication and leave a comment, let's get started with your TOP ALTCOINS CHOICE!
Namaste.

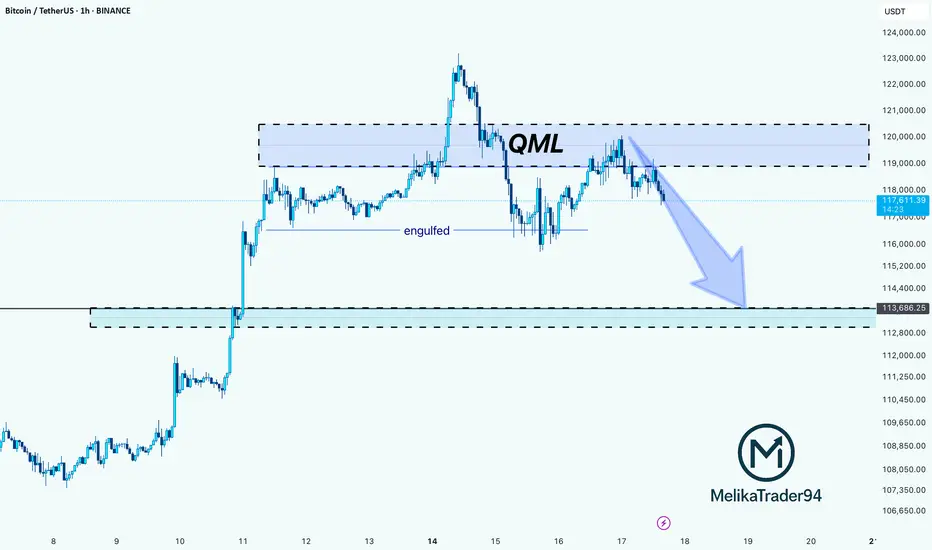
BTC Rejection from QML Zone: Towards on 113,600 SupportHello guys!
This chart shows a QML (Quasimodo Level) setup in play on Bitcoin. After price created a new high and engulfed the previous structure, it returned to the QML zone (around $119K–$121K) and reacted exactly as expected: strong rejection.
The sharp selloff from the QML area confirms a bearish shift in structure, and now the momentum is tilted to the downside.
The next key level to watch is the 113,600 demand zone, where the price may either bounce or consolidate.
As long as the price stays below the QML zone, bears have control.
You should consider that the main trend is bullish, and the stop loss may be hit, so please manage your risk!
Bitcoin in New Ascending channel wait for 160K$As we can see Price broke previous ATH & channel resistance together and is holding strong, if it continue soon new channel is path to claim for Price based on chart and targets like 160K is just easy to hit.
So get Ready for new Highs and ATH here also this breakout to upside was mentioned in previous analysis and now that it is happening don't get surprise if you see notifications like Bitcoin new ATH 150K$.
DISCLAIMER: ((trade based on your own decision))
<<press like👍 if you enjoy💚

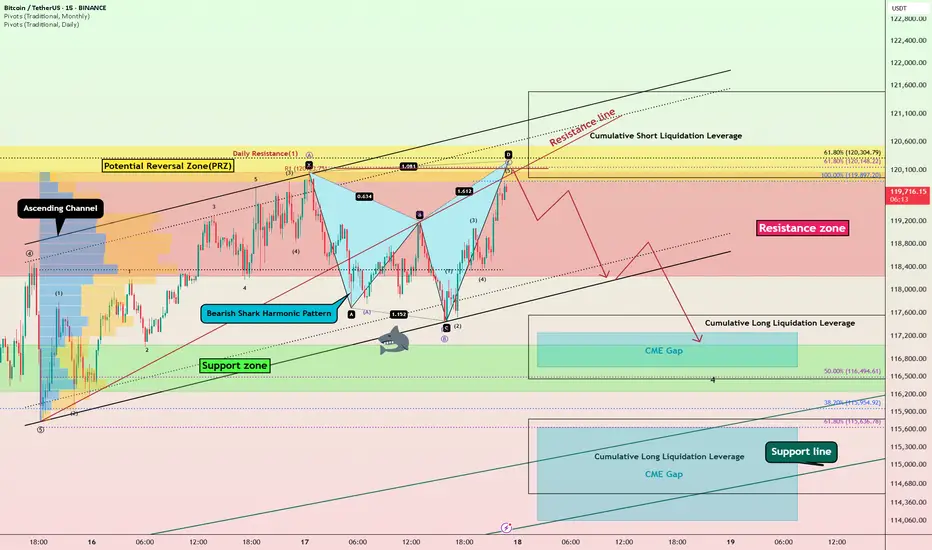
Bitcoin Bearish Shark Detected – CME Gap Below $115K in Sight?Today's analysis is on the 15-minute timeframe , following the previous analysis I shared with you on the 1-hour timeframe .
Bitcoin ( BINANCE:BTCUSDT ) is currently trading in the Resistance zone($120,100-$118,240) near the Potential Reversal Zone(PRZ) and Cumulative Short Liquidation Leverage($121,490-$119,965) .
From a technical perspective , it looks like Bitcoin is completing the Bearish Shark Harmonic Pattern on the 15-minute timeframe .
From an Elliott wave theory perspective, it looks like Bitcoin is completing the microwave 5 of wave C of the Zigzag Correction(ABC/5-3-5) .
I expect Bitcoin to start falling from the top of the ascending channel and at least decline to the lower line of the descending channel, and if the ascending channel breaks this time, we should wait for the CME Gap($117,255-$116,675)/CME Gap($115,060-$114,947) to fill.
Cumulative Long Liquidation Leverage: $117,556-$116,465
Cumulative Long Liquidation Leverage: $115,773-$114,513
Do you think Bitcoin can create a new ATH again?
Note: Stop Loss(SL)= $121,620
Please respect each other's ideas and express them politely if you agree or disagree.
Bitcoin Analyze (BTCUSDT), 15-minute time frame.
Be sure to follow the updated ideas.
Do not forget to put a Stop loss for your positions (For every position you want to open).
Please follow your strategy and updates; this is just my Idea, and I will gladly see your ideas in this post.
Please do not forget the ✅' like '✅ button 🙏😊 & Share it with your friends; thanks, and Trade safe.
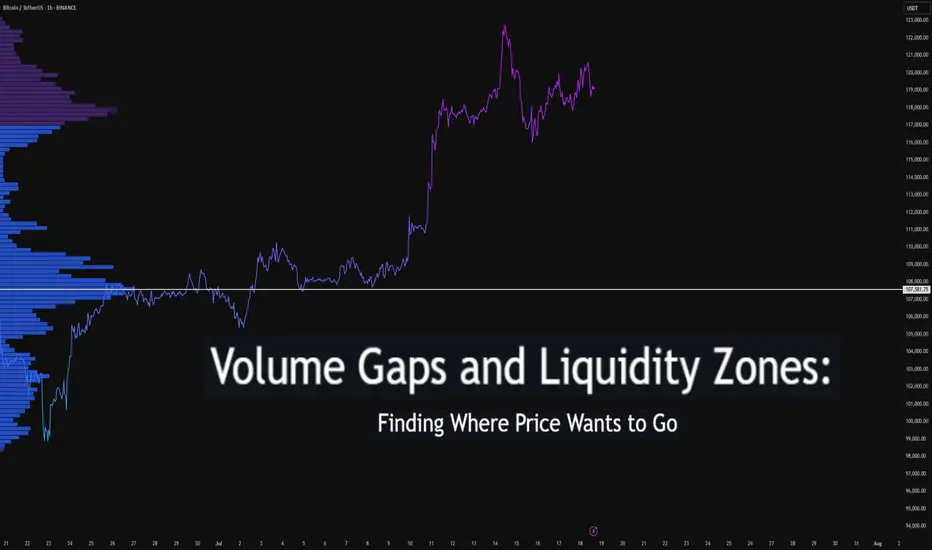
Volume Gaps and Liquidity Zones: Finding Where Price Wants to GoDifficulty: 🐳🐳🐳🐋🐋 (Intermediate+)
This article is best suited for traders familiar with volume profile, liquidity concepts, and price structure. It blends practical trading setups with deeper insights into how price seeks inefficiency and liquidity.
🔵 INTRODUCTION
Ever wonder why price suddenly accelerates toward a level — like it's being magnetized? It’s not magic. It’s liquidity . Markets move toward areas where orders are easiest to fill, and they often avoid areas with little interest.
In this article, you’ll learn how to identify volume gaps and liquidity zones using volume profiles and price action. These tools help you anticipate where price wants to go next — before it gets there.
🔵 WHAT ARE VOLUME GAPS?
A volume gap is a price region with unusually low traded volume . When price enters these areas, it often moves quickly — there’s less resistance.
Think of a volume gap as a thin patch of ice on a frozen lake. Once the market steps on it, it slides across rapidly.
Volume gaps usually show up on:
Volume Profile
Fixed Range Volume tools
Session or custom volume zones
They’re often created during impulsive moves or news events — when price skips levels without building interest.
🔵 WHAT ARE LIQUIDITY ZONES?
Liquidity zones are price areas where a large number of orders are likely to be sitting — stop losses, limit entries, or liquidation levels.
These zones often form around:
Swing highs and lows
Order blocks or fair value gaps
Consolidation breakouts
Psychological round numbers
When price approaches these areas, volume often spikes as those orders get filled — causing sharp rejections or breakouts.
🔵 WHY THIS MATTERS TO TRADERS
Markets are driven by liquidity.
Price doesn’t just move randomly — it hunts liquidity, clears inefficiencies, and fills orders.
Your edge: By combining volume gaps (low resistance) with liquidity zones (target areas), you can forecast where price wants to go .
Volume gap = acceleration path
Liquidity zone = destination / reversal point
🔵 HOW TO TRADE THIS CONCEPT
1️⃣ Identify Volume Gaps
Use a visible range volume profile or session volume. Look for tall bars (high interest) and valleys (low interest).
2️⃣ Mark Liquidity Zones
Use swing highs/lows, OBs, or EQH/EQL (equal highs/lows). These are magnet areas for price.
3️⃣ Watch for Reactions
When price enters a gap, expect speed.
When it nears a liquidity zone, watch for:
Volume spike
Wick rejections
S/R flip or OB retest
🔵 EXAMPLE SCENARIO
A strong bearish move creates a volume gap between 103 000 – 96 000
Below 96 000 sits bullish order blocks — clear liquidity
Price enters the gap and slides fast toward 96 000
A wick forms as buyers step in, volume spikes — the reversal begins
That’s price filling inefficiency and tapping liquidity .
🔵 TIPS FOR ADVANCED TRADERS
Use higher timeframes (4H/1D) to define major gaps
Look for overlapping gaps across sessions (Asia → London → NY)
Align your trades with trend: gap-fills against trend are riskier
Add OB or VWAP as confirmation near liquidity zones
🔵 CONCLUSION
Understanding volume gaps and liquidity zones is like reading the market’s intention map . Instead of reacting, you start predicting. Instead of chasing, you’re waiting for price to come to your zone — with a plan.
Price always seeks balance and liquidity . Your job is to spot where those forces are hiding.
Have you ever traded a volume gap into liquidity? Share your setup below
BTC Bullish Setup: Two Long Positions Aligned for ContinuationHello guys!
Bitcoin is currently in a strong uptrend, consolidating after a sharp move up. The chart highlights a textbook bullish continuation pattern (pennant/triangle), suggesting momentum is building for another leg up.
Attention:
This is not an either-or setups. Both long entries are valid and could trigger one after the other, offering layered opportunities for bulls.
1- First Long: Breakout from Bullish Pennant
Price is tightening inside a triangle after a strong impulse move.
A breakout above the resistance around $118K would confirm continuation.
Entry on the breakout targets the upper liquidity zone near $122K.
2- Second Long: Pullback to S&D Zone (around $115K)
If the breakout happens and then retraces, watch for price to revisit the S&D zone at $115,200–$115,800.
This area will act as support and provide a second long opportunity.
target: around $122k

BTC Could Start Another Bullish WaveBTC Could Start Another Bullish Wave
Over the past two days, bitcoin has been holding strong above 118400. It seems that this small structural area could push BTC higher.
For now, ETH has performed better and BTC may follow suit.
I am looking for short-term targets near 122400, 125000 and 127000.
You may find more details in the chart!
Thank you and Good Luck!
PS: Please support with a like or comment if you find this analysis useful for your trading day

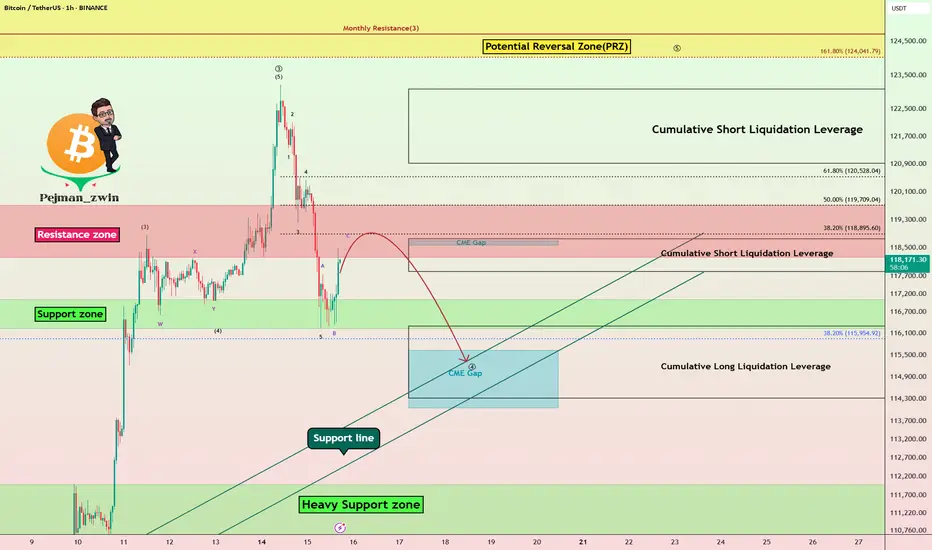
Bitcoin Technical Setup: Support Holds, Eyes on $118,600Bitcoin ( BINANCE:BTCUSDT ) moved as I expected in the previous ideas and finally completed the CME Gap($117,255-$116,675) in the last hours of the week. ( First Idea _ Second Idea )
Before starting today's analysis, it is important to note that trading volume is generally low on Saturday and Sunday , and we may not see a big move and Bitcoin will move in the range of $121,000 to $115,000 ( in the best case scenario and if no special news comes ).
Bitcoin is currently trading near the Support zone($116,900-$115,730) , Cumulative Long Liquidation Leverage($116,881-$115,468) , Potential Reversal Zone(PRZ) , and Support lines .
According to Elliott Wave theory , Bitcoin had a temporary pump after the " GENIUS stablecoin bill clears House and heads to Trump's desk " news, but then started to fall again, confirming the end of the Zigzag Correction(ABC/5-3-5) . Now we have to wait for the next 5 down waves or the corrective waves will be complicated .
I expect Bitcoin to rebound from the existing supports and rise to at least $118,600 . The second target could be the Resistance lines .
Do you think Bitcoin will fill the CME Gap($115,060-$114,947) in this price drop?
Cumulative Short Liquidation Leverage: $121,519-$119,941
Do you think Bitcoin can create a new ATH again?
Note: Stop Loss(SL)= $114,700
Please respect each other's ideas and express them politely if you agree or disagree.
Bitcoin Analyze (BTCUSDT), 15-minute time frame.
Be sure to follow the updated ideas.
Do not forget to put a Stop loss for your positions (For every position you want to open).
Please follow your strategy and updates; this is just my Idea, and I will gladly see your ideas in this post.
Please do not forget the ✅' like '✅ button 🙏😊 & Share it with your friends; thanks, and Trade safe.

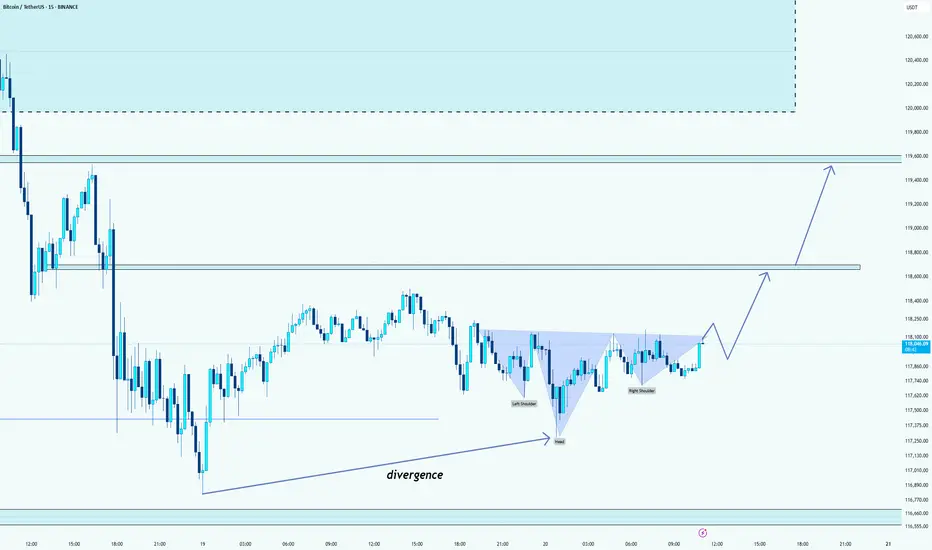
BTC: a Head and shoulders patternHello guys!
As you can see, a Head and shoulders and a divergence formed!
We can expect the price to rise until those two levels that I pointed out!
If the neckline breakout gets a long in retracements!
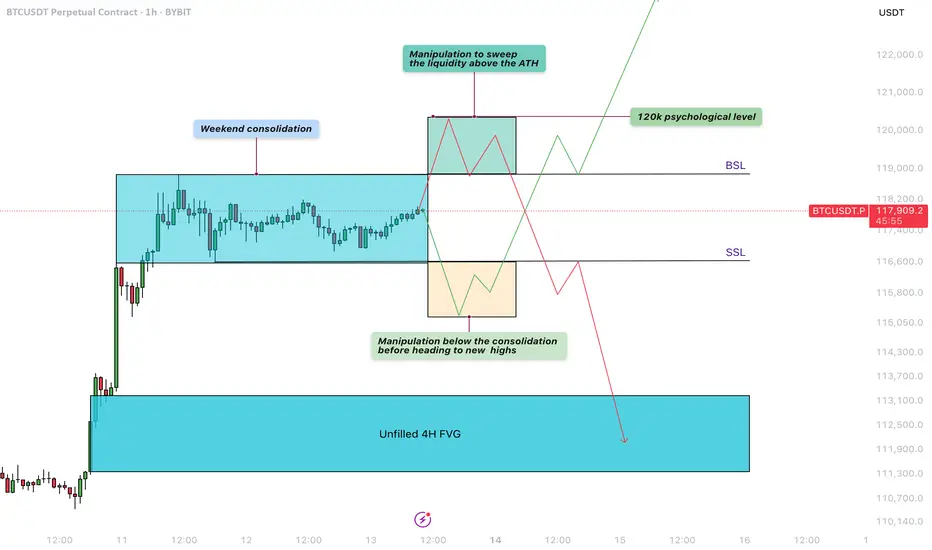
Bitcoin - Liquidity sweep before the next move!Weekend Consolidation
During weekends, Bitcoin often moves sideways as institutional players step back and retail traders prepare for the next move. During this consolidation phase between $117.000 and $119.000, liquidity builds up on both sides—sell-side liquidity below the range and buy-side liquidity above it. After these weekend consolidations, Bitcoin typically sweeps one side of liquidity before continuing in the opposite direction.
Manipulation Above the Buy-Side Liquidity
A significant amount of liquidity has formed just above the all-time high, right below the $120,000 level. Retail traders are positioning for a potential downward move, making this area a prime target for a liquidity sweep. This aligns perfectly with the psychological barrier of $120,000, a level where many traders are likely to take profits.
Manipulation Below the Sell-Side Liquidity
Over the weekend, traders are entering both long and short positions while placing stop-loss orders just below recent lows. This behavior creates a buildup of liquidity underneath the range. Bitcoin could dip below these lows to stop out retail traders before reversing to higher levels.
4-Hour Unfilled Fair Value Gap (FVG)
If Bitcoin sweeps the all-time high and enters a distribution phase, there’s a strong chance it will retrace to fill the unfilled Fair Value Gap on the 4-hour chart at $113.000 - $111.000. This imbalance was created during a sharp move up, leaving behind unfilled orders. Such levels often get revisited as price action seeks to rebalance.
How to Execute This Trade
Wait for Bitcoin to sweep either the low or the high of the weekend range. Avoid entering the market immediately after the sweep. Instead, wait for confirmation that price is returning back inside the range, signaling a clean sweep. On lower timeframes, such as the 5-minute chart, you can look for entry models like an inverse Fair Value Gap to refine your entry.
Final Thoughts
At this point, it’s unclear which direction Bitcoin will take next. The best approach is to wait for a clear liquidity sweep and signs of a reversal before entering any trades. That said, there’s a possibility we may first move up to test and claim the $120,000 psychological level before revisiting and filling the lower 4-hour imbalance zones.
Thanks for your support. If you enjoyed this analysis, make sure to follow me so you don't miss the next one. And if you found it helpful, feel free to drop a like and leave a comment, I’d love to hear your thoughts!
#BTCUSDT[BITCOIN]: What Next Now For Bitcoin? We’ve published multiple analyses on Bitcoin, and as expected, the price has moved in line with our predictions. Now that it’s reached an emotional level of 120k, the main question is: will price hold on to the bullish volume and continue the bull move to the next target, which could be 130k or 150k? In our opinion, price will remain bullish until it touches the 130k region. At that point, we could see a short-term bearish correction for Bitcoin. Please do your own analysis and risk management.
Team Setupsfx_
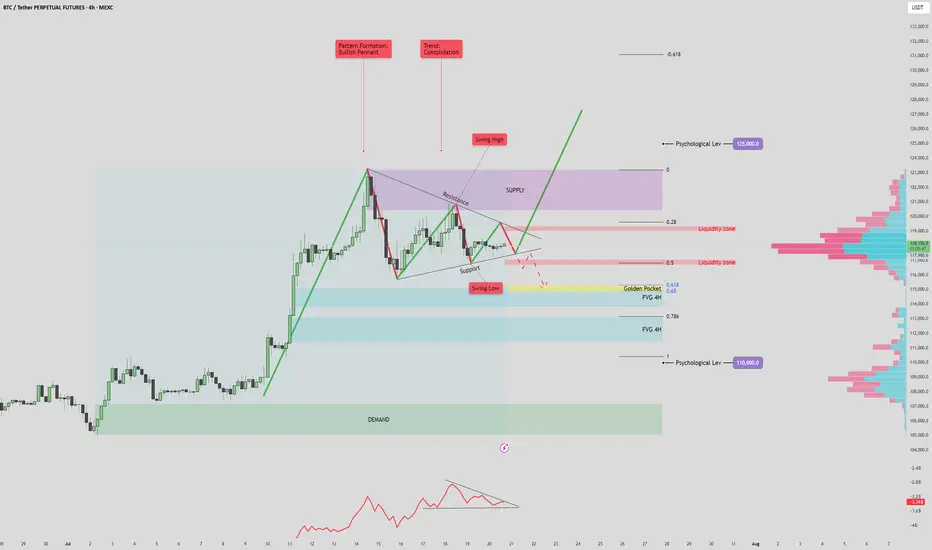
BTC/USDT 125k? or 110k fall again?BTC/USDT 4H Analysis – July 20, 2025
The current market structure shows a bullish pennant forming after a strong impulsive move upward, with price consolidating between key support and resistance levels. This pattern, combined with volume signals and key price zones, suggests a potential for a high-volatility breakout.
🔷 Volume Profile & OBV Insights
The On-Balance Volume (OBV) indicator is forming a symmetrical triangle, indicating a volume squeeze. This suggests a potential sudden spike in volume that could confirm the next major move.
Anchored Volume Profile (VPVR) on the right shows a notable low-volume area between 112K–115K. If price breaks below this zone, it could lead to a rapid selloff toward deeper fair value areas due to reduced liquidity support.
📈 Bullish Scenario
If price breaks above the pennant resistance and 119.5K liquidity zone, it may signal bullish continuation.
A successful retest of the breakout level as support would confirm strength, opening the door to:
Short-term target: 123K (supply zone and previous swing high)
Mid-term target: 125K (key psychological level and potential ATH)
Watch for confirmation via OBV breakout and strong bullish volume. Failure to sustain above the 118K–119K area could signal a bull trap.
📉 Bearish Scenario
A breakdown below pennant support and the 115K level would likely trigger a move into the low-volume range.
First key downside target: 114.7K–115.7K, which aligns with the Golden Pocket (Fib 0.618 zone) and a 4H Fair Value Gap (FVG).
This zone may act as a support or a liquidity grab reversal area.
If this zone fails to hold, deeper downside targets become likely:
FVG 2 (~112K)
Psychological support at 110K, which aligns with strong historical demand and a major VPVR node.
This bearish move may either confirm further downside momentum or present a fakeout opportunity if price sharply reverses from one of these deeper levels.
✅ Summary
BTC is coiled within a bullish pennant, with both bullish continuation and bearish breakdown scenarios in play. Volume confirmation and breakout direction will be key. Traders should monitor how price reacts around the 115K–118K zone for directional clarity. A move beyond this range, especially with volume support, will likely define the next trend leg.
Bitcoin Struggles Below $120K:Will the CME Gap Pull Price Lower?Bitcoin ( BINANCE:BTCUSDT ) has been experiencing a high momentum bullish trend in recent days, which few people expected, especially when it crossed $120,000 . However, in the past 24 hours , Bitcoin has fallen back below $120,000 .
Bitcoin is currently trading in the Resistance zone($119,720-$118,240) and Cumulative Short Liquidation Leverage($118,757-$117,829) on the 1-hour time frame .
In terms of Elliott Wave theory , Bitcoin appears to be completing a main wave 4 . Main wave 4 is likely to have a Zigzag Correction(ABC/5-3-5) .
I expect Bitcoin to attack the Support lines and fill the CME Gap($115,060-$114,947) in the next hour.
Cumulative Short Liquidation Leverage: $123,087-$120,922
Cumulative Long Liquidation Leverage: $116,305-$114,325
Do you think Bitcoin can create a new ATH again?
Note: Stop Loss(SL)= $121,000
Please respect each other's ideas and express them politely if you agree or disagree.
Bitcoin Analyze (BTCUSDT), 1-hour time frame.
Be sure to follow the updated ideas.
Do not forget to put a Stop loss for your positions (For every position you want to open).
Please follow your strategy and updates; this is just my Idea, and I will gladly see your ideas in this post.
Please do not forget the ✅' like '✅ button 🙏😊 & Share it with your friends; thanks, and Trade safe.
Lingrid | BTCUSDT strong Bullish Trend Continues The price perfectly fulfilled my last idea . BINANCE:BTCUSDT CRYPTOCAP:BTC broke out of a long consolidation range and confirmed a higher low at 98,200, initiating a new impulsive rally inside the upward channel. The price is now trading well above the 116,643 breakout level and holding near the mid-range of the next resistance zone. As long as the bullish structure holds, price is expected to target the upper resistance band near 130,000 in the coming sessions. Momentum and structure remain in favor of the bulls, supported by trendline and volume strength.
📉 Key Levels
Buy trigger: breakout and sustained move above 116,643
Buy zone: 116,643–120,000 (retest of structure and upper trendline)
Target: 130,000
Invalidation: drop below 116,000 breaks upward trend bias
💡 Risks
False breakouts around resistance zone may delay continuation
Macro uncertainty or ETF-related news can shift sentiment
Failure to hold above 116,643 would expose the trend to deeper correction
If this idea resonates with you or you have your own opinion, traders, hit the comments. I’m excited to read your thoughts!

$130K Channel Resistance — Bullish Structure Intact Bitcoin continues its strong uptrend, pushing toward high time frame resistance at $130K. With no bearish structure in sight, short-term momentum favors continuation unless resistance prompts a reversal.
Bitcoin is showing continued strength in the immediate short term, with price steadily advancing toward the $130,000 high time frame channel resistance. This level marks the upper boundary of a macro trend channel and presents the next critical test for BTC. While this zone may act as a barrier, the market remains structurally bullish, and further upside remains possible before any meaningful correction takes place.
Key Technical Points:
- Channel Resistance at $130K: Major high time frame level to watch
- Bullish Market Structure: Consecutive higher highs and higher lows on lower time frames
- No Bearish Reversal Signs Yet: No structural break or shift to indicate correction
Bitcoin’s price action has been defined by clear bullish structure, especially on the lower time frames, where the market continues to print higher highs and higher lows. This confirms that bulls are still in control and dips are being bought aggressively, maintaining the strength of the trend.
The next major technical level is the $130K resistance, which aligns with the upper boundary of a long-term ascending channel. This area is likely to serve as a key decision zone. If price approaches this region without any signs of exhaustion or bearish divergence, the probability of a brief breakout or retest increases.
However, it is also important to consider this level as a potential inflection point. If price begins to stall at or near $130K — especially with declining volume or a shift in short-term structure — it could signal the beginning of a corrective move. Until such a development occurs, however, the market remains decisively bullish.
Traders should closely monitor intraday structure around the $130K zone. A clean break above on strong volume would indicate continued strength and could open the path toward further price discovery. Conversely, the first sign of weakness would be a break of short-term support levels and failure to form new highs — neither of which has occurred yet.
Bitcoin remains bullish in the short term as it approaches $130K resistance. Unless a structural break occurs or bearish signals appear, further upside remains likely before any correction sets in.