BTC aiming to retest 98k to 100k Several factors coming together:
The market is very bearish in sentiment. Selling likely exhausted here and short side probably overcrowded
Daily demand is holding and displaying strong reactions
Untested Weekly gap above and untested daily supply zone are calling for a liquidity test.
Trade ideas

BTC/USDT 4H Chart 🔍 MARKET STRUCTURE
The chart shows a broad ascending channel in which BTC has been moving for several days:
Lower trend support: ~$87,500 – $88,000
Upper trend line: ~$94,500 – $95,000
The price has clearly rebounded from around $89,200, an important demand level.
📈 KEY LEVELS
Support
USD 89,284 – local support from which a rebound occurred
USD 87,804 – the next, much stronger support level consistent with the trendline
Resistance
USD 91,466 – currently being tested
USD 94,141 – key resistance and the upper band of the channel
📊 CHART SITUATION (4 hours)
1. Price action
The price has made a strong upward impulse from support at USD 89,280.
It is currently reaching local resistance at USD 91,450 – USD 91,700.
If this level is broken, the target is USD 94,000 – USD 94,500.
If it fails, a pullback to USD 90,200/USD 89,300 can be expected.
📉 MACD
Your MACD shows:
Bullish crossover – buy signal.
The histogram changes from red to green → momentum is increasing.
The curves are diverging, confirming the strength of the move.
This indicates that the short-term trend is turning bullish.
📌 TWO TRADING SCENARIOS
🟢 BULLISH Scenario (more likely)
Condition: H4 candle breakout and close above USD 91,700.
Targets:
TP1 → USD 92,800 – USD 93,200
TP2 → USD 94,000 – USD 94,500 (upper channel)
Stop-loss (if you were going long):
below USD 90,500
Safer below USD 89,280
MACD confirms this scenario.
🔴 BEARISH Scenario
Condition: rejection of USD 91,700 and a close below USD 90,500.
Targets:
TP1 → USD 89,300
TP2 → USD 87,800 (key trendline)
A drop to USD 87,800 would be an ideal place for large players to buy again.

Daily Bitcoin Trade | Short | Sunday | Dec/07/2025Hi Guys. I think Bitcoin could move down a little bit more.
Lev:43x
En: 89566
Sl: 90934
Tp: 87466
This is my personal setup. may fail. please manage your capital and risk.

BLACK SWAN322 and black swan
i cant tell more all in the chart. My last predict not in TV i predicted 10 october because i have signal from space)

BTCUSD : Technical analysis Mini Demand Zone After Bearish Comes📊 BTCUSD 30-Minute Analysis — Reversal Zone + Volume Burst Setup
1. Market Structure Overview
On the 30M timeframe, BTCUSD is currently trading inside a corrective phase after rejecting the upper resistance area around $91,000 – $92,000. The price formed a rounded-top structure, indicating a gradual weakening of bullish momentum.
The market has been moving sideways with decreasing volatility, suggesting accumulation or preparation for the next move.
2. Major Drop & Formation of Fresh Reversal Zone
A major bearish move pushed BTC down into a strong Reversal Zone (RZ) positioned around:
**🔽 Key Reversal Zone (Demand Area):
$88,000 – $87,000**
This zone is significant because:
It aligns with previous reaction level from Dec 2
Strong buy-side volume burst previously originated here
Price has already shown a wick rejection, signaling buyer interest
This is a high-probability demand area where institutions previously entered the market.
3. Volume Burst Confirmation
Inside the Reversal Zone, the chart highlights a Volume Burst area.
Why Volume Burst Matters:
Shows strong buying pressure
Indicates absorption of sell orders
Confirms demand is active at this region
If BTC revisits this zone, buyers may aggressively defend it again.
4. Expected Short-Term Movement
Your chart shows two potential scenarios:
Scenario A – Bullish Reversal (Most Likely)
Price may dip slightly into the Reversal Zone
Strong buyers react at the volume burst area
Market forms a bullish reaction candle
Break above minor consolidation leads to upward continuation
Target Levels After Reversal:
$89,800 – Pattern Completion
$90,500 – Short-Term Resistance
$91,000 – Structural High Retest
Scenario B – Bearish Breakdown (Less Likely but Possible)
If the Reversal Zone fails:
BTC may slide toward $86,500 – $85,800
This would confirm a deeper correction phase
But current PA suggests buyers are preparing a move upward.
5. Pattern Must – Confirmation Zone
A label on the chart shows "Pattern Must" around $89,500–$89,800.
This is the confirmation level where:
Break and retest = bullish continuation
Rejection = temporary sideways / deeper pullback
This acts as the neckline for a potential reversal pattern.
6. Technical Summary
Bias: Bullish from Reversal Zone
Main Support: $88,000 – $87,000 (Strong Demand)
Immediate Resistance: $89,800
Trend Outlook: Accumulation → Possible Upside Reversal
BTCUSD is currently forming a technical base, and a move upward is expected once price reacts strongly inside the Reversal Zone.
🎯 Conclusion
BTC is approaching a high-probability buying zone backed by:
Reversal Zone
Previous demand
Strong volume burst
Rounded-top breakdown structure
Market preparation for pattern completion
A bullish reversal remains the primary expectation, with targets toward $89,800 – $91,000.

$BTC Floating in an Imbalance ZoneCRYPTOCAP:BTC is sitting inside a mid-range LVN cluster.
Price is around 89.6k, right on the edge of a thin LVN band. This isn’t a high-volume acceptance zone, so there’s no real stability — price is basically floating in an imbalance pocket, and volatility can snap either way.
If we hold above the 89k-88k, we could see a rotation back toward 95–97k to rebalance into the upper LVN.
But if 88k gives out, a quick drop toward 87.5–86.5k is likely. This would be your ideal long sweep zone.
Note: LVNs rarely act as strong support. When they break, the move usually accelerates. The downside magnet becomes the 87–86.5k HVN base — the ideal sweep zone for longs.

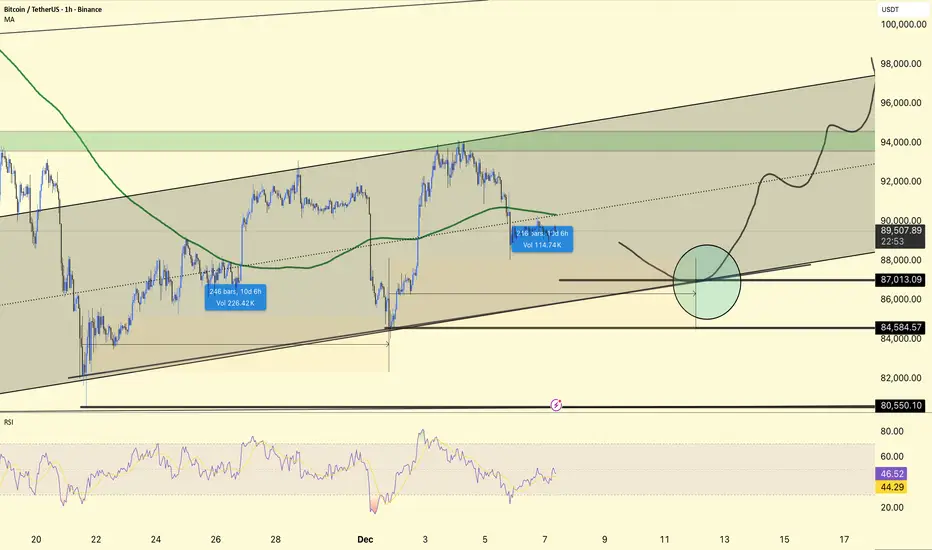
#BTC 4HOUR CHART UOPDATE !!BTCUSDT is still trading within an ascending channel, now pulling back towards the mid-lower portion of the structure after failing to sustain above 90k on the latest push.
The price has rolled over from the upper half of the channel and is heading towards the main confluence zone around 87,000–88,000, where the lower channel line, previous horizontal support, and your marked circle align.
84,584 and 80,550 remain the next downside reference supports; holding above 87k maintains the short-term bullish channel, while a break below 84,584 would increase the risk of a deeper correction towards 80k.
A decline into the 87k area, followed by basing and a continuation back towards 92k–94k, and if buyers defend the channel as drawn, possibly to the 96k–98k channel top.
The RSI is mid-range rather than overbought, so there is room for another leg down or a sharp bounce to test support; using 87k–84.5k as the main invalidation band for aggressive longs fits within the current 4H structure.
DYOR | NFA,
$BTC Top-Down Analysis (Short & Simple)Here’s a quick breakdown of what I’m seeing in $BTC.
Overall, all major timeframes are still bearish including the lower ones. CRYPTOCAP:BTC is currently holding weekly bullish OB zone along with a dynamic trendline support.
Weekly TF: We have one good sign and one bad sign.
Bad sign: Red trendline has already broken, and price is trading below it. (not ideal)
Good sign: There’s another trendline (light black) still acting as support, and confirmations on the weekly timeframe would strengthen this level.
Moving to Daily: Still very low momentum since Oct 10th crash no strong volatility.
On 4H: Structure looks slightly better, but any bullish shift would need a clean breakout above marked red resistance zone. 4H + Daily candle close above it would confirm a trend shift in internal (Daily) and external (4H) structure.
I kept chart simple so it’s easy to understand.
As for the big question: Is 80k the bottom?
Ans: Given that all timeframes are bearish and momentum is weak, calling it a confirmed bottom is premature. Only a strong pump from the current zone can support that idea. Most likely bottom should form somewhere around 80k - 75k.
This analysis is pure price action with multiple confluences (FIB, orderflow, ICT, SMC concepts).
If this analysis helped or you learned something new, please boost this post i appreciate the support!

BTC Trade Plan 06/12/2025Dear Traders,
appears to be a corrective bullish channel within a larger downtrend. This channel likely represents a pullback, increasing the probability of a downside continuation. The 94,500 – 98,500 zone is a major supply area that has acted as resistance multiple times and may trigger another rejection or fake breakout if retested. Should the price get rejected from this zone, the potential downside targets are 83,000, followed by 78,000 and 75,000. A bullish scenario becomes valid only if BTC closes a daily candle above 100,000, which could open the path toward the 105,000 – 110,000 resistance range. This is a market outlook and not financial advice — proper stop-loss and risk management are strongly recommended.
If this post helped you, consider boosting and sharing it. Thank you for the support.
Alireza!

LongBtc long Hello everyone
Bullish position, Bitcoin if it breaks heavy resistance 94k and consolidates above 96k, next target 103k

Fasten Your Seatbelts – The Move Toward $75,000 Has Begun🚨 Fasten Your Seatbelts – The Move Toward $75,000 Has Begun
In my previous post, I clearly warned that a regression channel breakout could trigger the next major drop in Bitcoin — and as always, the market moved exactly as predicted.
From day one, every single scenario I’ve shared on this page has played out perfectly.
No guessing, no luck — just precise technical analysis and market structure reading.
Now, in the updated chart, Bitcoin has pulled back to the top of the descending channel (marked in blue) and is starting to turn down again.
✅ 94,000 is acting as a confirmed resistance
✅ The regression channel slope remains clearly bearish
✅ The next target is around $75,000
At this stage, any short-term bounce could simply be a retest before the next leg down.
📉 The direction is clear — and if you’ve been following my work, you already know how accurate these calls have been.
🔔 Follow for more — because what I post here doesn’t just sound good…
It happens.

BTCBTC is forming a double bottom right at the 0.786 Fibonacci level, an area that tends to be very strongly respected. At the same time, the upper boundary of the current distribution range can act as a technical magnet. The influx of heavy volume and the strength patterns on the daily chart significantly increase the odds of a move up to $100,000.

BTCUSDT - The BottomI am looking at $75k-$80k for a bottom before a push upward to $128k or hopefully beyond

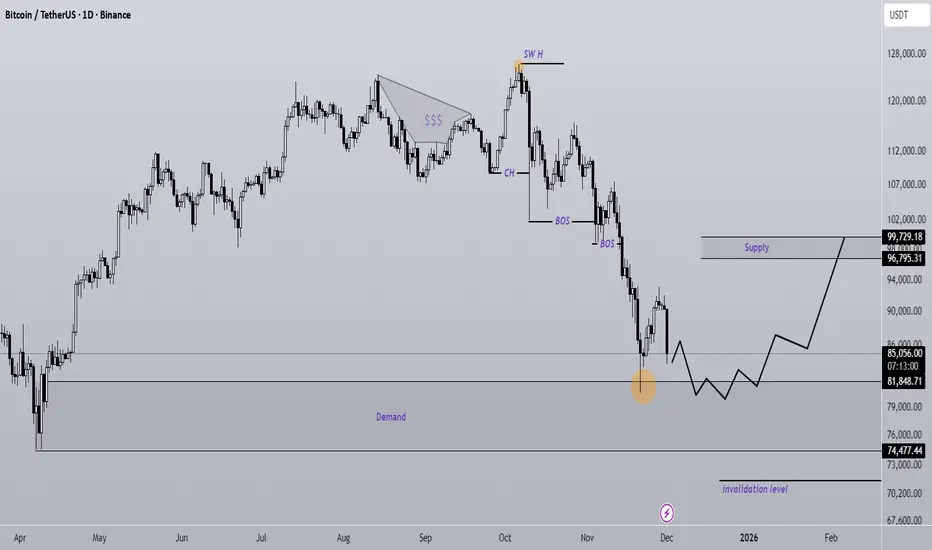
Bitcoin new update (1D)Bitcoin has not yet fully absorbed the buy orders in the marked support zone. This time, upon tapping the support area again, we can expect the price to form a stronger bullish move, at least toward the identified supply zone.
A daily candle closing below the invalidation level will invalidate this outlook.
Do not enter the position without capital management and stop setting
Comment if you have any questions
thank you
#BTC Rising Wedge📊#BTC Rising Wedge📉
🧠From a structural perspective, the daily chart correction is not yet over. Currently, it's within the blue resistance zone, so we still need to maintain a cautious approach.
➡️From a chart perspective, a rising wedge has gradually formed within the blue resistance zone. We generally use this model for corrections.
⚠️If we break through the blue resistance zone, it will turn into a support zone. Only then, with a suitable pullback, can we look for long trading opportunities.
🤜If you like my analysis, please like 💖 and share 💬
BITGET:BTCUSDT.P

Wave (I) Completed at 126K — Wave (II) in ProgressBINANCE:BTCUSDT
On the weekly chart, the advance clearly topped at 126K.
Momentum had already begun to fade before the peak, and several indicators confirmed it:
-- RSI : formed a lower high compared to the Wave 3 peak, signaling weakening upside momentum.
-- MACD : showed a noticeable loss of strength during the final push.
-- ADX (+DI/–DI) : reflected declining trend strength as +DI weakened and –DI gained traction.
Price also made a new high without matching momentum - a typical exhaustion pattern often seen near major market peaks.
Together, these weekly signals confirm that 126K marked the completion of Wave (I), and that the current decline represents the early phase of a broader Wave (II) correction.

Bitcoin Head & Shoulders on 1H is pumping it above 100K$ soonFirst lets take a look at that Attractive Reversal pattern which is now obvious in all tokens:
#Head_Shoulders :
The recent downward movement successfully triggered a significant number of long-position stop losses, effectively executing a 'long squeeze' and absorbing substantial sell-side liquidity. This classic market-clearing event often removes weak hands and over-leveraged positions, thereby reducing immediate overhead resistance.
With this liquidation event concluded, the market structure has notably cleared a key obstacle. The path upward now encounters less selling pressure from previously vulnerable positions. This development supports a bullish technical outlook, with the next primary targets residing at the $100,000 psychological level and beyond, as the new market structure allows for a more sustained advance.
DISCLAIMER: ((trade based on your own decision))
<<press like👍 if you enjoy💚

BTCUSDT – Major Distribution Zone Detected! Potential Drop Ahead📉 BTCUSDT – Distribution Completed, Correction Likely
1️⃣ Previous Range Accumulation (Left Zone)
Price moved sideways in a tight consolidation box.
After holding for some time, BTC broke down sharply, showing clear supply pressure.
---
2️⃣ Strong Recovery Rally (Middle Zone)
After the breakdown, price created a bullish accumulation zone.
A strong impulsive move up followed — this is a classic liquidity grab + reversal.
The diagonal trendline shows the momentum slope of the recovery.
---
3️⃣ Current Market Structure (Right Zone)
Price is currently inside another consolidation box, similar to the first range.
This suggests distribution, not accumulation.
Momentum is weakening near 93,000–94,000, with repeated rejections.
---
4️⃣ Expected Move (Bearish)
Your drawn projection is correct:
After sideways movement, BTC is likely to break down from this range.
Target region shown (~91,000 zone) makes sense because it aligns with:
Previous support
Unfilled imbalance
Ichimoku lower cloud support
---
5️⃣ Key Levels
Resistance: 93,800 – 94,200
Support: 92,000 → 91,000
Break Confirmation: Closing below 92,200
Bearish target: 91,000 – 90,800
---
🔍 Summary
BTC is forming a distribution zone after an overextended move. Market shows signs of exhaustion.
Unless BTC breaks above 94,200, the probability favors a move down toward 91,000.

BTC(based on NEo wave)this is not a trend-impulse...it is terminal and if it hit the limitation of wave 4 its a natural triangle and its not wave C of a flat.

BTC/USDT: Bullish Pullback Into Demand ZonePrice is currently pulling back after a strong upward move and is approaching a key intraday demand zone (highlighted in orange). This zone has previously acted as a support base for continuation moves and aligns with the current short-term structure of higher lows.
The circled area represents a potential liquidity sweep / reaction point, where price may wick into the zone before buyers step in. If bullish momentum returns from this level, a continuation toward the marked target area above is likely.
Key Points:
🔸 Trend: Short-term bullish structure still intact.
🔸 Demand Zone: Watching for reaction inside the highlighted support area.
🔸 Bullish Signal: A clean bounce or strong bullish candle from this zone.
🔸 Target: Next upside zone around the 94k–95k range (as indicated on chart).
🔸 Invalidation: Break and close below the lower demand zone would weaken this bullish scenario.
This setup suggests a potential buy-the-dip continuation if support holds and momentum returns.

Bitcoin Analysis – Yesterday the Market Went Crazy Hey traders!
Let’s jump into today’s Bitcoin analysis.
Yesterday the market went full crazy mode
As I told you before, you could take both long and short positions from the extremes — and I did exactly that. Both directions activated ✔️
First things first, like always, the Fear & Greed Index:
24 — still in the Fear zone.
🔍 Quick Look at the Daily Timeframe
I want you to open your daily chart with ZERO indicators.
Just look at the structure.
The daily trend is still bearish, and right now we are simply in a correction of that bearish trend.
According to Dow Theory, if we consider the primary trend as down, then we’re currently in the secondary movement.
Keep that in mind — it matters.
🚀 Scenarios & Triggers
📈 Bullish Scenario (LONG)
If price wants to move up:
👉 Breaking 92,000 is my main LONG trigger.
I will definitely take a long there, especially if the move starts during the US session or if I see clean stepping volume.
You can also long from 91,500,
just wait for a clean 1-hour candle close.
📉 Bearish Scenario (SHORT)
For shorts on Bitcoin itself — honestly,
👉 there’s NOTHING until 89,200.
Market structure isn’t giving any short setup yet.
Until then:
🔸 either wait
🔸 or look for altcoins that are bearish against BTC — those can give great short setups.
🟢 About Yesterday’s Trades
Both trades activated:
Short → closed at 2R, solid.
Long → almost hit 2R, but because my entry was a bit far, price reversed and hit SL.
Totally normal when the market has no clear direction.
🎯 Final Notes
Keep the scenarios in mind.
Watch the volume.
And as always — risk management comes first.
Stay profitable 💚🔥

BTCUSDT BUY NOW!!!!!BTCUSDT Completed my last analysis predictions by meeting up 87k level with a sharp rejections on my recent previous post on btc am in on a buy right now to 94k then expecting to make a rejections off 100k level......

Bitcoin riding long term trendsIt’s looking like BTC is readying for a retest of $100k. Let’s see if the economy continues to expand in January or not.
