BTCUSD - Weekly Market Structure & Correction ScenarioBTC has completed a strong impulsive advance from the 2023–2024 accumulation zones and is now showing signs of structural distribution near the upper macro channel.
Price has lost momentum after repeated rejections near prior resistance (~95k), suggesting a transition into a corrective or re-accumulation phase rather than immediate continuation.
The 65k–75k region represents a high-probability acceptance zone, supported by prior market structure and volume profile. This area may act as a prolonged consolidation range before the market decides on the next directional move.
A deeper retracement toward the 45k–50k high-value zone would likely require a significant macro or crypto-specific sell-off catalyst, rather than occurring organically.
Invalidation : Weekly acceptance above ~95k and re-entry into the upper macro channel would invalidate the corrective thesis.
This idea focuses on structure and value zones rather than short-term price prediction.
Market insights

BTC Liquidity Sweep/Daily FVG - Setting Up Bullish ContinuationBTC is currently trading above a clear pool of sell side liquidity resting around the 72.5k region. This level aligns with a higher timeframe daily fair value gap, making it a strong draw on price rather than a sign of weakness.
The current price action suggests the algorithm is in the process of seeking lower liquidity before continuation. Several inefficiencies and imbalances remain unfilled on the way down, reinforcing the expectation for a controlled draw lower into this zone.
A move into the 72.5k daily FVG would represent a rebalancing phase, not a breakdown of market structure. Once sell side liquidity is taken and price achieves equilibrium, bullish momentum is expected to return.
This area is best viewed as a higher timeframe accumulation opportunity, with the broader objective remaining a continuation toward all time highs after liquidity has been cleared. Patience is required, but the targets and roadmap are clearly defined.

BTC/USDT 4H chart📉 Trend and Structure
H4 Trend: Downtrend / Downtrend Consolidation
Sequence of lower highs + lower lows from around 95k
Currently, the price is below key resistance levels; the market has not regained its upward structure.
🟩 Key Chart Levels
Resistance
94,596 – Very strong resistance (upper range zone)
91,600 – Local resistance / consolidation center
90,748 – Flip level (former support → resistance)
Support
88,385 – Short-term support (already tested)
85,226 – Current price reaction zone
83,596 – Key structural support
80,646 – Last line of defense (if 83.6k falls)
📊 RSI (14)
RSI ~40–45 → Lack of strength Buyers
No bullish divergence
RSI has not returned above 50 → trend remains bearish
📉 Stochastic RSI
Recently in the overbought zone → downward trend
This confirms a correction/further weakness
No confirmation of an upward impulse
🧠 What does price action say?
Last candle: strong upward rejection
No follow-through after bounces
Any upward breakout is sold
📌 Scenarios
🔴 Baseline scenario (more likely)
Consolidation / further decline to:
83,600
and with market weakness even 80,600
Shorts have an advantage below 88,400
🟢 Alternative scenario (bullish)
Conditions:
H4 close above 88,400
Then breakout and hold at 90,700
Only then:
Targets: 91,600 → 94,600
Without this = only corrections in a downtrend

BITCOIN PREDICTION – GAME PLAN📊 Market Sentiment
Market sentiment is currently extremely bearish. We continue to see consistent outflows from Bitcoin ETFs. In addition, the Fear & Greed Index is sitting at 22 (Fear zone) and has remained there for some time.
Bitcoin has largely decoupled from the S&P 500 (US markets), and capital does not appear to be flowing into crypto at the moment. Unless a new and strong narrative emerges, I do not expect the market direction to change.
Today’s CPI data came in at 2.7% versus a 3.1% expectation, which could act as a positive catalyst for risk assets. We saw this effect clearly in U.S. equities; however, Bitcoin and the broader crypto market remained unresponsive. This further confirms my view that sentiment remains aggressively bearish.
📈 Technical Analysis
Price has been in a clear downtrend for some time. Over the past month, Bitcoin has been consolidating within a tight range.
In my opinion, this consolidation is more likely to resolve to the downside. While risk assets such as US100 continue to push higher, Bitcoin’s inability to follow reflects clear relative weakness.
📌 Game Plan – Prediction
I am monitoring two main scenarios:
Scenario 1 (Red Line – More Likely)
I expect price to decline toward $80,500, where we may see a short term bounce. However, I believe this bounce will fade, with the primary downside target at $74,500.
After price runs $74,500, I will be looking for potential long/buy opportunities.
Scenario 2 (Black Line)
Price first moves up toward $96,000, gets rejected from that level, and then closes back below it. From there, I expect continuation to the downside toward $80,500 and potentially $74,500.
💬 For deeper sentiment and strategy insights, subscribe to my Substack free access available.
This analysis is for educational purposes only and does not constitute financial advice. Always conduct your own research before trading or investing.

Bitcoin important supportsOn 4h timeframe we can easily see that BTC will go down. Key supports for now:
$85103
$83600-$83000
$80600-$79800
and lowest for now $76700.
WWV continuing going down. Bulls pressure almost not existing, looks like total capitulation.
Those levels above it's just matter of time. Look like it's worthy to play short on every single bounce up.

BTCUSDT. Structure, Risk, and Directional BiasBTC continues to trade below a well-defined descending trendline, keeping the higher-timeframe structure bearish. As long as price remains below 92,500 – 93,000, upside moves should be treated as corrective, and directional conviction remains limited.
The 85,500 – 84,500 zone is acting as a key demand area and is currently supporting price. Holding above this region keeps BTC in a compression phase between demand and trendline resistance. However, this bounce is not yet a confirmed reversal and should be viewed as a reaction within the existing structure.
A confirmed breakout and acceptance above the descending trendline, aligned around 92,500 – 93,000, would invalidate the bearish structure and signal a potential momentum shift. In that scenario, upside continuation toward 96,000 and potentially 100,000 becomes likely.
On the downside, failure to hold the 84,500 demand level would invalidate the current reaction and expose 82,000, followed by the 80,500 major support, where stronger buyer interest is expected.
Until confirmation occurs, disciplined risk management remains essential. Patience is required while the market resolves this compression and reveals its next directional move.

BB indicates imminent expansion for $BTCOn the 1D timeframe, price remaining inside a descending channel, below a thick bearish Ichimoku cloud, with Bollinger Bands compressing and repeated rejection at the BB midline, structurally favors a bearish continuation after volatility expansion unless a decisive daily close above the mid-band and channel resistance occurs.

BTC Reversal after Re-SweepWhile global Bitcoin Elliot Wave count is under the question, local situation seems to be pretty clear
I expect Re-Sweep of current low at 80k and reversal after

My idea on BTCUSD seeing the 1D timeframeThese are the two possible scenario's that I have in mind for this dip.
Do you see the similarities with April earlier this year too?
It is hard to predict what will happen in future especially when it comes to crypto assets, but my feeling says that scenario 2 will play out.
Be patient and watch the daily chart as this needs some time anyway. I think that if we would see another dump, then $80.5k would be the very lowest (not 75k), because the MACD shows a bullish divergence on the 1D (higher low) just like in April earlier this year.
Be careful with leverage trading these days! See this moment as a great discount to DCA at. What do you think which scenario will playout?
What do you think that will happen in the next few days/weeks/months?
Leave your comment below and follow me if you liked my idea!:)

EcoByG Bitcoin Daily Analysis #15 — Daily BTC Market UpdateWelcome to My Analysis
“The market hasn’t reversed yet.
it’s just catching its breath after the hit.
Let’s go through this calmly and step by step,
no rush, no hype.
1️⃣ Market Structure – Is the market still bearish?
If we look at the 1-hour timeframe,
the market behavior hasn’t changed:
Highs are still forming lower
Lows are also forming lower
So we’re still in a Lower High / Lower Low structure.
Yes, the 85.1k low has held for now,
but there’s an important point:
The previous high has not been broken
There are no signs of a Change of Character (ChoCH)
The recent upward move looks more like a
post-drop pullback,
not a real phase change.
📌 Structurally, the market is still bearish — or at best neutral to bearish.
---
2️⃣ Price vs. Moving Averages – Below the ceiling or above it?
Where is price right now?
Still below SMA58
Still below SMA99
MA99 is sitting above price and acting as a structural ceiling.
Each time price approaches these MAs,
it gets quickly rejected.
📌 Simple translation:
Until price can hold above SMA58,
there’s no reason to expect a trend change.
---
3️⃣ Key Price Zones – Where does it matter?
🔴 Resistance zones (seller activity):
88,600 – 88,800
Former support, now major resistance
89,700
92,200 – 92,300
Heavy higher-timeframe resistance
📌 The market’s reaction to 88.6k is critical
this level will define the next move.
---
🟢 Support zones (possible pauses):
85,150 – 85,000
Current valid low
83,980
82,500
80,600
Major structural low
📌 If 85k breaks,
the risk of continued downside increases significantly.
---
4️⃣ Volume – What is big money doing?
At the lows,
we saw a volume spike,
usually a sign of liquidations or panic selling.
But during the recent bounce:
Volume has been average
No signs of aggressive buying
📌 Meaning:
Smart money isn’t in a rush to buy yet.
The market is simply digesting the drop.
---
5️⃣ Momentum (RSI) – How much energy is left?
RSI has bounced from oversold, but:
Still below 50
Lacks sustained strength
In simple terms:
Selling pressure has eased,
but buyer strength hasn’t entered the game yet.
This RSI behavior signals a pause, not a trend reversal.
---
When can we even think about a bullish shift?
Only if all of these happen:
1. A 1H close above 88.6k
2. Price holds above SMA58
3. RSI stays above 50
📌 Before these conditions,
every pump you see is just a pullback.
Final Words
1H trend: Still bearish
Market state: Pause after a drop
Buying now?
❌ High risk
❌ Against structure
Logical decision:
Wait or sell weak pullbacks with a clearly defined stop-loss.
⚠️ Risk Alert ⚠️
Futures are not beginner-friendly. These triggers require solid experience.
Before using them, study risk management and practice with the learning content here.
Join us: #SorooshX

BTC-USDTIt’s still above its static level at $85,000📣🎤
On the other hand, if this support holds today and the static resistance at 87,700 is broken 🔥➡️
It could also rise toward its next targets 🔼💸

BTCUSDT - Intraday Long From Demand Zone?Alright traders, here’s a clean intraday idea — no moon talk, no hopium overdose, just logic.
BTC is currently chilling in a sideways range between 85k–90k after the recent correction.
On-chain and bull-market indicators are still far from anything euphoric, so no signs of a cycle top panic just yet.
Also worth noting:
Yesterday we saw strong ETF inflows (~457M USD), which fits nicely into the classic
“buy the dip, ask questions later” narrative.
Now the fun part — liquidity.
Coinglass is showing:
• long liquidity stacked below around 84–85k
• heavy short liquidity above in the 89–92k zone, especially near 92–93k
Which gives us the classic scenario:
👉 flush a bit lower
👉 grab liquidity
👉 squeeze higher into the short cluster
⸻
The Plan (Simple and Clean)
I’m looking for a long from the demand zone around 85–86k.
• Entry (limit): 85,700
• Stop loss: 84,700
(clean break below = likely move toward deeper 82k liquidity)
• Target: 89,300
(first liquidity pocket below 90k)
That gives us a very decent R:R around 1:3.5+, which is exactly what we want for intraday trades.
This is purely a range mean-reversion play inside the 85–90k box, especially ahead of important macro data.
⸻
Important Rules (No Exceptions)
• Limit order is valid only until 14:30 CET
• If it doesn’t fill before macro → cancel the order
• No averaging below 85k
• Stop loss is respected, no hero trading
This is an intraday idea, not a marriage proposal.
⸻
BTC does BTC things, macros do macro things, and liquidity does what it always does.
Let’s see if the market plays the script this time.
Trade safe, manage risk, and let the range do the work 📊🚀

Bitcoin Analysis | Decision Time at $85K Alright traders, make sure you read this analysis carefully —
this is one of the most important ones in a long time.
After weeks of waiting, Bitcoin has finally reached the $85,000 level, and this is a major decision zone.
At the moment, Bitcoin Dominance is rising, which tells us one clear thing:
fear is increasing in the market.
Money is flowing out of altcoins and into Bitcoin, as participants try to reduce risk in case we lose the $85,500 support.
At the same time, the Fear & Greed Index is at 24, sitting deep in the Fear zone and close to Extreme Fear.
What’s the Market Telling Us?
The probability of a breakdown below this level is not low.
Because of that:
🔹 First priority: Risk management
🔹 Second priority: Execute your strategy properly
Personally, even though I still hold an Ethereum position, I’m actively looking for short setups on altcoins, not on Bitcoin itself.
Why?
Because Bitcoin dominance is already very high, which usually means Bitcoin has less downside momentum compared to altcoins.
But There’s Another Scenario…
We also need to respect the possibility of a rejection from this zone and a move upward.
That’s why I strongly recommend:
✔️ Watching altcoins that are bullish against BTC .
✔️ If we get a rejection and move up, those coins can offer much cleaner long setups than Bitcoin itself
Why I’m Willing to Take Risk Here
If you’ve been following my analysis consistently, you know that for the past 30 days I’ve been telling you to trade very cautiously.
But this area is different.
This is one of those zones where I personally take risk and do NOT want to miss positions.
Why?
Because all the profits made over the last 3 weeks are there exactly for moments like this.
If this zone breaks, it can unlock much bigger and cleaner opportunities.
Final & Most Important Reminder ⚠️
Even though this is a critical Bitcoin level,
this is NOT an excuse to go all-in.
Never put all your capital into the market.
That is not smart and not sustainable.
My Risk Management (Short Version)
I define maximum loss limits for:
Daily
Weekly
Monthly
If I hit my daily loss (for example 2%), I close my laptop and stop trading for the day.
If that happens more than 3 times in a week,
I stop trading for the rest of the week.
Same logic applies to the monthly plan —
after two bad weeks, I stand aside completely.
This approach is what keeps you alive in the market.
Trade smart, manage risk, and don’t let emotions control your decisions.
Stay safe & profitable 💰🔥


Outlook on BITCOIN (sell to buy)Seeing continuation of BEARS, untill the BULLS take charge from 73600

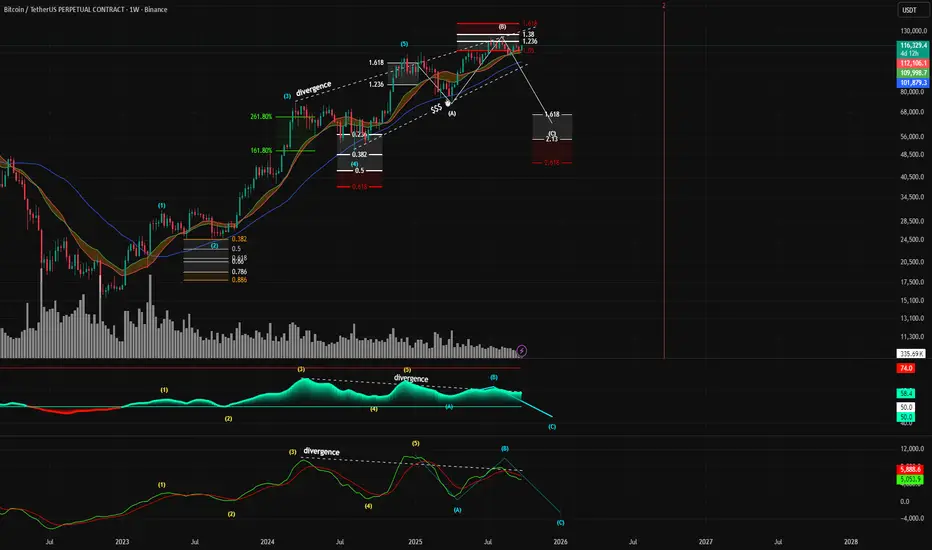
Expanding Flat Elliot wave countBitcoin may be approaching a significant macro top, with multiple technical indicators aligning to signal a potential reversal and a subsequent major corrective wave.
Key Projections:
Potential Top Formation: The current price action is forming what appears to be the peak of a corrective Wave (B), with a potential top range between $109,000 and $150,000.
Projected Corrective Target: Following the completion of Wave (B), a significant downward move, labeled as Wave (C), is anticipated. This corrective wave targets the $45,000 - $67,000 price zone.
Timeline: The entire corrective structure, from the formation of the top to the potential bottom of Wave (C), is projected to unfold by approximately September 2026.
Elliott Wave Structure: The primary thesis is based on an Elliott Wave count. The chart indicates the completion of a five-wave impulse cycle, and the market is now in a larger A-B-C corrective pattern. The current price is likely forming the peak of the B-wave.
Fibonacci Confluence: There is a strong confluence of Fibonacci extension levels at the potential top. The peak of the current Wave (B) is precisely testing the 1.618 Fibonacci extension level, a critical ratio often associated with the termination of corrective waves.
Significant Bearish Divergence (Crucial Point): This is one of the most compelling signals on the chart.While the price is making higher highs (from the peak of wave (5) to the peak of wave (B)).Both the RSI and the MACD indicators are showing lower highs. This is a classic, multi-indicator bearish divergence on a high timeframe (weekly), indicating that the upward momentum is weakening significantly and a trend reversal is becoming more likely.
BTCUSDT Analysis : Bearish Setup, Bitcoin Faces Strong RejectionBTCUSDT PERPETUAL – 1 Hour Chart Analysis
Market Structure
On the 1-hour timeframe, BTCUSDT shows a strong bearish displacement from the highs, indicating clear dominance by sellers. The aggressive sell-off broke previous structure and pushed price into a short-term accumulation phase. After forming a base, price attempted a corrective move to the upside, but this recovery lacked strong continuation volume.
The overall structure still remains bearish, as price failed to reclaim key resistance zones with strength.
Reversal Zone Reaction
The highlighted Reversal Zone above current price is a critical supply area where sellers previously entered the market aggressively. Price retraced into this zone and immediately showed rejection, confirmed by strong bearish candles and long upper wicks. This reaction suggests that smart money used this area to re-enter short positions rather than allow bullish continuation.
This rejection validates the zone as a high-probability resistance, reinforcing bearish bias unless price can decisively reclaim and hold above it.
Breakdown & Momentum Shift
After rejecting from the reversal zone, BTCUSDT started printing lower highs, signaling weakness in buyers. The current price action shows sellers regaining control, with momentum shifting back to the downside. The absence of bullish follow-through confirms that the move up was corrective rather than impulsive.
This behavior aligns with classic pullback-to-supply mechanics in a bearish trend.
Liquidity & Correction Zone (CZ)
Below current price, the marked Correction Zone (CZ) represents an area where internal liquidity exists. This zone often acts as a temporary pause where price may react briefly before continuation. However, without a strong bullish pattern, this area is more likely to be a minor reaction point, not a trend reversal zone.
Traders should remain cautious here and wait for price behavior confirmation.
Target Zone & Projection
The lower highlighted Target Zone aligns with:
Previous swing lows
High liquidity resting below the range
An area where sell-side stops are likely to be triggered
The projected move indicates a potential liquidity sweep into the target zone, followed by the possibility of a technical bounce. However, the note “Need Positive Pattern” clearly emphasizes that no blind buying should be done. A bullish confirmation pattern is required before considering long positions.
Trading Psychology & Execution Mindset
This setup favors patience and discipline. The market is not offering immediate confirmation for longs. Selling rallies remains the safer approach until price reaches deeper demand and shows a clear change in character.
Professional traders wait for:
Structure shift
Strong rejection or absorption
Clear bullish confirmation at target zones
Not every zone is a trade — confirmation is king.
Final Outlook
BTCUSDT remains bearish on the 1-hour timeframe. The rejection from the reversal zone strengthens the downside bias, with price likely targeting lower liquidity zones. Any bullish opportunity should only be considered after strong confirmation at the lower target area. Until then, the market favors sellers.

The bulls have been waiting too long!Now on the daily chart I see a pattern - the base of the tweezers. This is a reversal model.
I'm waiting for new highs to remove liquidity.
Regards,
Eugene

Latest growthI think this is a logical conclusion to the current formation
Which will knock out all the shorts
Regards,
Eugene

BTCUSDT Review December 17 2025Short-term price movement ideas.
Price has tested the weekly area of interest, from which we received confirmation on the daily chart in the form of a BtS. The daily zone has already been tested, and we also have confirmation in the 4H FVG, where price is currently trading. After the test of the 4H FVG, we observed volume on the 1H timeframe in the form of an FVG. If this 1H FVG is confirmed, a short position can be considered. If not, we should expect a manipulation of the 4H high followed by confirmation on the 1H timeframe.
Be flexible, adapt to the market, and the results will come quickly. Good luck to everyone.

BTCUSD TO 80K!!!!!!!!BTCUSD took out the internal structure low with a proper rejections also off the POC looking forward for a more downward movements to 80k......

