BITCOIN → Downward trend pressure. 86K - 84K?BINANCE:BTCUSDT.P sold off all the gains associated with Tuesday and Wednesday's news. Technically, a false breakout of resistance is forming against the backdrop of a downtrend. There is no fundamental support.
Bitcoin failed to consolidate above 91800 - 94200, a false breakout was formed, and the price returned to the range. There is an imbalance zone on the chart, which the price may test before falling (weak technical and fundamental background).
The trend is downward in the medium term. A countertrend correction is forming, within which the market is facing pressure in the 94K - 95K zone. Zone of interest is 91850. I expect a retest, liquidity capture, and another phase of selling down to 88K - 86K.
Resistance levels: 91850, 92500
Support levels: 89550, 87980, 86260
The price is in the trading range of 84K - 94K. Resistance has been tested, and a double top reversal pattern has formed. Currently, a distribution phase is forming relative to the specified pattern and consolidation at 91850 - 94200. A retest of the nearest resistance could trigger a rebound and cause the price to fall further to the next zone of interest.
Best regards, R. Linda!
Trade ideas

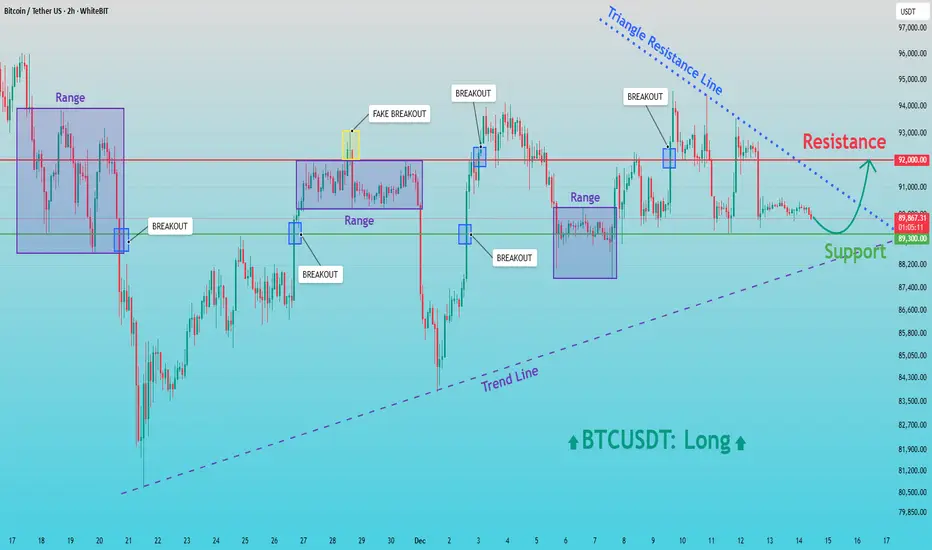
BTCUSD: Buyers in Control - Resistance Retest AheadHello everyone, here is my breakdown of the current BTCUSDT setup.
Market Analysis
BTCUSDT is currently trading within a broadly bullish structure, supported by a rising trend line that has been respected after the major sell-off and subsequent recovery. Following the strong decline, price formed a base near the lower levels and initiated a reversal, creating higher lows and shifting market control back to buyers. After the initial rebound, Bitcoin entered multiple Range phases, where price consolidated and built liquidity. Each range was followed by a breakout, confirming sustained buying interest. Some of these moves included fake breakouts, which briefly trapped participants before price continued to respect the broader bullish structure.
Currently, BTCUSDT is holding above the key Support Zone around 89,300, which has repeatedly acted as a demand area. Price is also compressing under a descending Triangle Resistance Line, while the rising trend line continues to support the market from below. This creates a tightening structure, suggesting that a decisive move is approaching. The 92,000 Resistance level remains the main barrier overhead, where sellers have previously stepped in and rejected higher prices.
My Scenario & Strategy
My scenario remains bullish as long as BTCUSDT holds above the 89,300 Support Zone and continues to respect the ascending trend line. I expect buyers to defend this area and gradually build pressure toward the upper resistance. A clean breakout above the 92,000 Resistance, especially with strong momentum, would confirm bullish continuation and open the path for a move toward higher levels, aligned with the broader trend.
However, if price fails to break the triangle resistance and loses the 89,300 Support, a deeper pullback toward the trend line could occur before buyers attempt another recovery. Until such a breakdown happens, the structure favors buyers. For now, the market remains constructive, with support holding and resistance at 92,000 as the key level to watch.
That’s the setup I’m tracking. Thank you for your attention, and always manage your risk.
BTCUSDT Bullish channel holding strongAs observed on the chart, Bitcoin is trading within a newly formed ascending channel and is currently testing the lower boundary of this structure. This level represents a strategic support zone within the bullish technical framework, offering a favorable opportunity to consider initiating or adding to long positions with appropriate risk management.
Also if this channel resistance break to the upside then market is again bullish after a while.
DISCLAIMER: ((trade based on your own decision))
<<press like👍 if you enjoy💚

When to Trade — When to Stay OutWhen to Trade — When to Stay Out: A Deep, Practical Guide for Traders
Timing is a core edge. Not every hour, session, or chart condition is trade-worthy. The difference between a profitable trader and an active losing trader is not how many trades they take — it’s which trades they take and when. This article gives you a detailed, systematic framework to decide when to trade and when to stay out, with concrete rules, time windows, checklists and worked examples.
Big-picture logic
Markets are driven by liquidity (where orders sit), volatility (how fast price moves) and participants (who is trading). Good timing aligns these three:
Liquidity concentration (institutions, marketmakers) produces cleaner, higher-probability moves.
Right volatility means enough movement to reach targets but not so much that stop losses are random.
Recognizable market structure (trends, ranges, breaks) allows rules to be applied consistently.
If any of the three is missing, edge declines and risk of random losses rises.
Session windows — when the market is most tradable
Below are standard session definitions in UTC+00:00. Adjust for daylight savings if required (noted where relevant).
Tokyo / Asian Session
⏵ UTC+00:00: 23:00 – 08:00 ( main liquidity often 23:00–02:00 UTC )
⏵ Characteristic: lower liquidity for major FX pairs, choppier price action. Exceptions: JPY crosses, pairs with Asia-led liquidity, and crypto (24/7).
London Session
⏵ UTC+00:00: 07:00 – 16:00 (most active 08:00–11:00 UTC)
⏵ Characteristic: heavy institutional flow, high liquidity. Many clear directional moves begin here.
New York Session
⏵ UTC+00:00: 12:00 – 21:00 (most active 13:00–16:00 UTC)
⏵ Characteristic: continuation or reversal of London moves; major news releases occur here.
Key overlap (best single window)
⏵ London–New York overlap: UTC+00:00 ~12:00–16:00. Highest combined liquidity and volatility; most “clean” trends and reliable breakouts occur here.
Rule of thumb: Prefer intraday trades during the London session and the London–New York overlap. Be selective in Asia unless trading JPY pairs or range-break strategies designed for low liquidity.
Concrete: Best times to trade (prioritized)
Session open impulse — first 60–120 minutes of London or New York sessions.
Overlap window — London + New York overlap (UTC+00:00 ~12:00–16:00).
Post-news verified moves — 10–30 minutes after high-impact macro prints, if market structure becomes clear and isn’t just noise.
Clear breakouts after consolidation during active sessions (volume confirmation, sweep of liquidity, not just a one-bar spike).
When to avoid trading (and why)
Low-volume Asian hours for majors — price tends to chop and give false signals.
Right before major macro releases (NFP, CPI, FOMC) — price can gap or spike unpredictably. Exceptions: defined volatility playbook with strict hedges.
Midday lulls after initial session impulse — often flat ranges and low edge.
On unclear structure / messy price action — wide, overlapping candles, no clear swing highs/lows.
During market holidays or early close days — liquidity is thin; spreads widen.
Pre-trade checklist
Time window OK? (London / NY open or high liquidity event)
Major news? (No significant release within ±30 mins)
Higher timeframe structure clear? (H4 or Daily trend / range)
Trade idea defined (entry, stop, target) — use price levels, not indicators only.
Risk per trade ≤ planned % of account (see position sizing).
Reward : Risk ≥ your minimum (e.g., 1.5–3:1 depending on edge).
Catastrophic stop capability confirmed (can you absorb worst-case slippage?)
Exit rules set (profit-taking scale or full exit)
Trade logged in journal immediately after (reason, setup, time, bias)
Position sizing — exact worked example (step-by-step)
Use a fixed % of equity for risk per trade (commonly 0.5%–2%). Example uses 1% risk.
Assume:
Account size = $10,000.
Risk per trade = 1% of account = $10,000 × 0.01.
We compute digit-by-digit: 10,000 × 0.01 = 100. So maximum $100 risk on this trade.
Generic position-size formula:
Position size (units) = (Account Size × Risk%) ÷ (Stop Distance in price units × Value per price unit per 1 unit)
Always recalc pip/value for cross rates and for instruments (stocks, futures, crypto) — adapt the “value per price unit” accordingly.
Money Management is much more important than a strategy. You should learn Money Management before trying any strategy.
Order types & execution rules
Limit entries at confluence levels (support/resistance + liquidity sweep zone) — better price and less slippage.
Stop orders for breakout entries — use when you want to enter only after momentum confirms.
OCO (One Cancels Other) for scaling / invalidation management — reduces manual errors.
Avoid market entries during major news due to slippage/gap risk, unless your plan accounts for it.
Trade management & exits
Initial target: defined by structure (previous swing, ATR multiples, measured moves).
Scale out: consider taking partial profits at the first reasonable target, let the rest run with a trailing stop.
Stop relocation: only move stop to breakeven after a predefined profit multiple reached (e.g., after +1R or after price clears a new structure). Don’t move stops based on emotion.
If price returns and breaks your entry zone invalidating the setup, exit — the market changed.
Strategy-specific timing tweaks
Trend-following: prefer strong sessions (London/NY) and avoid Asian low-liquidity hours. Enter on retracements that align with higher timeframe trend.
Range / mean-reversion: worst during session opens; best during mid-session lulls, but only if volatility is low and boundaries are clear.
Breakout strategies: require confirmation — e.g., breakout during overlap or accompanied by increased volume / volatility. Avoid breakouts in thin Asian hours.
News scalping: high risk; only for experienced traders with defined entry, strict spread/latency controls, and capital to absorb spikes.
Common mistakes (and how to fix them)
Trading outside your chosen time windows — fix: enforce a trading clock.
Overtrading in chop — fix: increase minimum R:R and wait for clear structure.
Ignoring spreads and liquidity — fix: include spread in stop/target math and avoid thin sessions.
Moving stops prematurely — fix: use rules (e.g., only move after +1R).
Trading news impulsively — fix: have a news plan: either avoid or have a predefined volatility playbook.
Emotional trading (e.g. not closing the position when the price hits stop-loss)
Psychological & routine rules
Trade only when rested and focused.
Limit screen time to your pre-set sessions.
Keep a journal: reason for trade, outcome, lessons. Review weekly.
Daily routine: pre-market scan 30–60 minutes before your active session, post-session journal entry.
FAQ
Q: Can I trade during Asian hours?
A: Yes — but selectively. Prefer JPY pairs, Asia-centric instruments, or strategies built for low volatility.
Q: What if my timeframe and session disagree?
A: Give priority to higher timeframe structure. If H4 / Daily shows trend, trade during active sessions for better fills.
Q: How much should I risk per trade?
A: Conservative traders use 0.5%–1% per trade. More aggressive ones use up to 2%. The key is consistency and drawdown planning.
Focus your trading during high-liquidity windows (London, New York, and their overlap), avoid low-volume and pre-news periods, always validate trades with liquidity + volatility + clear market structure, use strict risk management (e.g., 1% per trade with position sizing), and follow a pre-trade checklist to avoid low-quality setups. Better timing = better edge.
Enjoy!
Lingrid | BTCUSDT Potential Bullish Trend Continuation SetupBINANCE:BTCUSDT is holding above the trendline after defending the higher-low zone, keeping the broader bullish structure intact. The recent pullback swept short-term liquidity before price stabilized near the 89,000 support band, where buyers stepped back in. This behavior suggests the move lower was corrective rather than the start of a reversal.
As long as price remains supported above 89,000 and respects the ascending structure, CRYPTOCAP:BTC has room to grind higher toward the upper resistance cluster around the weekly high near 96,000. A successful push through that zone would signal trend continuation, while short-term consolidations along the trendline remain constructive for further upside.
➡️ Primary scenario: higher lows hold → continuation toward 96,000 resistance area.
⚠️ Risk scenario: loss of 89,000 support invalidates the bullish setup and shifts focus back toward deeper support.
If this idea resonates with you or you have your own opinion, traders, hit the comments. I’m excited to read your thoughts!

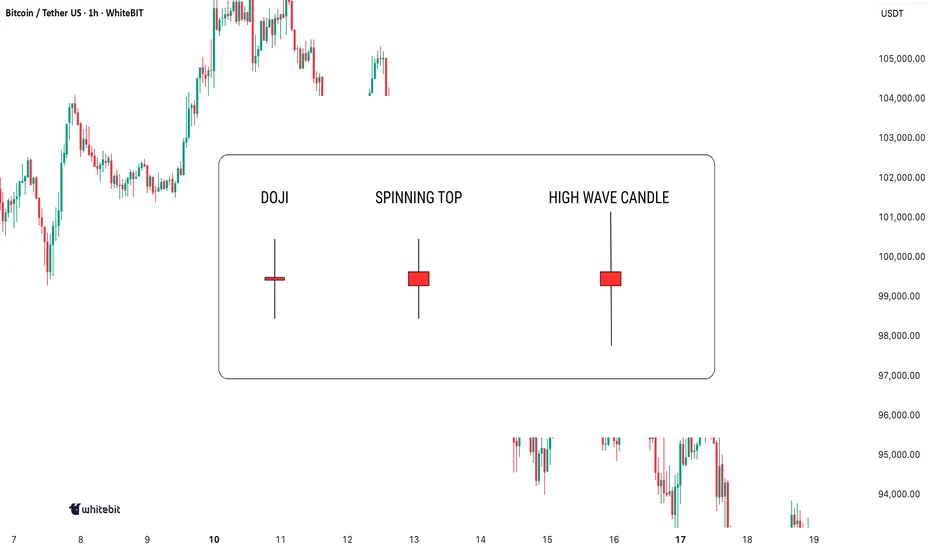
Indecision on the Chart: What These Candles Really MeanIndecision in the market? You're not alone. Every trader has faced those moments when the charts seem to scream confusion. But here's the thing: indecision candlestick patterns aren't just noise. They hold secrets that, when decoded, can give you the upper hand. Let's dive in and learn how to spot these patterns and use them to your advantage.
Mastering Indecision Candlestick Patterns
The most well-known indecision candles are the Doji, Spinning Top, and High Wave Candle. These candlesticks might seem tricky at first, but once you learn to recognize them and understand their context, they can serve as valuable tools in your trading strategy.
Doji
A Doji has a small body with nearly identical open and close prices, and long upper and lower wicks, indicating market indecision—neither buyers nor sellers gain control during that period.
When to look for confirmation: A Doji alone isn’t enough to trade. Wait for confirmation from the next candle: a bearish one after an uptrend may signal a reversal, while a bullish one after a downtrend might indicate the start of a rally.
Spinning Top
A Spinning Top is an indecision candle with a small body and longer upper and lower shadows. It indicates uncertainty, with more volatility than a Doji.
When to look for confirmation: A Spinning Top is more meaningful after a strong trend. Following an uptrend, it could signal weakening momentum. Wait for the next few candles to confirm the market’s direction.
High Wave Candle
The High Wave Candle is like the Spinning Top but with even longer wicks. It shows high volatility with no clear direction, as the price fluctuates widely but the open and close remain close, indicating indecision.
When to look for confirmation: Use the High Wave Candle with trend analysis. If it appears during consolidation or after a major move, it may signal a breakout. As with other indecision candles, wait for confirmation before acting.
Combining Indecision Candles with Indicators
While indecision candle patterns can provide useful insights, they are most effective when combined with other technical indicators. Here are some ways to use them in combination:
Moving Averages: Use moving averages (like the 50-period or 200-period) as a trend filter. If a Doji or Spinning Top forms above a moving average and the next candle confirms a reversal, it may signal trend continuation.
Relative Strength Index (RSI) : If an indecision candle forms when RSI is at extreme levels (above 70 or below 30), it may signal an upcoming pullback or reversal.
Volume: A high-volume candle following an indecision candlestick often confirms strong follow-through. Without volume, these patterns may be less reliable.
Where to Avoid Using Indecision Candles
While indecision candles are useful, there are some scenarios where relying on them without confirmation can be misleading:
Choppy Markets: Indecision candles appear frequently and may not signal real reversals.
During News Events: Sharp price spikes can create false indecision signals.
Lack of Context: A Doji in sideways price action has less significance than one after a strong trend.
Indecision candles signal uncertainty, but don’t act on them blindly. Always combine them with other analysis and make decisions based on your own judgment!
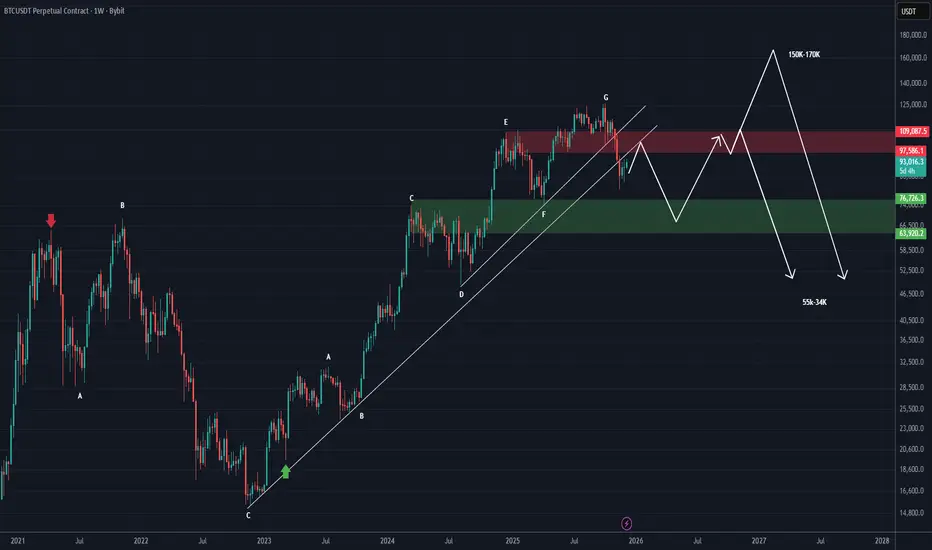
Bitcoin RoadMap (1W) | Important UpdateIt’s better to first have a complete roadmap for Bitcoin for the coming months.
We have cleaned up the chart as much as possible, making the pattern lines and range zones invisible so the chart remains uncluttered.
As you can see, Bitcoin is trading below the upward trendlines and also below the FLIP zone.
It is expected that the price will be rejected from the red zone down toward the 76K to 64K range, and then from that area it may attempt a move toward higher levels.
If the red zone is broken, the price could reach the 150K to 170K area. However, if it fails to hold above the red zone, it may drop to the 55K range and even 27K, potentially starting a bearish cycle.
This is the condition for Bitcoin | it should not be compared with altcoins, and many altcoins may even become bullish while Bitcoin is in a bearish cycle!
For risk management, please don't forget stop loss and capital management
When we reach the first target, save some profit and then change the stop to entry
Comment if you have any questions
Thank You
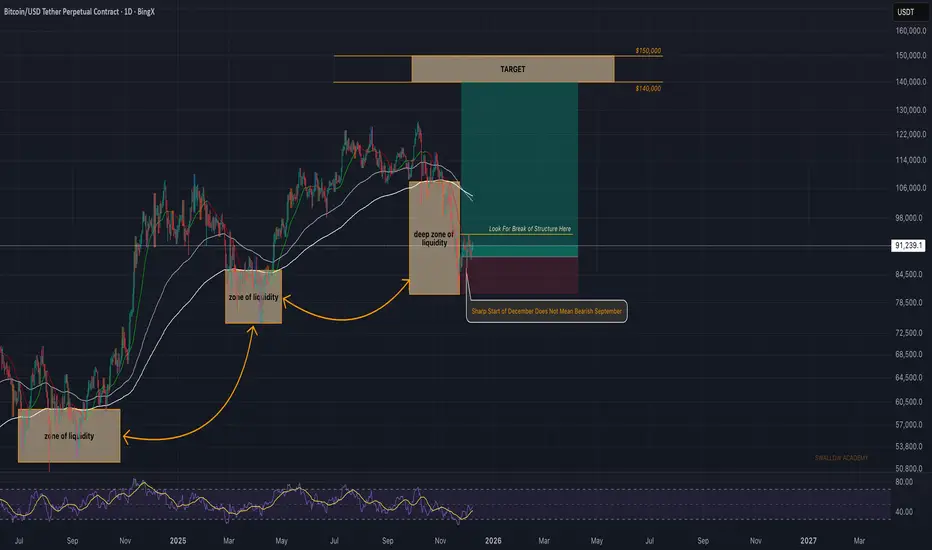
Bitcoin (BTC): All We Need Now Is Break of StructureBitcoin is accumulating currently where price is heading most likely for a break of structure (Which would confirm our bullish gameplan). As soon as we see the breakout we will be looking for a long position right there!
Swallow Academy
Bitcoin Trading range between two Points Resistance or Support Bitcoin Price is currently fluctuating within a defined range between 92k and 89K. The highlighted zone shows a period of consolidation with both bullish and bearish reactions inside the range.
Technically Bitcoin is maintaining its position inside this channel, but the overall structure is leaning bearish as price repeatedly tests the lower boundaries focus on the key levels, price may decline deeper toward the next major support areas at 87K and possibly 85K
If price holds above 90K a bullish rebound is possible, with potential upside targets at and 93K further at the upper channel level near 95k bullish scenario, where price bounces upward and breaks the upper region of the range, rising toward the marked targets.
If the price reacts to the bearish side where price fails to hold above support and follows a downward continuation downside then support level would be 87K to 85K,
You may find more details in the chart,
Trade wisely best of luck buddies.
Ps; Support with like and comments for better analysis thanks for supporting.

TradeCityPro | Bitcoin Daily Analysis #246👋 Welcome to TradeCity Pro!
Let’s move on to Bitcoin analysis. The market has been ranging for a few days, but it still gives positions, and if we stay behind the chart, we can make profits from the market.
⏳ 1-hour timeframe
On the 1-hour timeframe, Bitcoin has formed a range box between the 88890 and 94167 zones, and for several days it has been moving between these two areas.
✔️ Currently, near the bottom of the box, the price has created a smaller range between 89849 and 90590, and since today is Saturday and volume is low, it is ranging between these two zones.
💥 If the price exits this box, the next move can continue toward either the top or the bottom of the main box.
🔔 That means with a break of 89849, the move can continue down toward 88890.
🎲 But if 90590 breaks, I will wait for a higher low and higher high to form above this zone, and then I will enter a long position.
⛏ The next resistance zones for Bitcoin are 92942 and 94167.
🧩 We get confirmation of Bitcoin turning bullish with a break of 94167. In that case, an upward move in higher cycles can begin.
⭐ On the other hand, if the price stabilizes below 88890, it can move again toward the 84000 support.
❌ Disclaimer ❌
Trading futures is highly risky and dangerous. If you're not an expert, these triggers may not be suitable for you. You should first learn risk and capital management. You can also use the educational content from this channel.
Finally, these triggers reflect my personal opinions on price action, and the market may move completely against this analysis. So, do your own research before opening any position.

Get Funded and make $20 000 Monthly. Complete plan for 2026.Hey traders let's have a look at prop trading again. It's a great opportunity for the skilled traders who has good strategy, discipline and mastered risk management. Let's start with the numbers which many traders and misunderstood.
📌 Prop firm facts
- $100K account with 10% max drawdown means you got $10K account, not $100K
- Goal of 10% to pass phase 1 while you can risk 10% means 100% gain
- Goal of 5% to pass Phase 2 while you can risk 10% adds another 50% gain.
- You will literally be funded after making 150% not 10% and 5%
⁉️ Does it mean it's impossible to get funded ?
Yes it's possible, next to good strategy you need, discipline and mainly you just need to adjust your risk management. If you make 150% in year as a Hedge fund manager you will be a superstar trader. Yet people still want to pass prop challenge in a less than week or in a few trades which means not sticking to the risk management.
🔗 Click to the picture below to Learn more about Prop Risk management 📌 How to make $20 000 a month ? Magic of 3%
Yes, you actually need to make only a 3% a month. Is it difficult ? No, It's not. You need 3 wins with 1:2 RR while risking 0.5% Risk.
1️⃣Your Ultimate goal - -$100K Funded account - 3% Gain - 80% Profit split = $2400 Payout
2️⃣Let's take it to $20 000 a Month
Don't try to increase your % gains per month, increase your capital under management
- Get another 4 x $ 100K Challenges pass them - You will have $500K AUM:
- $ 500 000 - 3% Gain - 80% Profit split = $12 000
3️⃣Reinvest buy another 3 - 5 challenges aim for $ 1000 000 funded across few solid props firms. 🎯 $ 1000 000 - 3% gain - 80% Profit Split = $24 000 Payout
📌 Have a long term plan
this is not gonna happen in few months. It's a year plan - But you got this... 💪
With approximate cost of $500 - $600 per $100K challenge you will need to spend apron. $5500 to get $1000 000 funding. You will fail some, its unavoidable, so let's count with more might $10K. But still , you can start with first $100K an then reinvest to another challenges. You dont need $10K investment right now. But later this $10K and 3% gain and 80% profit split is $24 000, even more then $20K.
📌 Difficulty is not technical, but in patience
I speak from experiences that my biggest mistakes was trying to pass quickly or when I was in drawdown I started to gamble. Be patient and stick to the rules. If we stick to 3% a month without progressive risk management it would be 4 months to get funded. If you do progressive risk management you can do it faster, and once you are confident you can run multiple challenges at the same time.
📌 Long term plan requires perfect planning
Find 60 minutes just for yourself and this about these questions below, write the answers to to the paper, think about the execution of your project. I know you didn't do it now, but come back to this and do it again. You need to visualize your future successful yourself and remind that visualization every day. I recommend a book - Psycho-cybernetics from Maxwell Maltz it will help you define your self-image of successful trader in the fact this book will change your life.
📌 Essential Rules for Prop Trading
-Its not a straight forward game
-Reduce number of trades - Only A+ Setups
- Grow Your Capital Under management in multiple firms not % gains
- 3% is a golden profit in prop space to live from trading
❌ Dont do this
If you don't trade well on small account, getting prop firm will not change it.
Don't expect it to be a solution to bad financial situation. It's extension. 🧪 Trading is not hard we often overcomplicate it
I believe you already few great trades in a month, but you also have many unnecessary ones, look at your last few month results and check if would be able to make 3% if you excluded those unnecessary trades. I sure you could ant thats what you have to do
Switch from machine gunner to a Sniper.
Write this on a paper and put it somewhere so you see it every day.
🎯 $ 1000 000 - 3% gain - 80% Profit Split = $24 000 Payout
🎯 $ 1000 000 - 3% gain - 80% Profit Split = $24 000 Payout
🎯 $ 1000 000 - 3% gain - 80% Profit Split = $24 000 Payout
$1000 000 Funding !! - Your ultimate goal for 2026 💪
I promised myself I’d become the person I once needed the most as a beginner. Below are links to a powerful lessons I shared on Tradingview. Hope it can help you avoid years of trial and error I went thru.
📊 Sharpen your trading Strategy
⚙️ 100% Mechanical System - Complete Strategy
🔁 Daily Bias – Continuation
🔄 Daily Bias – Reversal
🧱 Key Level – Order Block
📉 How to Buy Lows and Sell Highs
🎯 Dealing Range – Enter on pullbacks
💧 Liquidity – Basics to understand
🕒 Timeframe Alignments
🚫 Market Narratives – Avoid traps
🐢 Turtle Soup Master – High reward method
🧘 How to stop overcomplicating trading
🕰️ Day Trading Cheat Code – Sessions
🇬🇧 London Session Trading
🔍 SMT Divergence – Secret Smart Money signal
📐 Standard Deviations – Predict future targets
🎣 Stop Hunt Trading
🧠 Level Up your Mindset
🛕 Monk Mode – Transition from 9–5 to full-time trading
⚠️ Trading Enemies – Habits that destroy success
🔄 Trader’s Routine – Build discipline daily
🛡️ Risk Management
🏦 Risk Management for Prop Trading
📏 Risk in % or Fixed Position Size
🔐 Risk Per Trade – Keep consistency
EMA 34 & 89 Signal That the Uptrend Is Still Not ConfirmedHello everyone,
BTC is currently in a clear transition phase as the 34 EMA (red) remains below the 89 EMA (blue), or has only barely crossed upward without forming enough separation to confirm a new bullish trend. Price is hovering around 91,000–92,000, sticking closely to the EMA cluster, which at this stage acts more as dynamic resistance than a reliable support. Looking left on the chart, the 92,000 zone corresponds to the previous distribution top — a major supply area filled with trapped orders — making any breakout attempt even more difficult. In other words, BTC is simply retesting the 34–89 EMA cluster combined with old supply, and the probability of a strong immediate reversal is relatively low.
From a macro perspective, the hesitation becomes even more understandable. The Federal Reserve and its rate-cut path remain the biggest variables: markets expect further cuts, but nothing official has been delivered. Without clarity on how dovish the Fed intends to be, major funds are unlikely to aggressively rotate into risk-on assets like crypto. Liquidity inflows also remain muted — no new spot ETF catalysts, no institutional accumulation announcements, and on-chain data shows no strong capital inflow into BTC. As a result, price has enough momentum to retest EMAs, but not enough to break through resistance and establish a sustainable uptrend. Sentiment is also mixed: short-term traders are taking profit into resistance after the recent dump, while buyers prefer to wait for clearer Fed signals, limiting the strength of any chase buying.
Given this backdrop, I still view the current recovery as a technical bounce within a broader weak structure. With the 34 EMA yet to meaningfully separate above the 89 EMA and price still fluctuating around 91–92k, BTC needs one of two conditions to confirm a real breakout: either a strong positive catalyst (aggressive Fed cuts, significant USD weakness, or a clear return of ETF inflows), or a deeper pullback into lower-timeframe demand to build a base first. My preferred scenario is continued choppy movement around the 34 & 89 EMA cluster; and if price keeps rejecting 92k and eventually closes a 4H candle below 90k, the likelihood of revisiting 88k–86k increases before any strong and sustainable rally can take shape.

BTCUSDT Long: Demand Strength Holds - Market Eyes 93,8K BreakoutHello, traders! The current BTCUSDT price action shows a constructive bullish structure as the market continues to respect the key Demand Zone and the rising Trend Line. After a series of reactions around demand, buyers have repeatedly defended this area, preventing further downside and maintaining the integrity of the broader upward trajectory. Earlier, the market traded inside a corrective Range, showing temporary consolidation before buyers stepped back in and pushed price away from the lower boundary. Even though BTCUSDT faced strong rejection from the Supply Zone near 93,800, the recent pullback retraced directly into a high-value demand region, where the Trend Line and horizontal support intersect. This confluence has already triggered bullish reactions in the past, signaling that buyers remain active and prepared to protect the current market structure. The presence of multiple breakout attempts and higher lows highlights sustained interest from long-side participants.
Currently, BTCUSDT is testing the Demand Zone again, holding firmly above the Trend Line while forming a potential launch point for another upward impulse. As long as buyers maintain control over this level, the market structure favors a continuation toward the upper Supply Zone at 93,800, which remains the primary upside target. A clean bullish move from demand would confirm continuation of the prevailing trend.
My scenario as long as price stays above the Demand Zone and respects the rising Trend Line, the expectation is for BTCUSDT to move higher toward the 93,800 Supply Zone. A strong reaction from demand could initiate a new bullish leg, and a confirmed breakout above 93,800 would open the path for further upside expansion. However, a decisive break below demand would invalidate this long scenario and signal deeper correction. Manage your risk!

Analysis BTC for next weekHi guys
If the level breaks cleanly and we get a strong 4-hour Marubozu candle close, then we can look for continuation to the downside.
This is not financial advice. This is not an offer to buy or sell Bitcoin.
Good luck :)

Bitcoin (BTC): Bounce From 100EMA | Respecting The ZoneBTC looks very bullish, especially with the recent bounce we had on 100EMA. The zone has been once again respected and now we are looking for further movement to upper zones.
We are keeping this gameplan until the March, that's about the max lenght we expect the markets to push, after that we should see the start of bear market.
Swallow Academy

Bitcoin Price Update Clean Clear ExplanationBitcoin trading inside a wide consolidation zone, with price currently hovering around the mid-range near 90K Multiple supply and demand zones are highlighted, giving a clear picture of where strong buying or selling reactions may occur.
If Bitcoin holds above the current minor support and builds momentum, price may Push upward through the mid-range resistance retest higher supply zones between 93K / 94K then continue climbing toward the upper rejection zone shown in the chart this scenario represents a continuation of the bullish trend if buyers stay in control.
If the price fails to hold above the local support levels breakdown is expected toward the major support at 87K if this zone also fails, the chart projects a deeper drop into the heavy demand zone around 84K this represents a potential shift from consolidation to bearish retracement, where sellers regain strength.
If you found this analysis helpful free, free to leave a comments and share thanks.

Elliot Wave B leg to C transition - SchiffPitch Fork IlustrationAfter a week long observation, Weekly Elliot Wave demonstrates us possible ABC market direction. No decision has been taken around major pivot points. I replaced A of the Fork after the major support bounce right after high swing so mid high point is B and C is the highest low after swing one more time.
Price uncertainties continue at balance point. According to my analysis, key price points to watch is 87730 and 94500. Which one is the first direction before taking out the first liquidation? No answer can be found for that, and I already close my position with TP short from 93000 after missing couple swings and hoping for a breakouts. However. Eliot wave and schiffpitch fork are also playing factors that make sense to me.
Most common scenario:
Short will start first and will SL the late longs at 87000 and a bit tail below.
It will shoot back to 92000
If short squeeze happen, can breakout next level to 97000
Here we are MSS
Second possible scenario:
It will not go down and continues as a Elliot wave B leg and right back to around 83-80k
Leg C shows Short versus Long decision on the bottom and here we are MMS.
Third possible scenario:
Trade continues as it is: A compression that goes sideways and scalps + swings further.

Bitcoin Breakdown Pullback Target Locked In📊 BTC Analysis – Breakdown With Incoming Retracement
Bitcoin has broken cleanly below the previous consolidation block, confirming a shift from neutral to bearish short-term structure. After the breakdown, price found temporary support around 90,000, where buyers are attempting a relief bounce.
Your chart highlights a likely retracement path toward the 92,500 – 93,000 zone.
This area lines up with:
The bottom of the last range (now turned resistance)
Ichimoku cloud resistance
A typical breakdown retest zone
A potential liquidity grab level before continuation
This makes it the most probable reaction zone for sellers to re-enter the market.
---
🔍 Key Technical Points
Trend: Short-term bearish after the breakdown.
Current Move: Relief bounce forming from local support.
Main Target: Retest into 92.5K–93K before resistance kicks in.
Expectation: BTC may bounce upward first, then face strong rejection from the marked zone.
Invalidation: A sustained break above 93,200 would weaken the bearish idea.

BTCUSDT – Weak Technical Rebound, Downtrend Still in ControlHello everyone, looking at the current D1 chart, Bitcoin is showing a relatively weak rebound that appears more technical in nature rather than a true trend reversal. In the context of December 2025, the market still lacks a strong enough catalyst to draw capital back into crypto, while the medium-term price structure has not improved.
From a news and capital flow perspective , BTC is clearly underperforming gold. In 2025, global capital has favored defensive assets: gold continues to print new all-time highs, while Bitcoin lacks a compelling narrative. Spot ETF momentum has cooled, the halving is already behind us, and there are no major upgrades significantly impacting supply–demand dynamics. Although the Fed has begun cutting rates, policy remains insufficiently dovish to create a strong risk-on environment for crypto. At the same time, the correction in U.S. equities has reinforced a broader cautious sentiment.
From a D1 technical standpoint , BTC remains below both the EMA34 and EMA89, confirming that the medium-term downtrend is still intact. Each rebound has formed a lower high, while buying volume is noticeably weaker than selling pressure. The 88,000–86,000 USD support zone is being tested, and the failure to reclaim EMA34 increases the risk of a downside break.
Personally, I lean toward a scenario where BTC sees another leg down toward the 86,000 level, or even 84,000 USD, before entering a new accumulation phase. A sideways range between 88,000 and 93,000 would only be likely if volatility completely dries up and the market continues to wait for clearer signals from the Fed.
What do you think? Is Bitcoin preparing to form a bottom, or is this just a pause before a deeper decline?

Swing short for BTCAfter finishing a complex and tricky wave 4 yesterday, finally last night we entered the wave 1 and this setup will be my trading plan for a swing short.
Always DYOR !

The F1 Mindset Every Trader Needs!!!Most traders behave like they’re trying to win the race on the first lap.
Full throttle. No patience. And then they wonder why they spin out before the finish line.
🏎 But in Formula 1, especially under the lights of Abu Dhabi, the winners don’t drive the fastest…
They manage the race the smartest.
And trading is no different.
Here are the three F1 lessons every trader should master:
1️⃣You Don’t Win by Being Fast => You Win by Being Controlled
F1 drivers don’t go maximum speed all the time.
They manage tyres, fuel, engine temperature, and track conditions.
In trading, your “tyres” are your capital.
Burn them early with emotional trades, and your race is over.
Consistency beats speed.
Control beats excitement.
2️⃣ Your Strategy Is Your Pit Crew
No F1 driver wins alone, they rely on a team that’s fast, disciplined, and precise.
For traders, your “pit crew” is your:
- trading plan
- risk management
- journaling
- strategy rules
- routines
When your system is aligned, your performance becomes predictable.
When it's sloppy, you get undercut by the market every time.
3️⃣ The Race Is Won on Corners, Not Straights
Every driver can accelerate on the straights.
Champions gain their advantage in the corners — the difficult, technical parts of the track.
In trading, the “corners” are:
- drawdowns
- losing streaks
- choppy markets
- hesitation
- volatility spikes
Anyone can trade a trending market.
True professionals shine in difficult conditions.
🏁 Final Lap Insight
The Abu Dhabi Grand Prix doesn’t reward the loudest driver, it rewards the most disciplined.
Trading is exactly the same.
✔ The market is your circuit.
✔ Your account is your car.
✔ Your rules are your race line.
✔ And your mindset determines whether you finish… or crash out on turn one.
Trade like an F1 driver:
calm, calculated, consistent, and always thinking about the full race, not a single lap.
⚠️ Disclaimer: This is not financial advice. Always do your own research and manage risk properly.
📚 Stick to your trading plan regarding entries, risk, and management.
Good luck! 🍀
All Strategies Are Good; If Managed Properly!
~Richard Nasr

BTC at Risk: Structure Break + RSI Warning$BTC/USDT is showing some concern on the monthly chart as price has broken below the rising wedge and is now retesting a major demand zone. Losing this zone could trigger a deeper correction.
At the same time, RSI is showing a clear multi-year bearish divergence, highlighting weakening momentum.
Until BTC reclaims the wedge support or closes back above the resistance band, downside risk remains elevated.
DYOR, NFA
Please hit the like button if you like it, and share your views in the comments section.

Bitcoin: not near breakouts for nowHey guys, BTC's setting up an intriguing consolidation pattern at $92,350 after getting rejected from yesterday's $94,221 high, and the technical structure underneath is telling a pretty bullish story despite the surface-level chop. Let me break down what I'm seeing across multiple timeframes and why this could be gearing up for the next leg higher.
On the 4-hour chart, we're dealing with a classic post-rejection consolidation phase. Price pulled back -1.40% from the 24h high but found solid support right at the EMA20 ($91,578) and has been coiling above it ever since. What's important here is the higher low structure that's forming, BTC bounced from $91,520 (24h low) and hasn't retested that level, instead building a base above $92,000. This is textbook bullish price action where dips are getting bought rather than cascading into lower lows.
The moving average stack is giving us mixed signals but leaning constructive. Price is trading above both the EMA20 ($91,578) and EMA50 ($90,985), which is your first confirmation of short-term bullish momentum. However, we're still below the EMA200 at $93,911, which is acting as the major resistance ceiling right now. This creates a clear battleground zone between $92,000 support and $94,000 resistance. The HMA55 at $91,458 is providing additional support confluence, reinforcing that $91,400-$91,500 zone as a critical floor.
Diving into the momentum indicators, the MACD is showing a bullish crossover with solid separation (MACD line at 523 vs Signal at 411). This 112-point spread indicates genuine upside momentum building beneath the surface, even though price action looks choppy. The histogram is expanding positively, which typically precedes price following momentum higher. Now, the ADX at 15.3 tells us we're in a weak trend environment, but don't mistake that for bearish. Low ADX during consolidation often means the market is coiling energy for the next directional move, and with MACD bullish, that move is more likely to be upward.
RSI at 52.2 sits perfectly neutral with massive room to run before hitting overbought territory at 70. This is ideal for swing longs because you're not buying into extended conditions. The Stochastic at 57.0 mirrors this neutrality, while the MFI (Money Flow Index) at 42.8 is particularly interesting. MFI below 50 during a consolidation phase with price holding support suggests we're not seeing heavy distribution from smart money. If whales were dumping, MFI would be diving toward oversold while price breaks support, that's not happening here.
Bollinger Bands are providing clear technical boundaries for this setup. Price is trading above the middle band at $91,404, which has flipped from resistance to support, a bullish development. The upper band sits at $93,744, just below that critical EMA200 at $93,911, creating a resistance cluster in the $93,700-$94,200 range. The lower band at $89,064 represents the extreme downside scenario, but we'd need to lose multiple support layers to get there. The current BB position (above middle, below upper) is typical of consolidation before continuation moves.
Volume analysis is revealing. Current volume at $12,060 is significantly below the average of $26,267, sitting at roughly 46% of normal activity. In isolation, low volume might seem bearish, but context matters. When price consolidates on low volume above key support levels, it typically indicates larger players aren't actively selling, they're waiting. Distribution phases show high volume with price failing to make progress. This looks more like accumulation or at minimum, a lack of selling pressure. Once volume returns, if it comes with upside price action, that's your breakout confirmation signal.
The wick analysis adds another layer of insight. Upper wicks at 33.9% versus lower wicks at 24.1% shows sellers are stepping in at higher prices (around that $93,700-$94,200 resistance zone), but buyers are absorbing that selling pressure without letting price collapse. This tug-of-war is creating the consolidation, but the fact that we're holding above $92,000 despite repeated upper wick rejections suggests demand is strong enough to eventually push through supply.
Looking at support and resistance levels with precision: Immediate support sits at $92,000 (psychological level), then $91,578 (EMA20), followed by $91,404 (BB middle). The critical support that must hold for bulls is $90,985 (EMA50), with final line in the sand at $90,800. Below $90,800, the higher low structure breaks and we'd likely see a flush toward $89,064 (BB lower) or even $88,500. On the upside, resistance layers at $93,744 (BB upper), $93,911 (EMA200), and $94,221 (24h high). A break and hold above $94,200 would be significant, flipping the EMA200 from resistance to support and likely triggering momentum algorithms.
For a concrete trading setup, here's what I'm watching: Entry zone is $92,000-$92,500, essentially current levels where we're consolidating. This gives you a defined risk entry rather than chasing breakouts. Stop loss goes at $90,800, which represents the invalidation point where the bullish structure breaks (losing EMA50 and higher low pattern). That's roughly a 1.6% risk from current price. Take profit targets: TP1 at $94,200 (2.0% gain, 1:1.25 R/R) for the conservative BB upper breakout, TP2 at $95,500 (3.4% gain, 1:2.1 R/R) for the EMA200 reclaim with extension, and TP3 at $97,000 (5.0% gain, 1:3.1 R/R) for those riding momentum. Scale out at each level to lock profits while leaving room to catch a larger move.
The key trigger to watch is volume returning on the breakout attempt. If BTC pushes toward $93,700-$94,000 and volume surges above the $26,267 average, that's your confirmation to add to positions or enter if you missed the initial setup. Conversely, if we approach resistance on weak volume (sub $15,000), that's a fade opportunity rather than a buy signal, expect rejection back to $92,000 support.
Risk-reward clearly favors the long side here with 1:2 to 1:3 setups available, solid moving average support underneath, bullish MACD momentum, and neutral oscillators with room to run. The main risk is a macro catalyst or sudden volume spike that breaks $90,800 support, but technically, the path of least resistance appears to be higher once this consolidation resolves.
What are you thinking here, are you playing this consolidation for the breakout or waiting for clearer confirmation above $94,000?
