BTC Sector 85509.64: Capital Before the Tremor🏷 BTC Sector 85509.64: Capital Before the Tremor
🏷 19.11.2025
🏷 Capital Sector. Price Slice. System of Intelligent Anticipation. Capital Mapping — before instrument touch, this price slice is the planned action of major players.
🏷 85509.64 — As of publication, price has not yet reached this level.
🏷 The price has not yet touched the level — yet the structure already knows the path.
In the silence between orders, in the weight of unfilled volumes — the whisper of capital.
This slice is not a forecast. It is the market’s mind, frozen in numbers before the moment of truth.
🏷 Sector 85509.64 is active.
Touch — not if, but when.
Capital moves in silence.
The System sees ahead.
🏷 The light at the end of the tunnel — where others see only darkness.
🏷 — The Architect, Capital Sector
Market insights

Bitcoin Holding Below 90K After Leverage Flush – Market Awaits NBitcoin is trading just under the 90K mark on BTCUSDT perpetuals, consolidating after a leverage flush that cleared out a large chunk of crowded long positions. The price action on the 1‑hour chart is now showing tighter candles and reduced volatility, reflecting a pause as traders reassess direction following the recent liquidation spike

BTC_updateHidden Bullish divergence on the weekly chart. Still stuck in the cloud. When we break trough the cloud next resistance zones are indicated on the chart. Biggest ressistance zone is the 109.000$ region. I will do an update next saturday.

OUTLOOK 1HR BTCUSD Analysis (6th Dec 2025)This is just a trade idea and not a financial advise
BUY/SELL SCENARIOS:
BUYS:
1) Body candle close above the 91445.2 level.
2) Retest the failed 1HR bearish OB at the 91445.2 level.
3) Create a 1/5M bullish engulfing candle to capitalise on BUYS towards the 95000 level.
SELLS:
1) Retest the 1HR bearish OB at the 90210.6 level.
2) Create a 3/5M bearish CHOCH with a body candle close.
3) Retest the bearish CHOCH level to capitalize on SELLS towards the 85000 level.
Happy trading guys

price reductionAccording to the chart, a price drop to the bottom of the dynamic support at $87,000 is likely.

EcoByG Bitcoin Daily Analysis #3 — Daily BTC Market UpdateHello and welcome to today’s Bitcoin daily update.
I hope you’ve seen the previous analyses.
Today I have good news—especially if you trade futures.
Is Bitcoin preparing for a big move?
In my opinion, yes.
Bitcoin is currently forming a “range inside a range,” which is often a precursor to a major move.
But so far, neither side has broken out.
There are three very important points on the chart:
1) Bitcoin is inside a larger range
Range Low: 84,600 – 85,300
Range High: 92,200 – 93,700
2) Inside this large range, a smaller range has formed
This is exactly what we call a Range inside Range,
and this setup usually appears before an explosive move.
The small range is between:
89,600 – 90,600
91,800 – 92,200
This behavior shows energy build-up.
Is the structure ready for a major move? Yes. Here’s why:
✔️ Deceleration of the downtrend
In the recent selloffs, notice that the lows are not getting significantly lower →
This is a deceleration pattern, signaling seller exhaustion.
✔️ Price is compressing under a key resistance
When price starts to consolidate tightly right below a range resistance,
we call it Compression — and it usually leads to a breakout move.
✔️ Price is far above the strong demand zone
The strong demand zone at 82,500 – 81,400
is the same area that launched the market $10K upward the last time price touched it.
Price is still well above this zone, which means:
The major buyers haven’t surrendered control.
⚠️ Risk Alert ⚠️
Futures are not beginner-friendly. These triggers require solid experience.
Before using them, study risk management and practice with the learning content here.

BTCUSD BEARISH ANALYSIS ( READ CAPTION ) Hi Traders! today 06 DECEMBER 2K25 here is my today my BTCUSD analysis please read and send me your ideas in comment section.
BTCUSD working around $89500 and market showing a strong bearish trend. start the new month IG:BITCOIN cut the rate and comeback down side, If market breakdown the area of $88500 than it is going further fastly down side.
The bearish trend is gaining momentum, with potential for further decline towards $88500and $87500. A break below $85000 could signal continued bearish momentum.
bearish scenario
PIVOT POINT (89500)
Target 1: (88500)
Target 2: (87500)
demand zone (86400) (86000)
resistance zone ( 90500) (90900)
SUPPORT AREA (85000)
please dont forget like and comment for more latest updates
This analysis for informational purposes only.trade own your risk

Bitcoin 06.12.2025Volume Profile Analysis – How Price Reacted Inside the Fair Value Area
1️⃣ First touch of the Fair Value Area – Price enters the Value Area Low (VAL) and gets rejected immediately. A typical reaction when market participants consider the zone undervalued and push price back into the range.
2️⃣ Second touch – This time the behavior shifts: price no longer shows weakness but instead signals an intention to traverse the entire Value Area. The flow starts favoring a move toward the Point of Control (POC), where liquidity is highest.
3️⃣ Near the VAH – As price approaches the Value Area High, selling pressure becomes visible. A larger entity (market maker or significant participant) finds this zone comfortable to offload positions, creating another downward reaction.
🔎 Conclusion: The sequence of reactions around VAL–POC–VAH suggests controlled behavior from high-volume participants. The key zones remain well-defined, and current reactions may guide whether price continues to expand downward or upward depending on how it interacts with the POC.

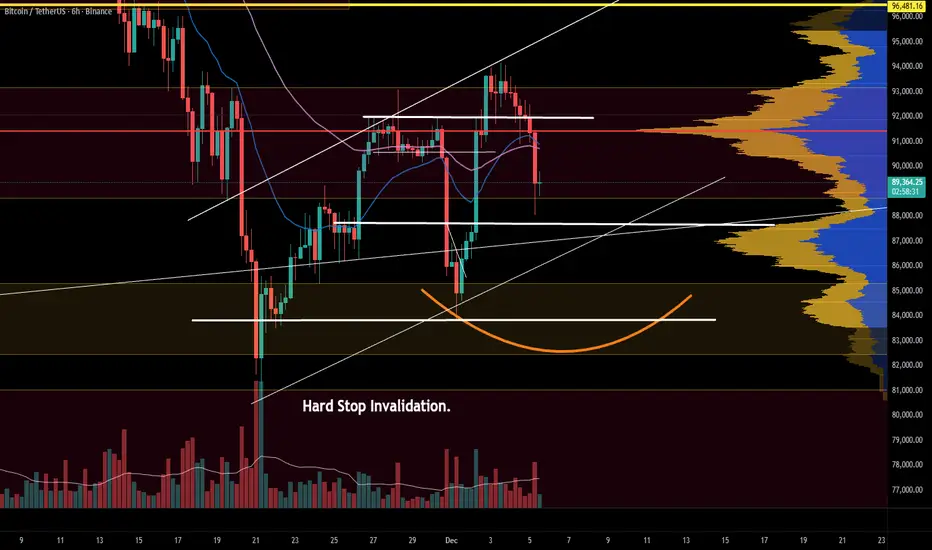
Bitcoin falling but still within structureBTC just pulled back from the mid-range rejection and is now retesting a key support cluster. The reaction here decides the next leg.
Price is sitting right on top of a major confluence zone: previous structure support, the lower trend line, and a high-volume node that has acted as a pivot multiple times. Lose this area and the “hard stop invalidation” region comes into play, which would likely trigger a deeper move toward the lower range.
Momentum indicators on the 6H are rolling over after failing to reclaim the upper band. Bulls need a higher low and a quick reclaim of the mid-range to keep momentum in their favour. Failure to do so opens the door for a broader corrective structure.
For now, the chart is simple: defend the floor or risk a larger breakdown. Reclaim resistance and the bullish continuation pattern remains intact.
What’s your read on BTC here?
THE BULL RUN IS OVERIf the bears don’t take it by force from 90k, then they would after sweeping buyside liquidity around 97k to 98k.
Patience is Payment.

BTC/USDT Analysis. Moving Within the Expected Scenario
Hello everyone! CryptoRobotics trader-analyst here, and this is your daily analysis.
Yesterday, Bitcoin continued its correction after reaching the key resistance zone.
The price has now approached $91,000–$89,800 (mirror volume zone). Volume has slightly increased at this level, but we still do not see a confident reaction from buyers.
We expect a local bounce and a potential break of the recent high once a reversal structure forms on lower timeframes — volume anomalies, buyer clusters, and a local trend shift.
If no reaction appears in this area, the decline may extend toward the next support at $87,800–$86,400 (volume zone).
At the moment, the priority remains on long setups — the upside potential is stronger, and the probability of bullish continuation remains elevated.
Buy Zones
$91,000–$89,800 (mirror volume zone)
$87,800–$86,400 (volume zone)
$84,000–$82,000 (volume anomalies)
Sell Zones
$94,000–$97,500 (volume zone)
$101,000–$104,000 (accumulated volumes)
$105,800–$106,600 (local resistance)
This publication is not financial advice.

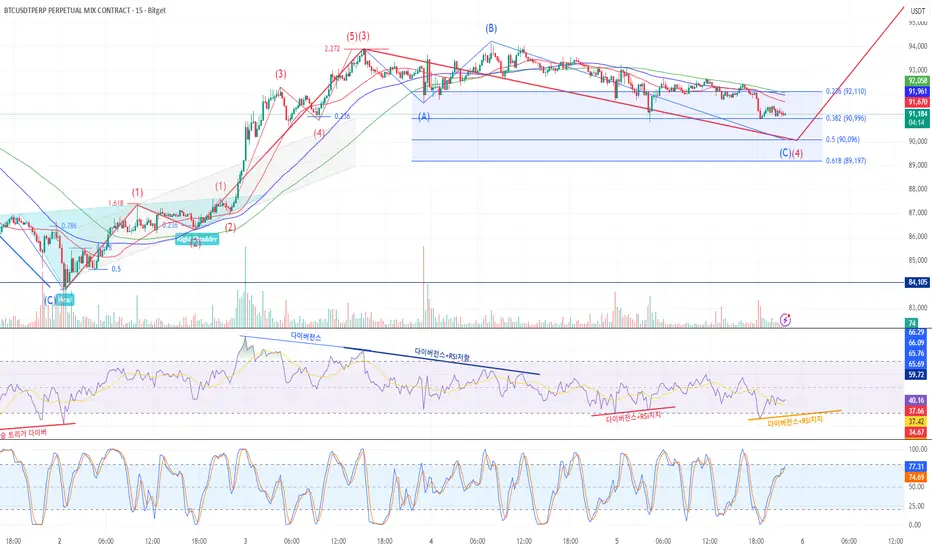
Depend on divergence and RSI support signalsBitcoin 15-Minute Chart Analysis
The larger Wave ③ initiated after a breakout above an inverse head and shoulders pattern.
Wave ③ appears to have completed near the 2.272 Fibonacci extension, followed by a divergence, signaling the start of a correction.
A mild A–B corrective rebound occurred, then another drop followed after a second divergence and RSI resistance.
Currently, moving averages remain in a bearish alignment (death cross).
Refer to Fibonacci retracement levels to gauge the depth of Wave ④.
Wave ④ completion will depend on the presence of divergence and RSI support signals.
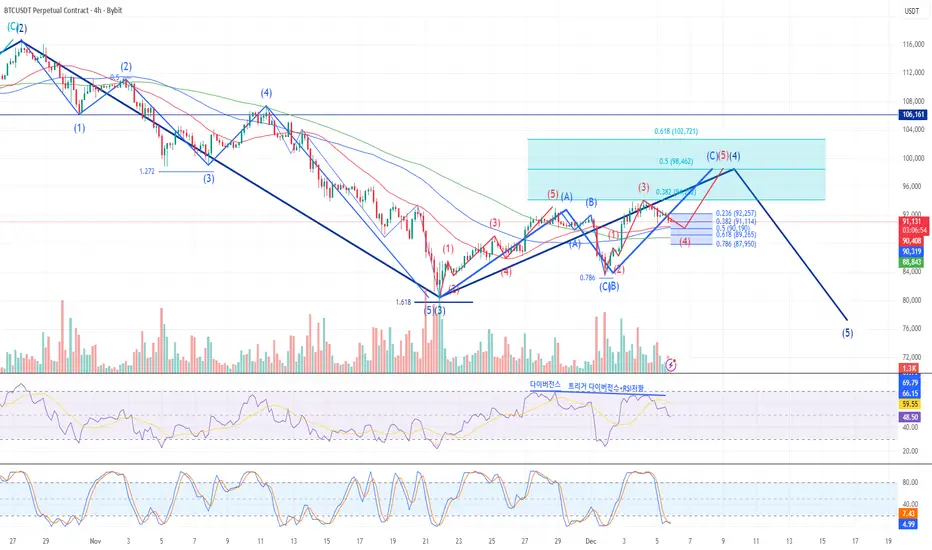
The larger Wave ③–④ structureBitcoin 4H Chart Analysis
Currently in an ABC correction within the larger Wave ③–④ structure.
Wave B completed around the 0.786 Fibonacci retracement of Wave A.
Wave C is now unfolding as an upward move.
Within Wave C, the internal 5-wave structure is in progress.
Wave ③ of C has completed, followed by a trigger divergence and RSI resistance.
Currently in a Wave ④ pullback.
Wave ④ is unfolding as an internal ABC corrective bounce.Bitcoin Daily Chart Analysis
Currently in progress: a 5-wave structure within the larger Wave B–C decline.
Wave ③ appears to have completed near the 1.618 Fibonacci extension.
After exiting RSI oversold territory, a rebound followed.
Wave ④ is unfolding as an internal ABC corrective bounce.
Wave C of ④ is currently in progress, facing resistance at the 60-day EMA, leading to a mild pullback.

BTC broke down major trendline. What's possible next? Based on Dow Theory, with BTC breaking down trendline, as long as it stays above its previous low around 74,000, it is still not bearish--side way for months to come is essentially possible. But if it breaks down the previous low, we might see corrective wave--zigzags (5-3-5) possibly to test the peak of the previous bull run in 2022.

BTC Reclaims Key Trendline Expecting Bullish WeekendBTC: One More Push to 94K Before Potential Reversal? 📊
USDT.D Elliott Wave Analysis:
Currently tracking Wave B of an ABC corrective pattern on USDT Dominance. This suggests we're in a counter-trend bounce before the final Wave C decline, which historically correlates with one more leg up in BTC.
BTC Technical Setup:
Successfully retested the descending trendline (visible on 4H)
Breaking out of the converging triangle pattern
Target: ~94,000 zone
Timeline: Expecting the move to complete by Sunday night/Monday
Key Observations:
USDT.D showing signs of exhaustion in its corrective bounce
BTC maintaining structure above support
Trendline retest providing confluence for the next impulse move
Trade Considerations:
Watch for momentum slowdown approaching 94K
Monitor USDT.D for Wave C initiation signals
Potential distribution zone forming into Monday session
Risk Management:
This could be the final push before a deeper correction. Consider:
Taking partial profits near target
Trailing stops on remaining positions
Reducing exposure ahead of the weekend/Monday transition

Bitcoin Analysis — Buyer Weakness Appearing !
Fear & Greed Index: 25 — still in Fear.
📰 Market Overview
As expected, Bitcoin broke below the $92,000 level, which I mentioned was highly probable.
Right now, the uptrend is weak, but I don’t believe it’s completely invalidated yet — a confirmed break below $90,500 would seal the deal and flip the structure fully bearish.
On the 4H timeframe, we clearly see strong buyer weakness — both in volume and candle size. That’s exactly why we just printed a large red 4H candle.
🎯 So What Should We Do Now?
🔻 My Current Position
I personally opened a short on STX, and although I haven’t reached a 2R yet,
once I do, I will definitely take profits or even close the entire trade.
Why? Because if sellers don’t step in with strength, BTC can easily continue upward.
📉 Short Trigger
$90,550 is the clean, confirmed trigger for a short entry.
But remember:
Bitcoin is in a downward daily structure — lower highs & lower lows are obvious.
So any early signs of buyer weakness give us opportunities for short positions.
If the next 4H candle fails to reclaim $92,000, the probability of further downside increases significantly.
And even if we don’t drop hard, price may stay range-bound in this zone.
📈 Risky Long Scenario
If the next candle forms a green engulfing and buyers suddenly return,
you can consider a risky long entry above $92,500 — but only if volume supports it.
🧩 About Bitcoin Dominance
BTC Dominance is currently ranging, which makes it hard to predict whether Bitcoin or altcoins will drop harder.
That’s why I picked a coin (STX) that shows clear bearish correlation with Bitcoin.
Since this might be the first leg of a drop, sellers haven’t proven themselves yet —
so if you’re already in a trade, take profits quickly.
✅ Final Notes
Thanks for reading my analysis!
Trade safe, don’t forget risk management, and stay sharp.
Good luck! 🚀📉

BTC Elliot Cycle - SellI think Bitcoin’s supercycle has ended and its impulsive wave has completed all 5 waves. It should now complete the corrective wave 2 from the higher-degree wave before continuing its upward movement again.”

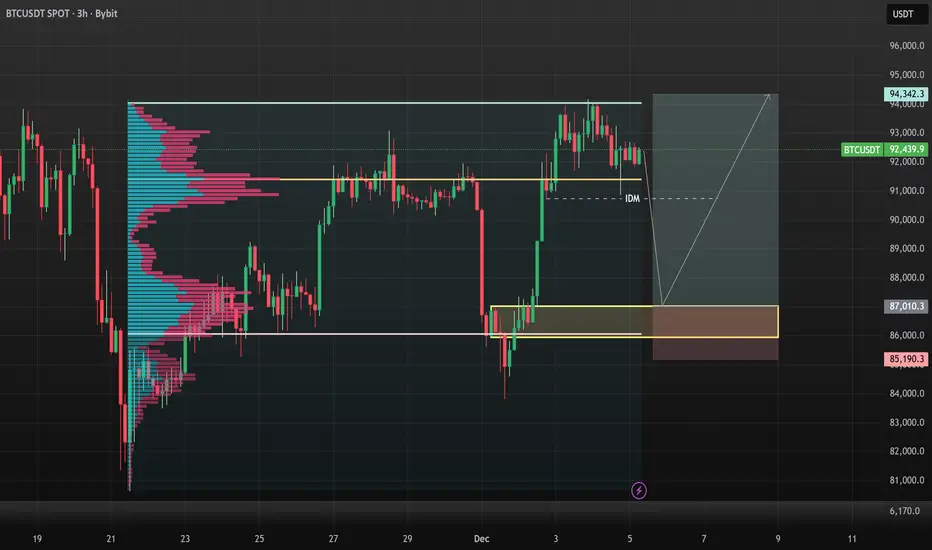
BTCUSD BUY WITH LIMIT ORDER!!!!BTCUSD on the 3h chart made a fresh breakouts off the internal structure highs and also made a strong liquidity sweep off the POC level am expecting another run off liquidity from that zone to sell down to 87k for a buying opportunity 87k will be my Limit order and my VAL point of interest....
BTCUSDT.P - December 5, 2025Price is currently in a corrective pullback within a broader intraday up swing after rebounding from the lower support band around 86,600. The key immediate support sits near 91,800–92,000, with a tighter risk level just below 93,400, while the next significant resistance and projected target lies in the 105,000–106,000 region. A sustained higher low above current support with rising short‑term momentum would favor a continuation toward that upper resistance zone, whereas a break below support would open the way for a retest of the recent lows.

EcoByG Bitcoin Daily Analysis #1 — Daily BTC Market UpdateWelcome to My Analysis.
Now, let’s break down today’s Bitcoin structure.
We can clearly see that Bitcoin has risen from the accumulation zone at 84K, moved up toward the 93K level, and is currently stuck there.
The 93K–96K area is the liquidity zone for sellers, which makes it a difficult region to break through.
To push past this level, Bitcoin either needs a whale-driven move, or we need to see stronger volume inflows.
From a broader perspective, the current range is between 84K and 94K. For a confirmed breakout and to say that the market structure has turned bullish.
we need Bitcoin to close several 4-hour candles above 96K.
On the other hand, if we want to consider a safe scenario for a move downward, then price must continue below 84K.
RSI shows us that when price reached 94K, momentum slowed down, indicating that BTC wants to take a breather. This is a reasonable area for consolidation before potentially continuing its movement in the upcoming sessions.
⚠️ Risk Alert ⚠️
Futures are not beginner-friendly. These triggers require solid experience.
Before using them, study risk management and practice with the learning content here.

BTCUSDT - Bearish ReversalBTCUSDT has formed a double top with divergence. Placing sell stop below neckline

Btc in next periodBTC will reach at least 60,000, maybe 53,400! Remember, you heard it from me! The best period to enter trades is November 7-10, 2026! Merry Christmas, everyone!
