BTC/USDT Analysis — Strong Buyer Steps In
Hello everyone! This is the CryptoRobotics trader-analyst, and here is your daily market review.
Yesterday Bitcoin surprised the market. After reaching the upper boundary of the $84,000–$82,000 buyer zone (volume anomalies), it printed a primary bounce. The movement was developing weakly at first, and we expected a deeper liquidity sweep. However, the market buyer acted much more aggressively: he broke through the key sell zone at $89,800–$90,800, shifting the priority direction to bullish.
We are now approaching the important resistance zone at $94,000–$97,500. A correction from this region is likely, and it may provide an opportunity to join long positions with extended targets from $100,000 and higher.
Buy Zones
$91,000–$89,800 (mirror volume zone)
$84,000–$82,000 (volume anomalies)
Sell Zones
$94,000–$97,500 (volume zone)
$101,000–$104,000 (accumulated volumes)
$105,800–$106,600 (local resistance)
This publication is not financial advice.
Market insights

#BTC Retests Resistance Zone📊#BTC Retests Resistance Zone⚠️
🧠As expected, the market found support near the short-term support level of 85358 and rebounded well. Currently, the price has retested the blue resistance zone. We should be wary of a potential pullback, so chasing the price higher here is not recommended. Instead, look for opportunities to short.
⚠️Note that if we successfully break through the blue resistance zone, we need to be cautious of a further surge.
🤜If you like my analysis, please like 💖 and share 💬
BITGET:BTCUSDT.P

Will it continue?Around September 2022 I drew two potential paths for what I thought bitcoin would do. So far one has been almost identical to bitcoins actual chart. Will it continue?

BTC target is $100KBTC is technically forming a double bottom on the daily timeframe (a trend-reversal pattern). The target sits around 100K. With the upcoming Fed meeting and a potential rate cut, we could break out toward 105K, and I wouldn’t rule out a move to 110K — a test of the 50/200-day MAs — as the market shifts into short-trend expectations.

Back in the stress test area againLooking at the 4-hour chart, the liquidity trend is still too strong. Let’s see if it can stay above 93,200 for the next 3 hours. If it holds, we can buy without hesitation. If not, we’ll sell.


The $91k Liquidity Re-Fueling Scenario Before $95kKey Level: $90,000 - $91,000
Significance: This area acts as a major psychological and structural wall. We anticipate significant selling pressure and liquidity pools here (Supply Zone).
The Bullish Requirement: For the move to $95k, the price must reach this area and then Consolidate (settle). A successful Flip to Support is confirmed by closing candles decisively above $91,000. This 're-fueling' provides the necessary market energy.
2. The Next Milestone
Ultimate Target: $95,000
Execution Condition: If the $91,000 level is successfully flipped and held as support with conviction and volume, the next major technical and psychological target for this short-term run is $95,000.

BTC 4H AnalysisBitcoin is at important resistance zone right now.
Once it break the level upward we might see new levels as drawn on chart.
NFA DYOR

BTCUSDTWe have a big downtrend.
By breakout from support and resistance we will have continued trend to next target.
Breakout 82k ready to 70k.
Breakout 93k ready to 100k and 115k.
CRYPTOCAP:BTC BITSTAMP:BTCUSD BINANCE:BTCUSDT

Bitcoin Comes Back to Life! Buyers Return With Full PowerIf I had to name a “warrior rising from the storm” , it would be BTCUSDT right now. After plunging to the 84k region, Bitcoin has just staged an almost 7% rebound back toward 93k, accompanied by news that big money from Wall Street is flowing back into crypto and overall fear in the market is calming down. The USD is no longer overly strong, and Bitcoin is once again being mentioned as a key gauge of market risk appetite .
Looking at the 12H chart, BTC has broken back above the bottom of the long-term descending channel and is now pushing into the Ichimoku cloud. This rebound isn’t a “spike and die” pattern — it’s a sequence of steady bullish candles with shallow pullbacks , showing that buyers are firmly in control. The scenario is becoming clearer: price may pull back to around 90,500 to gather liquidity and retest the cloud edge, before potentially bouncing toward the higher resistance region around 107,300 — the next equilibrium zone of the trend.
With the supportive news flow (institutional money re-entering, market accepting a new price base after the drop) and a technical structure showing BTC has temporarily escaped the free-fall phase , I remain biased toward buy-the-dip setups . The plan is to wait for short pullbacks for entries rather than trying to sell against a recovering bullish wave that’s clearly being “revived”.

BTC 4H – Complete Technical Analysis & Trade PlanMarket Structure
BTC is still in a macro downtrend, continuously creating Lower Highs (LH) along the descending trendline.
Recent bounce from 87,766 formed a Higher Low (HL), but structure remains bearish until price closes above 93,080.
Key Levels
Resistance / Liquidity Above:
93,080 (Major LH + liquidity cluster)
98,888
107,473
116,380
Support / Liquidity Below:
87,766 (HL)
83,786
80,600
Pattern & Trend
Price is compressing inside a symmetrical triangle, between:
Descending trendline resistance
Ascending demand trendline
This signals a volatility expansion soon.
Indicators
RSI: 65 → bullish momentum but approaching overbought zone.
Previous bullish divergences have played out.
No fresh bearish divergence yet.
Volume
Impulse buying was strong, but volume faded near resistance.
This warns of a potential rejection unless a breakout happens with high volume.
Next Likely Move
BTC likely sees:
A pullback from the 93k resistance
Into the 90k–89.5k region
Then a decisive move based on trendline reaction.
Break above 93,080 = trend shift.
Break below 87,766 = continuation down.
High-Probability Long Setup
Condition: Breakout + retest of 93,080
Entry: 93,200–93,300 on successful retest
SL: 91,300
TP1: 98,888
TP2: 107,473
TP3: 116,380
RR: 2R to 7R
Confluence:
Break in structure, break in trendline, liquidity sweep, volume expansion.
High-Probability Short Setup
Condition: Rejection from descending trendline + 93k zone
Entry: 92,800–93,000
SL: 93,800 (above liquidity)
TP1: 90,000
TP2: 87,766
TP3: 83,786
TP4: 80,600
RR: 1.8R to 7R
Confluence:
Trendline resistance, LH zone, fading volume, liquidity above price.
Summary
BTC still bearish until 93,080 breaks.
Market in compression phase.
Large move coming soon.
Best setups:
Break-and-retest long above 93,080
Rejection short from 93,000

#BTC/USDT is currently strongly bullish#BTC
The price is moving in a descending channel on the 1-hour timeframe. It has reached the lower boundary and is heading towards breaking above it, with a retest of the upper boundary expected.
We have a downtrend on the RSI indicator, which has reached near the lower boundary, and an upward rebound is expected.
There is a key support zone in green at 85249. The price has bounced from this zone multiple times and is expected to bounce again.
We have a trend towards stability above the 100-period moving average, as we are moving close to it, which supports the upward movement.
Entry price: 86624
First target: 87386
Second target: 88635
Third target: 90106
Don't forget a simple principle: money management.
Place your stop-loss below the support zone in green.
For any questions, please leave a comment.
Thank you.

Full Double CycleDouble Bottom completed, now going to break and form Double Top.
See ya guys at the Top.

BTCUSDT Reversal Play: My High-Probability Short Setup ## 🟠 BTCUSDT Reversal Play: My High-Probability Short Setup with Defined Risk
### 🧠 Why I’m Taking This Trade
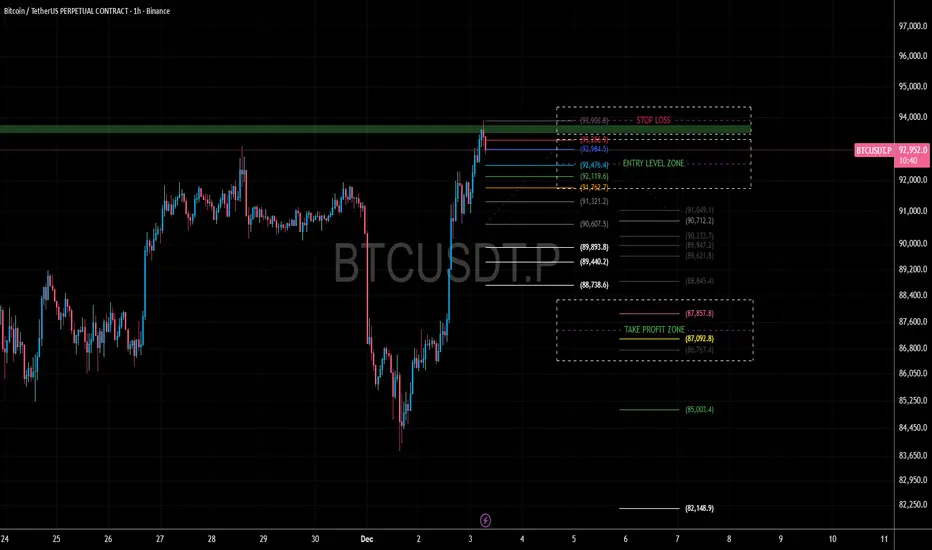
I’m positioning for a **short trade** on BTCUSDT after observing a sharp upward move followed by signs of exhaustion and a potential reversal. The recent rally pushed price into a zone where I expect sellers to step in. My goal is to catch the retracement while keeping risk tightly controlled.
I’m entering between **92,284.5 and 92,826.5**, which is a zone I’ve identified as a likely turning point. This area aligns with previous resistance and shows signs of rejection on lower timeframes.
### 🔍 What I’m Seeing on the Chart
- **Current Price**: 92,897.6
- **Recent High**: 93,903.8
- **Entry Zone**: 92,284.5 to 92,826.5
- **Stop Loss**: 93,903.8
This is placed just above the recent high to protect against a breakout continuation.
- **Take Profit Zone**: 86,767.4 to 87,857.8
These levels are based on prior support zones and Fibonacci retracement targets.
### 📊 Risk vs Reward
This setup offers a strong edge. I’m risking about **1,077 points** (from 92,826.5 to 93,903.8) to potentially gain **4,969 to 6,059 points** (down to the TP zone). That gives me a **risk-reward ratio between 4.6 and 5.6**, which is excellent for a swing short.
### 🧭 My Strategy in Simple Terms
- I’m not shorting blindly—I’m waiting for price to enter a zone where sellers have previously shown strength.
- My stop is placed above the recent high, so if price breaks that level, I know the setup is invalid.
- My targets are realistic and based on previous support zones where buyers may re-enter.
This is a **structured, disciplined trade** with clear boundaries. I’m not guessing—I’m following a plan based on price behavior, structure, and risk control.
Bitcoin Analysis- Back Inside the Bullishh Channel📈 Bitcoin Analysis – Back Inside the Bullish Channel
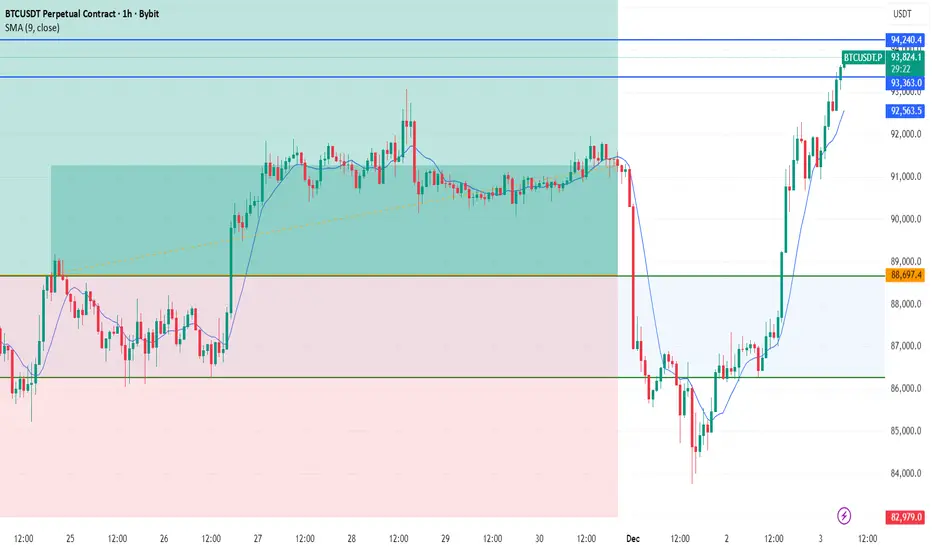
After Monday’s sharp overnight drop, Bitcoin has shown a strong recovery, pushing back into the ascending channel and respecting its structure. Price has returned to the same zone where it was before the collapse, signaling that buyers are still defending key levels.
Technically, BTC rejected the midline of the bullish channel, failing to break above it—suggesting a possible need for a healthy pullback before continuation.
My preferred scenario remains a retracement toward the 92,000 support zone, which aligns with:
The lower half of the rising channel
A local demand zone from last week
The 0.382–0.5 Fibonacci retracement cluster of the recent recovery leg
From this area, I expect renewed bullish momentum as long as 92,000 holds.
🔍 Added Technical Factors
Higher lows remain intact despite volatility.
Volume on the recovery move was positive, indicating real demand.
The RSI on H4 is cooling off, supporting a potential pullback.
BTC continues to trade above the 50 EMA (H1)—short-term bullish bias.
🌍 Added Fundamental Factors
Risk appetite increased globally after softer U.S. inflation data, boosting crypto sentiment.
Fed officials continue hinting at possible rate cuts in early 2025, keeping BTC supported as liquidity expectations rise.
ETF inflows remain net positive, though slower this week—still a constructive long-term driver.
Reduced on-chain selling pressure from miners following difficulty adjustments helps stabilize price action.

BTC (bitcoin) Double-Bottom Reversal Testing Key ResistanceHi!
The chart shows Bitcoin forming a clear double-bottom pattern, supported by bullish RSI divergence on the lower panel. This combination often signals exhaustion of downward momentum and a potential trend reversal. The price has rallied strongly from the second bottom and is now pressing directly into the neckline zone, which aligns with a broader descending trendline drawn from previous swing highs.
This overlap creates a high-confluence resistance area. The current reaction here is critical: if price decisively breaks above the neckline and closes above the descending trendline, it would confirm the reversal structure and open the path toward the next major liquidity pocket around the 100k–104k region, marked on your chart as the target. This region matches previous consolidation and supply, making it a realistic upside magnet if breakout momentum is strong.
However, without a confirmed breakout, the neckline remains a potential rejection level, and price could retest the mid-range or even revisit trendline support. Bulls need continuation volume above resistance to flip the zone into support.
Overall, market structure has shifted from aggressive selling to a constructive bottoming phase. The key now is whether bulls can convert this pattern into a sustained trend reversal.

BitcoinBitcoin has surpassed the $87,500 mark and has also broken through the key level of $90,000. As noted, the Inverse Head and Shoulders (IH&S) pattern has acted as a reversal signal. The market currently appears strong, as the price increase is supported by healthy trading volume. The next significant resistance level to watch for is $95,000, and it will be interesting to see how the price behaves at that point.
BTCUSD TO 100K!!!!!!BTCUSD made a breakouts off my internal structure highs yesterday without any valid pull back to the breaker block after my inducement am taking a long buy entry at 92k holding till price sweep liquidity at 100k which will be my next sell zone order

BTC SHORT SETUP – Multiple Bearish Confluences!Price at Decision Zone – Bears Preparing for the Next Move
After the recent downside move, Bitcoin printing Lower Highs (LHs) — a classic sign of fading bullish strength. #BTC is now testing the upper descending trendline, an area where price has consistently faced rejection.
Bearish Confluences Building Up
1️⃣ Lower High Structure
Market structure is shifting bearish as #BTC keeps forming LHs.
2️⃣ Trendline Retest
Price is touching the upper trendline, a key rejection zone in this downtrend.
3️⃣ 30-Min Bearish Divergence
Momentum is slowing down while price pushes up — a reliable early signal of weakness.
4️⃣ No Strong Bull Confirmation Yet
For a real trend reversal, #BTC must reclaim 80,000 and show bullish divergence, which is currently absent.
Trade Plan
I will look for a short entry once #BTC breaks the minor intraday support level.
✔ Stop-loss: Above the most recent LH
✔ Targets: Local liquidity zones below
✔ Strict risk management—no chasing
Bias
With structure, divergence, and trendline all aligned, probability favors a bearish continuation unless bulls reclaim major levels.
What’s your view?
Will #BTC break lower or surprise with an unexpected bounce?
👍 LIKE for more setups
💬 COMMENT your bias
⭐ FOLLOW for premium BTC, GOLD & FX ideas
#Bitcoin #BTCUSD #Crypto #TradingView #PriceAction #CryptoAnalysis #BTC #ShortSetup #BearishDivergence #TrendlineTrading #TechnicalAnalysis


Times are changing.Monthly change of color with well below zero selling volume. Haven't seen this in a while.

Short term higher, then lowerIt looks like a possible short term move back up, then selling continues.

Bitcoin (BTC) Update, is price at resistance ?Bitcoin reversed sharply into the point of control and is now consolidating under the channel-high resistance that has held for several days. This suggests buyers are losing momentum.
As long as BTC stays below this resistance, the market remains vulnerable to filling the lower inefficiency and rotating back toward the 78,000 support.
Key Points:
- Consolidation under channel-high resistance
- Short-squeeze rise filled lower inefficiencies
- Single-print region below remains vulnerable
What to Expect:
A clean reclaim of resistance is needed for upside. Failure opens the door to deeper corrective moves toward 78,000.
