BTCBTC is in an important resistance area if the resistance area at 94 is broken but I would prefer it to go past 97 to be safer and I think it will go up to test the area 109...110 for the moment. After that we have an important resistance area at 117.....119 .// if it breaks this area I think we will have a historical maximum
Trade ideas

TradeCityPro | Bitcoin Daily Analysis #236👋 Welcome to TradeCity Pro!
Let’s move on to today’s Bitcoin analysis, the market has formed a new structure and is now ready for its next move.
⏳ 1-Hour Timeframe
Today, Bitcoin formed a support low at 90,421, and the long trigger at 91,089 has already been activated.
💥 The RSI oscillator has been supported again at the 42.11 level, gaining bullish momentum. With this renewed momentum, the price can now move toward higher levels such as 91,813 and 93,555.
✨ The break of 91,813 can be used as the next long trigger.
The next major resistance zone is 93,555.
🔽 For short positions, the break of 90,421 is a strong trigger, and it would also serve as the first confirmation for the continuation of the daily timeframe downtrend.
✔️ The next support zones on Bitcoin are 89,082 and 87,942.
❌ Disclaimer ❌
Trading futures is highly risky and dangerous. If you're not an expert, these triggers may not be suitable for you. You should first learn risk and capital management. You can also use the educational content from this channel.
Finally, these triggers reflect my personal opinions on price action, and the market may move completely against this analysis. So, do your own research before opening any position.

Bitcoin prediction 2025-NovBitcoin price has a motive to buy and it's now retraced to a bullish order block as way of correcting price with same Bullish bias from earlier trade call.

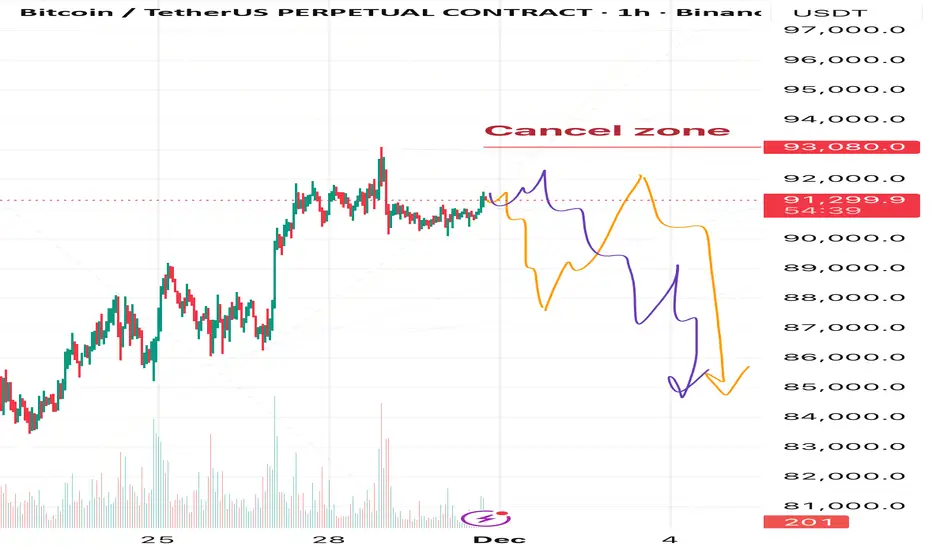
Bitcoin: Next Move = Drop to $85K (Then Either Moon or Doom)Hey everyone! 👋
How was your trading week? Hope it was green and profitable! 💰
Sharing my current Bitcoin view with you.
In my opinion, the recent rally we’ve seen was either part of an ongoing correction or the final leg of a correction after the previous sharp drop.
Either way, I expect the next meaningful move to be to the downside.
Right now I see two possible scenarios, but both lead to the same outcome in the near term:
→ A decline toward the $85,000 area
🟠either straight from the current price
🟣or after one more push higher toward ~$92,000–$92,500
This coming drop can be interpreted in two ways:
1. As wave B of the ABC correction from the recent crash → after $85K is reached we can expect a strong recovery and new highs above $93K (and likely much higher).
2. If the correction from the crash is already fully complete, then the drop to $85K will mark the start of a new bearish trend continuation.
We’ll watch the internal structure of the upcoming decline — it will give us the clues which of the two bigger pictures is playing out.
❌Invalidation level for the entire bearish scenario: $93,080
Any clear touch and break above this level cancels the idea completely.
Of course, I’ll keep posting fresh updates and chart markups as the price action unfolds, so make sure to hit that
Follow button and turn on notifications — you don’t want to miss the next posts! 🔔
Stay sharp and trade safe, friends! 🚀
See you in the charts! 📊
BTC Sell/Short Setup (4H)Based on the previous wave counts, it seems that wave D will complete in the red zone.
We have prepared a setup that you can use to enter a position with 10X to 14X leverage.
The targets, stop-loss levels, and entry point are marked on the chart.
For risk management, please don't forget stop loss and capital management
When we reach the first target, save some profit and then change the stop to entry
Comment if you have any questions
Thank You

BTC: Continue Going LongThe strategy of continuing to go long on BTC is generating consistent profits. Levels below 90K present the optimal buying opportunity. Next week, BTC is expected to reach 100K—let’s wait and see, and get ready to lock in profits.
I will send out accurate trading signals as soon as the market opens next week. Don’t miss out.

BTC: Continue to Go LongBTC has now broken through the $90K resistance level, and it is only a matter of time before it surges past $100K. Continuing to go long remains the only correct choice.
I send out accurate signals every day after the market opens, so don’t miss out.

Forex Market Analysis1. Understanding Forex Market Dynamics
Before diving into analysis techniques, it’s essential to understand what drives currency movements. In forex, currencies trade in pairs, such as EUR/USD, USD/JPY, or GBP/INR, meaning the value of one currency is always measured against another. Their movement is influenced by:
Economic performance of countries
Interest rate differentials
Geopolitical developments
Trade balances & capital flows
Market sentiment and risk appetite
Forex is inherently complex because it reflects global financial health, investor preferences, and government policies. Hence, sound analysis helps simplify that complexity.
2. Fundamental Analysis in Forex
Fundamental analysis examines the economic, political, and social forces that impact currency values. It focuses on macroeconomic indicators and central bank policies to gauge whether a currency is undervalued or overvalued.
a. Economic Indicators
Traders closely monitor key data releases:
1. GDP (Gross Domestic Product)
A growing economy strengthens its currency because foreign investors move capital into that country.
2. Inflation (CPI & PPI)
Moderate inflation is healthy, but high inflation typically weakens a currency. However, higher inflation may force central banks to raise interest rates, supporting the currency.
3. Employment Data
The U.S. Non-Farm Payrolls (NFP) is the most watched employment report globally. Strong job growth boosts currency strength.
4. Retail Sales & Consumer Confidence
Consumer-driven economies like the U.S. and Eurozone react significantly to spending data.
5. Trade Balance
A country with higher exports than imports (trade surplus) usually sees its currency appreciate as foreign buyers demand that currency.
b. Central Bank Policies
Central banks like the Federal Reserve (Fed), the European Central Bank (ECB), and the Reserve Bank of India (RBI) have enormous influence on forex markets.
Interest Rates
Higher interest rates attract foreign capital, increasing demand for the currency.
Monetary Policy Statements
Statements about inflation, economic growth, or recession potential can cause major volatility, even without actual rate changes.
Quantitative Easing (QE) or Tightening
QE usually weakens a currency; tightening strengthens it.
For example:
Fed Rate Hikes → USD strengthens
ECB dovish signals → EUR weakens
c. Geopolitical Events
Political uncertainty can cause currency depreciation:
Elections
Trade wars
International conflicts
Government instability
Investors often move to safe-haven currencies like USD, CHF, and JPY during uncertain times.
3. Technical Analysis in Forex
Technical analysis studies price charts, historical data, and market patterns to forecast future currency movements. Unlike stock markets, forex markets are highly liquid and more technical in nature, making chart analysis extremely effective.
a. Price Charts
Common chart types:
Candlestick charts (most popular)
Line charts
Bar charts
Candlesticks offer information about market psychology through patterns like:
Bullish engulfing
Doji
Hammer
Shooting star
These patterns help traders identify reversals and continuations.
b. Trend Analysis
Identifying market direction is central to technical analysis:
Uptrend: Higher highs, higher lows
Downtrend: Lower highs, lower lows
Sideways trend: Ranging market
Trendlines, channels, and moving averages help determine momentum and potential breakout points.
c. Technical Indicators
Key indicators used in forex trading include:
1. Moving Averages (MA & EMA)
Used for trend direction and dynamic support/resistance.
50-day and 200-day EMA crosses often signal major trend shifts.
2. RSI (Relative Strength Index)
Measures overbought (>70) and oversold (<30) conditions.
3. MACD (Moving Average Convergence Divergence)
Tracks momentum and helps identify trend reversals.
4. Bollinger Bands
Indicate price volatility; when bands contract, breakouts usually follow.
5. Fibonacci Retracement
Used to identify pullback levels and continuation zones during trends.
d. Chart Patterns
Forex traders heavily rely on chart structures:
Reversal Patterns
Head and shoulders
Double top and bottom
Inverse head and shoulders
Continuation Patterns
Triangles (ascending, descending, symmetrical)
Flags and pennants
Rectangles
Chart patterns help predict price breakout direction and potential targets.
4. Sentiment Analysis
Sentiment analysis captures how traders feel about a currency pair. It reflects crowd psychology and risk appetite.
a. Risk-On vs Risk-Off Behavior
Risk-On: Investors buy higher-yield or riskier currencies (AUD, NZD, emerging markets).
Risk-Off: Investors move to safe-haven currencies (USD, JPY, CHF).
b. Commitment of Traders (COT Report)
Published weekly by the CFTC in the U.S., it shows how institutional traders are positioned—long or short—on major currencies.
c. Market News & Headlines
Breaking news immediately shifts sentiment:
Natural disasters
Political announcements
Sudden policy changes
Sentiment often triggers short-term volatility, even if fundamentals remain stable.
5. Intermarket Analysis in Forex
Currencies are deeply connected to other asset classes:
a. Bonds and Interest Rates
Bond yields strongly influence currencies.
Higher yields → stronger currency.
b. Commodities
Some currencies move with commodities:
CAD with crude oil
AUD with gold and minerals
c. Stock Markets
Strong equity markets attract foreign investment, supporting the domestic currency.
6. Developing a Forex Analysis Strategy
Successful forex traders integrate all three analysis types:
1. Fundamental View
Understand the economic backdrop and long-term direction.
2. Technical Setup
Find entry and exit points using charts, patterns, and indicators.
3. Sentiment Confirmation
Assess whether market mood supports the trade idea.
Example:
If fundamentals signal strong USD,
Technical charts show bullish breakout on USD/INR,
Sentiment moves “Risk-Off”,
→ A long position is valid.
7. Practical Tools for Forex Analysis
1. Economic Calendars
Track upcoming news releases.
2. TradingView & MetaTrader Charts
For chart analysis and indicators.
3. Forex News Platforms
Bloomberg, Reuters, and central bank websites.
4. Volatility Indicators
ATR and VIX (indirectly) help assess risk levels.
8. Importance of Risk Management in Analysis
Even perfect analysis fails without risk control. Forex is highly leveraged; thus:
Always use stop-loss
Avoid over-leveraging
Diversify trades
Respect market volatility
Keep emotions in check
Risk management ensures long-term survival despite inevitable losses.
Conclusion
Forex market analysis is a powerful framework that combines economic understanding, technical expertise, and sentiment reading to interpret currency movements. As the world’s most liquid market, forex responds instantly to global developments, requiring traders to be informed, agile, and analytical. The best results come from blending fundamental views with technical setups and sentiment signals, along with disciplined risk management. With consistent practice and a structured approach, traders can navigate forex markets more confidently and effectively.

Gold (XAUUSD): Potential Buy Chance on the 15-Minute ChartBased on the black line on the chart, we are looking for a downward move (Sell).
We expect the price to go up first and touch the blue block (Supply Zone) around 91,500 - 92,000.
After hitting this zone, the price should reject and drop down.
The final target is the support level at 87,500.

Bitcoin trade analysis1. Trend & Structure
Price is inside a rising channel (light-blue lines).
BTC is sitting directly on the lower channel support, meaning this is a key decision zone.
Small candles and narrowing price range indicate compression before a breakout.
2. Support & Resistance
Level Type
90,300–90,500 Local support (EMA cluster + channel bottom)
91,200 Minor resistance
93,000–93,400 Major resistance (top of channel + horizontal level)
95,000 Higher-timeframe resistance
BTC is trading directly above major support, which makes a long more favourable unless support breaks.
3. Candlestick Interpretation (single clear conclusion)
Current candles show small-bodied consolidation with long lower wicks → buyers are defending support, signalling a bullish continuation attempt.
→ Precise conclusion: Bulls are holding support, making a bounce more likely than a breakdown.
4. Indicator & Oscillator Signals
EMA Ribbon (12–200): Price is sitting on the fast EMAs but still below high-TF EMAs → slightly bullish short-term but still inside a broader bearish pressure zone.
Volume: Decreasing → momentum is coiling → breakout imminent.
5. Elliott/Wave Structure
Price appears in a corrective wave (wave 4) inside an ascending channel.
If support holds, a push toward wave 5 to the channel top (92.5–93.4k) is likely.
6. Volume Analysis
Buyers appear on each dip.
Selling volume is weak.
No capitulation spike → accumulation-type structure.
🎯 Conclusion
BTC is at the best possible long-entry zone inside the rising channel.
A long is preferred as long as 90,300 support holds.
A short becomes valid only if price closes below the ascending channel.

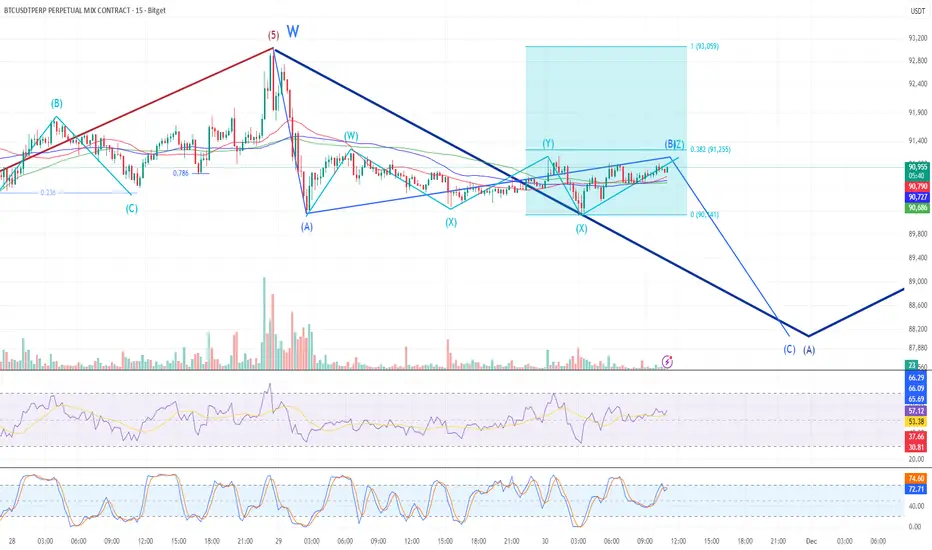
Bitcoin 15-Min Chart – Lower Timeframe Structure of Higher TimefThe higher timeframe ABC correction is being interpreted as a W-X-Y structure on the 15-minute chart, based on internal wave complexity.
Currently in the A wave of the internal ABC within the X leg
Within that A wave, a smaller ABC is unfolding, with the A-B portion nearing completion
Overall structure suggests a complex correction (W-X-Y-X-Z) in progress
At the moment, moving averages are tightly clustered, forming a combined support zone.
➡️ A clean break below this support cluster would strengthen the case for a Wave C move.
Bitcoin 1H Chart – Anticipated ABC Structure Within Major A-BCurrently expecting an ABC corrective pattern unfolding within the larger A-B structure.
Price is facing resistance at the 60 EMA,
and this moving average will serve as a key level for monitoring and reaction.

Bitcoin 4H Chart – Wave 3–4 Flat Correction PerspectiveCurrently viewing the Wave 3–4 structure as a potential ABC flat correction.
Within the flat (standard 5–3–5 structure), the final 5-wave C-leg appears to have been completed, and the market is now in a pullback phase.
RSI is facing resistance near the upper band, triggering a short-term correction.
However, if the price holds above the 90 EMA and fails to break below it convincingly,
it could present a potential reaction zone, and tactical response may be needed.

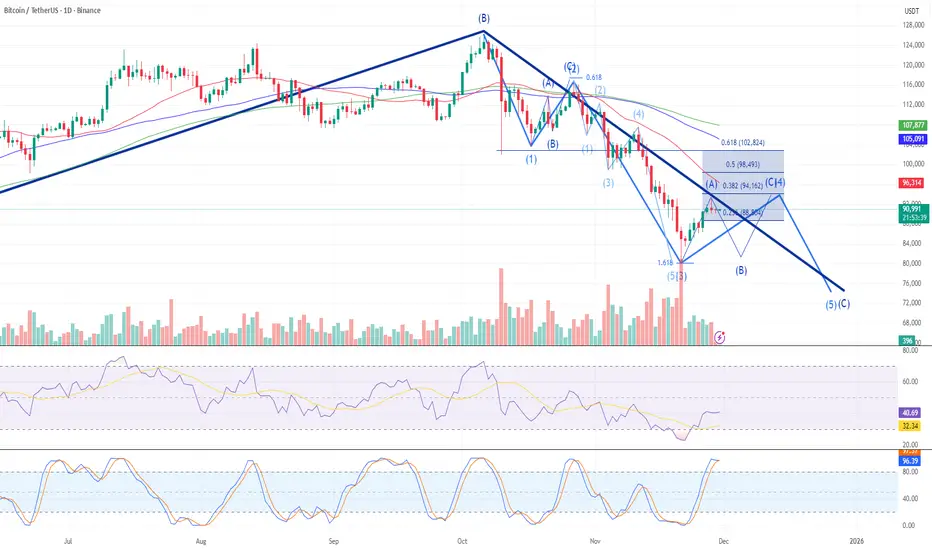
Bitcoin Daily Chart – Wave C Internal Structure PerspectiveIf Wave C was completed at the previous low (near the 1.618 Fibonacci extension),
the correction could be counted as a running flat, marking the end of Major Wave 4,
and a new Wave 5 impulse may have already started.
However, due to the bearish moving average alignment and 0.382 Fib resistance,
further correction remains possible.
Currently viewing the internal structure of Wave C as a 5-wave move,
with the 4th wave unfolding as a flat correction (ABC structure).
For reference, the previous 2nd wave was a zigzag.
BTC - Ranges overview (update) Let's have a look at the current PA on BTC.
The weekly order block (yellow box) is reacting properly so let's see what we should expect from here.
IF we fail to hold the weekly order box in the course of the coming weeks expect lower prices towards 85K.
IF we regain the yearly open (red line) and hold , the lows will be in. We can then expect BTC to retrace back towards 100K and higher.
As always no need to guess where the market wants to go...PLAN...BE PATIENT...and WAIT FOR THE MARKET TO SHOW YOU ITS HAND.
Stay safe and never risk more than 1-5% of your capital per trade. The following analysis is merely a price action analysis and does not constitute financial advice in any form.


Bitcoin Analysis – November 29|Calm Before the Storm !Let’s jump into today’s market outlook! 🔍📉📈
The Fear & Greed Index is sitting at 20, which means market participants are still in fear mode 😨.
Today’s structure hasn’t changed much compared to yesterday — except for one key detail: we had a fake breakout on the top of our box, and that increases the probability of a downside break.
Your long and short triggers are still the same as yesterday’s plan.
Just remember: tomorrow is the last day of the month, and monthly closes can get wild — so risk management is everything 🛡️.
✔️ Keep your stop-losses tight
✔️ Track Bitcoin’s price action together with its dominance
✔️ Don’t force trades — let the setup come to you
Trade safe, stay sharp, and manage your capital like a pro! 🚀


BTCCRYPTOCAP:BTC inverse head and shoulders is likely to play out and the measured target for the pattern is $150K. The structure is clean and momentum is starting to align with the breakout setup.

BTCUSDTBitcoin is on its way to reaching the trend line, which is $94,000, and then returning to the initial price, which is about $85,000, and after that it has two paths, Messi 1 and 2, which are clear on the chart. This will happen in the next few days.

BitcoinHello friends,
this is only a daily-timeframe analysis that has been decided based on reviewing the 4-hour timeframe. Please pay attention. Bitcoin has formed two major blocks in its downtrend, and there is a possibility of returning to those blocks. However, the major correction has been definitively confirmed, and I am only looking for a suitable short-position opportunity so that I can enter another unique long position in the future. In my daily analysis, there are two suitable blocks for selling; clear signs of a decline must be observed, after which you should enter the position. The analysis is very clear and does not require further explanation.
Thank you for your support, dear friends!
Wishing you all the success!
Fereydoon Bahrami
A retail trader in the Wall Street trading Center (Forex)
Risk Disclosure:
Trading in the crypto market is risky due to high price changes. This analysis is just one person's opinion and shouldn't be taken as financial advice. Before investing, it's best to talk to a financial advisor and do your own research. You are responsible for any profits or losses from this analysis

BTCUSDT.P - November 30, 2025The chart shows Bitcoin in a short‑term downtrend on the 15‑minute timeframe, with price consolidating in a tight range after a strong impulsive selloff, indicating corrective structure rather than a confirmed reversal yet. Resistance is clearly defined around 92,600–92,800 where prior selling pressure emerged, while immediate intraday support is clustered near 90,500–90,600, with a deeper support zone just below 90,000 acting as the invalidation area for the projected long setup. A break and 15‑minute close above the mid‑range resistance band around 91,200–91,300 would confirm bullish momentum and open the path for a trend‑continuation push toward the marked profit zone, whereas a failure there followed by a move back under 90,600 would favor another leg lower into the support block before any meaningful bounce.

A safe long setup for cautious peopleThe previous analysis was with a longer-term perspective. In this analysis, a completely safe setup is presented for cautious people. The stop of this setup is placed at the point 87550. If this point is crossed, the short-term upward trend is ruled out.
