Candlestick Patterns - How to read them like a ProOverview
Candlestick charts serve as a cornerstone in technical analysis, presenting price activity in a visually digestible format. By examining how prices move over a given timeframe, traders gain key insights into potential market direction, sentiment shifts, and trend strength.
Mastering candlestick interpretation is essential for identifying bullish or bearish sentiment, as well as for spotting possible trend reversals or continuations. Still, candlesticks alone don’t paint the full picture—using them without broader context increases the risk of false signals.
---
What You'll Learn
What are candlestick charts?
Common bearish candlestick patterns
Common bullish candlestick patterns
How to apply candlestick analysis in trading
---
What is a Candlestick Chart?
A candlestick provides a snapshot of an asset’s price behavior during a specific time interval, whether it's one minute, one hour, or one day. This format allows traders to quickly assess how the price has moved within that period.
Each candle reveals four price points:
* Open – the price at the beginning of the interval
* Close – the price at the end of the interval
* High – the highest price reached
* Low – the lowest price during that time
Anatomy of a Candlestick:
* Body: The thick section between the open and close. A green (or white) body means the close was higher than the open (bullish), while red (or black) means the opposite (bearish).
* Wicks (or Shadows): Thin lines extending from the body to indicate the high and low.
* Upper wick: Marks the highest traded price
* Lower wick: Marks the lowest traded price
---
Bearish Candlestick Patterns
Understanding bearish candlestick patterns helps traders identify moments when buying momentum might be running out—setting the stage for a potential downward shift.
Evening Star
A three-candle formation that signals a shift from buying pressure to selling dominance. It starts with a strong bullish candle, followed by a small-bodied candle of indecision, and concludes with a large bearish candle that cuts deep into the first. This pattern often appears at the end of an uptrend.
Bearish Engulfing
This setup includes a small bullish candle followed by a large bearish candle that completely swallows the previous one. It indicates that sellers have seized control, potentially marking the beginning of a downward trend.
Shooting Star
With a small real body near the low and a long upper wick, this pattern reflects strong early buying that is ultimately rejected by the close—suggesting fading bullish momentum.
Gravestone Doji
This candle opens, closes, and hits its low all around the same price, leaving a long upper wick. It suggests that bulls pushed higher during the session but were overpowered by bears by the close.
Three Crows
Three consecutive bearish candles, all approximately the same size. These indicate that a sell off is coming soon.
---
Bullish Candlestick Patterns
Bullish patterns can alert traders to possible reversals after a downtrend or strengthen conviction during an uptrend.
Morning Star
This three-candle formation marks a potential turning point from bearish to bullish. It begins with a strong bearish candle, followed by a smaller candle showing indecision, and ends with a large bullish candle breaking upward—signaling buying strength is returning.
Bullish Engulfing
This two-candle pattern begins with a bearish candle, then a larger bullish candle that completely envelops the previous body. It reflects a sharp transition in sentiment, suggesting renewed buying pressure.
Dragonfly Doji
A single candle where the open, close, and high are all very close, with a long lower wick. It shows sellers pushed prices lower but buyers stepped in and brought them back up—an early sign of possible reversal.
Hammer
A classic bullish reversal signal that features a small real body near the top and a long lower shadow. It indicates a battle where sellers initially dominated, but buyers managed to close near the open price.
Three soldiers
Three consecutive bullish candles, all approximately the same size. These indicate that a big buy is coming soon.
---
Trading with Candlestick Patterns
Candlestick patterns become more meaningful when they align with major chart areas—such as previous support or resistance, trendlines, or retracement zones. A bullish signal at a support level can hint that the downward pressure is fading, while a bearish pattern at resistance may warn of an upcoming decline.
To increase the reliability of your trades, combine candlestick patterns with other forms of technical analysis:
* Support & Resistance Zones: These are price levels where the market has historically reacted. Candlestick patterns forming near these zones have stronger potential implications.
* Fibonacci Levels : These help identify likely retracement areas. When a candlestick pattern forms near a key Fibonacci level like 61.8%, it adds strength to a potential reversal setup.
* Liquidity Areas: Clusters of orders (buy or sell) tend to create strong reactions. When patterns appear in these zones, they often precede more decisive moves.
* Technical Indicators : RSI, MACD, Moving Averages, and Stochastic RSI can provide confirmation. For instance, a bullish reversal pattern that appears when RSI is oversold strengthens the signal.
💡 Tip: Don’t rush into trades based on one candlestick alone. Always wait for the next candle or price confirmation (e.g., a break of a previous high/low) to validate your signal.
---
Thanks for Reading!
✨ If you found this helpful, show some love by liking or commenting!
🔔 Don’t forget to follow for more technical breakdowns and trading insights coming soon!
BTCUSDT.P trade ideas

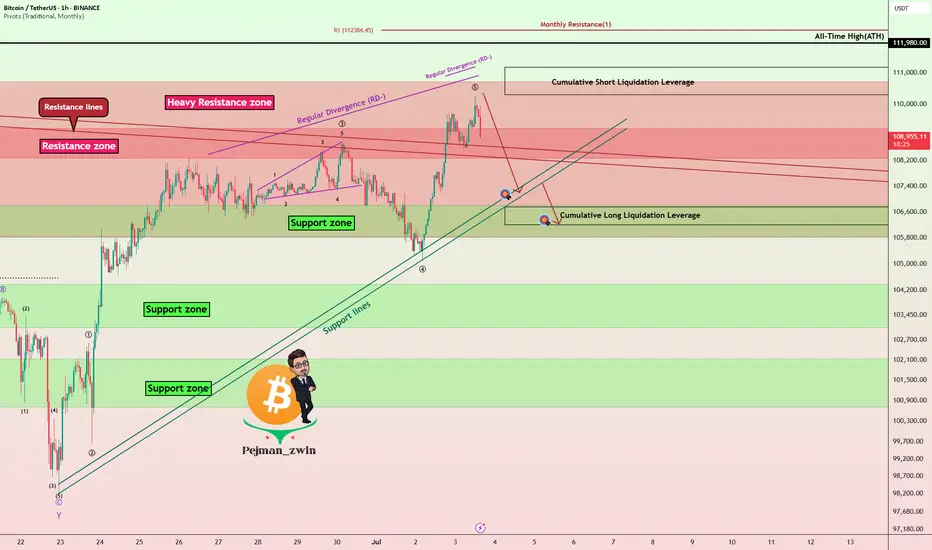
Bitcoin Roadmap => Short-termBitcoin ( BINANCE:BTCUSDT ) is moving above a Heavy Resistance zone($110,720-$105,820) , Cumulative Short Liquidation Leverage($110,300-$111,177) and is approaching All-Time High(ATH) .
Do you think Bitcoin will create a new All-Time High(ATH) in this rally?
In terms of Elliott Wave theory , Bitcoin's rise over the last two days appears to have been in the form of wave 5 .
Also, we can see the Regular Divergence(RD-) between Consecutive Peaks.
I expect Bitcoin to start declining in the coming hours. Targets are marked on the chart.
Cumulative Long Liquidation Leverage: $106,750-$106,202
Note: Stop Loss(SL)= $111,223
Please respect each other's ideas and express them politely if you agree or disagree.
Bitcoin Analyze (BTCUSDT), 1-hour time frame.
Be sure to follow the updated ideas.
Do not forget to put a Stop loss for your positions (For every position you want to open).
Please follow your strategy and updates; this is just my Idea, and I will gladly see your ideas in this post.
Please do not forget the ✅' like '✅ button 🙏😊 & Share it with your friends; thanks, and Trade safe.
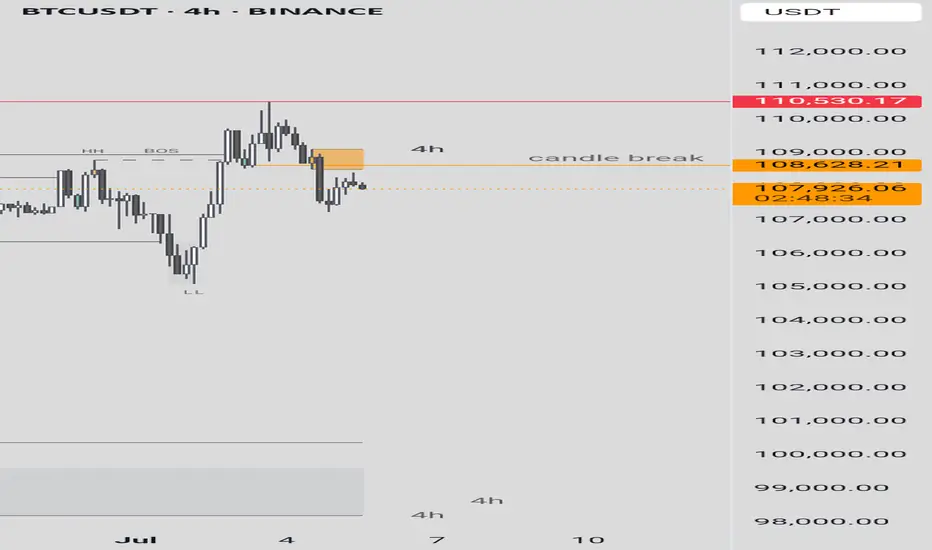
BTCUSDT This is a 4-hour candlestick chart for BTCUSDT on Binance, covering the period from June 4 to July 4, 2025. The chart includes technical analysis annotations such as:Higher Highs (HH) and Higher Lows (LH) indicating an uptrend.Lower Highs (LH) and Lower Lows (LL) suggesting a potential downtrend or consolidation.CHOCH (Change of Character) marking a shift in market structure.BOS (Break of Structure) indicating a break in the previous trend.A red horizontal line at 110,530.17, possibly a resistance level.An orange dashed line around 108,259.99, possibly a key support or pivot level.Price levels on the right (e.g., 110,530.17, 108,628.21) showing recent highs and the current price at 01:01:45.The chart shows a recent upward movement followed by a sharp drop, with the price currently near 105,000. This could indicate a rejection at resistance or a breakout attempt.
Overall, the market is currently trending down in the short term, but there is a chance for a comeback if support holds. Monitor the key levels of 105,000 and 102,500 for further confirmation.
BTCUSDT: building up for a bigger pullback.As it stands, BTC is at a very important area. There's a first sign that the trend will change for the coming days and I expect the price to drop towards the 103k area.

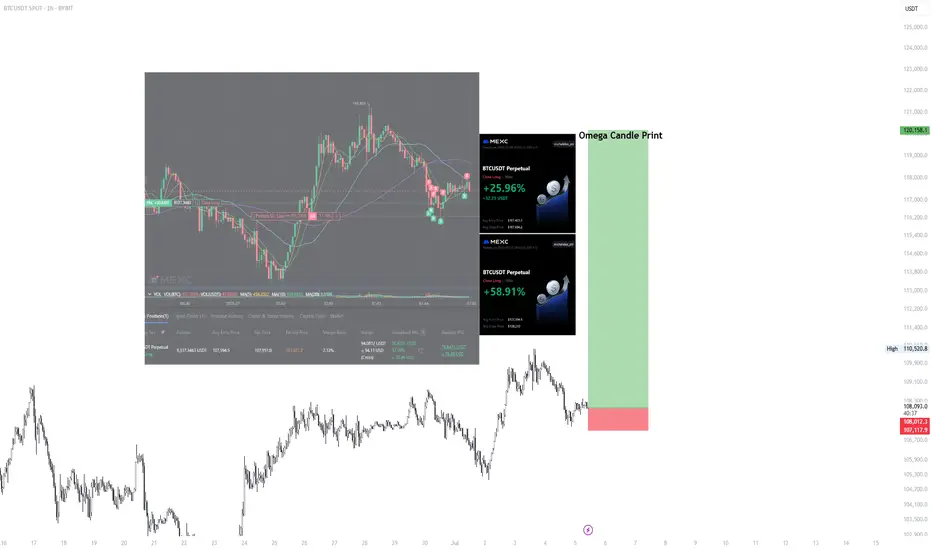
BTC/USDT BYBIT IDEA #2 – Local Range Hold and OMEGA CANDLE PRINTThis is my second Setup I am currently in - apart from going to 6h orderblock we will hold the LTF range and continue higher breaking new highs and starting price discovery.
Combined this with Bullish News could bring amazing BTC Run, followed by Altcoin Season in Mid August/September. If you look into Bitcoin Balance and the way this token is being bought and accumulated by institutions.
The way you know Bull Run is about to start is because no Grandmas and Taxi Drivers are talking about it.
I would not believe it myself but here we are.
The way I do this I keep my position running from lows (bought at 107 400) and I am buying LTF ranges for extra 30-40% of existing position and then closing around the same amount on highs of LTF like 15M-30M.
looking for longs, my SL is set for break even.
Good luck.
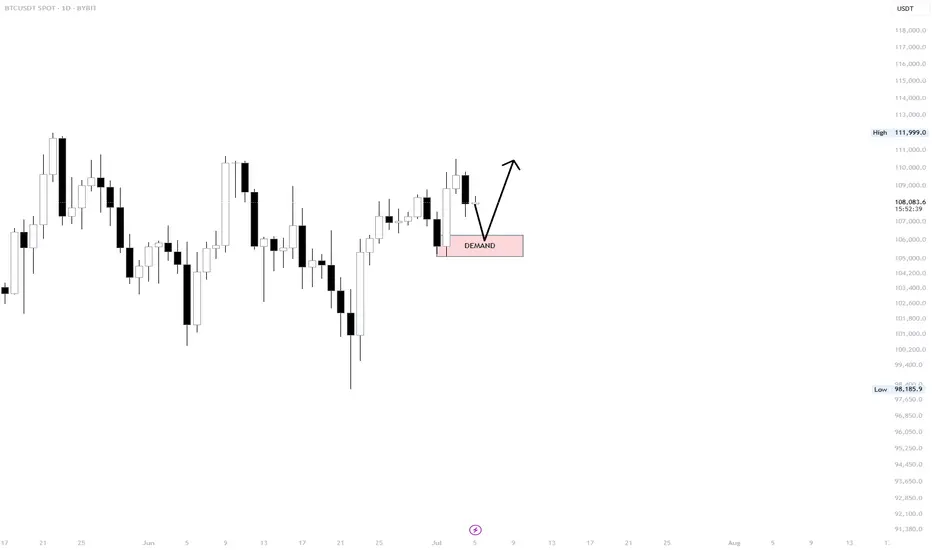
BTC/USDT BYBIT IDEA #1 – Daily Demand Zone Setup
We have an bullish OB with imbalance on Daily, 6 HOUR REFIMNET with some stoplosses underneath 107 200. If we do not hold local LTF -15M- 1H range I would be favoring this setup.
Otherwise I am already in position and already took two TPs.
Setup Thesis:
If price tags the demand zone (highlighted in pink) and holds, we could see a continuation toward recent highs. The setup favors a reactive long entry from this zone, as long as buyers defend the area with conviction.
Key Factors:
Demand zone: High probability support area
Clean structure: HL-HH continuation in play
Market strength remains intact above this zone
Plan:
Wait for reaction at demand
Long on confirmation (rejection candle, reclaim, or strong 4H close)
Invalidation below the zone lows
"BTC to $108,800 – How Likely Is It?"Bitcoin is showing strong bullish momentum as key technical indicators align in favor of a major breakout. With increasing institutional interest, rising ETF inflows, and a favorable macroeconomic environment, BTC appears to be setting up for a potential rally toward the $108,800 level. Historical price action also suggests that once Bitcoin breaks past major resistance zones, it often surges rapidly. If the current support levels hold and buying pressure continues, the $108,800 target may be closer than expected.

BTC/USDT Back Test Perhaps it's not surprising to say that I see a chance to put the $99,000 zone back in the test. Just because of the FVG. Even if it doesn't happen, I see an upward trend now.

Btcusd techinical analysis.Btcusd techinical analysis next move psibale at h1 time frame.not finchinal advice.


BTC SCALP Tradeas long as BTC doesn't closes below the mentioned area on 1hr tf, it will bounce and hit the fresh sellers SL. Once we have a closing below the area it can take correction upto 98-97K area.

BTC Scalp Long / Buy SetupWait for the entry first, BTC must sweep the liquidation levels below side first then it should start pumping towards the tp, if it takes 2nd tp first then trade is not valid, if it takes first tp and then come back at entry level trade is still valid. if 4hr candle closing below the Bullish OB then close the position otherwise wick doesn't matter.

BTC Analysisfor here no trade zone, short from mentioned zone and keep the sl tight, I would prefer long from the 100k zone, if we get daily closing below the mentioned zone then will long from 92-90k area, target still remains the same 112k-120k

BTC short setup As previous weekly went good on BTC, a nice bounce from the area on swing setup. Now wait for the liquidity grab from 107.8k then take short, that whiteline is important to break and sustain for btc to continue it's Bullish trend. Longer sl is just to avoid wick damage closing matter here. Good luck, book at least 50% on 105.2k rest hold the position, and take long from mentioned zone.

All Binance Coins Watchlist 2025 JULY If you want to create a full list of all coins from the exchange you use, you can:
1. Go to Screeners
2. Set these filters:
a. Exchange (eg. Binance)
b. Quote currency - USDT
c. Symbol type - Perpetual
3. Keep Scrolling till the end of the list so that all coins are populated. There should be about 400+ coins.
4. Select one of the coins, then click Ctrl A to select all.
5. Right click > Add to an existing Watchlist or Create a new watchlist.
Here's my list i created on 4th July 2025. You can import it if you want.
www.tradingview.com

BTC - Isn't it obvious where it will go?BTC shorts not likely here - needs movement to top for further down momemntum!

Bearish Bias
Bitcoin is currently trading around 107,849, showing signs of downward pressure:
🔻 MACD: Bearish crossover — MACD line is below the signal line, momentum is weakening.
🔻 Stochastic RSI: Rejected from mid-levels and turning down — indicating potential continuation of the bearish trend.
🔻 Moving Averages: Price is hovering below MA30 and struggling to reclaim key levels like 108,250.
📉 Key Levels
Resistance: 108,250 – 108,600
Support: 107,590 → 107,222
If BTC breaks below 107,590, expect further downside toward 107,222 or even 106,900.
🧠 Outlook: Bearish bias remains in the short term unless BTC reclaims and holds above 108,250 with volume.

BTCUSDT PRICE PREDICTION If Bitcoin closes two consecutive candles below the 50 Moving Average with full body confirmation, then nothing can stop the price from dropping further — unless it eventually touches the 112,000 level.

SHORTYou’re right to be cautious around the $107K–$108K zone—it’s a pivotal area. A slight dip could happen, but the broader trend and institutional backing suggest more upside if resistance yields. Watch $105K–$106K support and $108K–$110K resistance closely. To 103K

BTC - 4H chart - $105k KEY ZONE, up or we try again7/4
1. As long as price finds support above 105k, the structure remains to go up, breaking the bull flag to ATH.
2. Below 105k, bottom bull flag for support

BITCOIN BITCOIN ,instead of forecasting the price movement i will follow its action, it doesn't matter the direction ,am always right because i follow the direction.
break of the current supply roof on 3hr is a buy confirmation and target will be 115-117k and if we retest and fail to break the descending 3hr supply roof we are selling and target will be 94k (ema+sma ) 4hr demand floor and aggressive sell will be around 90k zone .
NOTE ;everybody is a good trader ,but not everyone is patient enough to wait for a free trade.
trading is 100% educated probability ,don't take it personal.

Long IdeaI'm seeing a possible bullish cypher pattern forming for the mini blow off top for btc. This mimics the SPX500 and currently in lagging state. Ater that, it will go back around 50k - 60k area, probably to eliminate saylor out before going to the 240k - 280k region..

BITCOIN BITCOIN ,instead of forecasting the price movement, i will follow its price action,
break of the current supply roof on 3hr is a buy confirmation and target will be 115-117k and if we retest and fail to break the descending 3hr supply roof we are selling and target will be 94k (ema+sma ) strategy 4hr demand floor and aggressive sell will be around 90k zone .
NOTE ;everybody is a good trader ,but not everyone is patient enough to wait for a free trade.
trading is 100% educated probability ,don't take it personal.
focus on learning ,rather than how rich you want to become overnight.
