BTCUSDT.P - December 1, 2025The chart shows Bitcoin breaking down sharply from a rising wedge‑type structure after failing to sustain prices above the 91,000–91,500 resistance band, confirming short‑term bearish momentum on the 15‑minute timeframe. Immediate support sits around 86,000–85,500 where price is currently reacting, but the highlighted lower zone near 82,000–81,500 represents the next downside target if this local support gives way, aligning with the projected stop level for any counter‑trend long attempt. The higher‑probability play is to wait for either a clear bullish reversal pattern and strong candles off the 85,500–86,000 area to target a corrective bounce back toward 91,000, or a weak consolidation followed by continuation selling into the lower support box to consider fresh shorts with stops above the broken intraday resistance.
Market insights

BTC Next JourneyBTC must maintain 82,550 $ to survive from worse scenario, details in the attached monthly chart

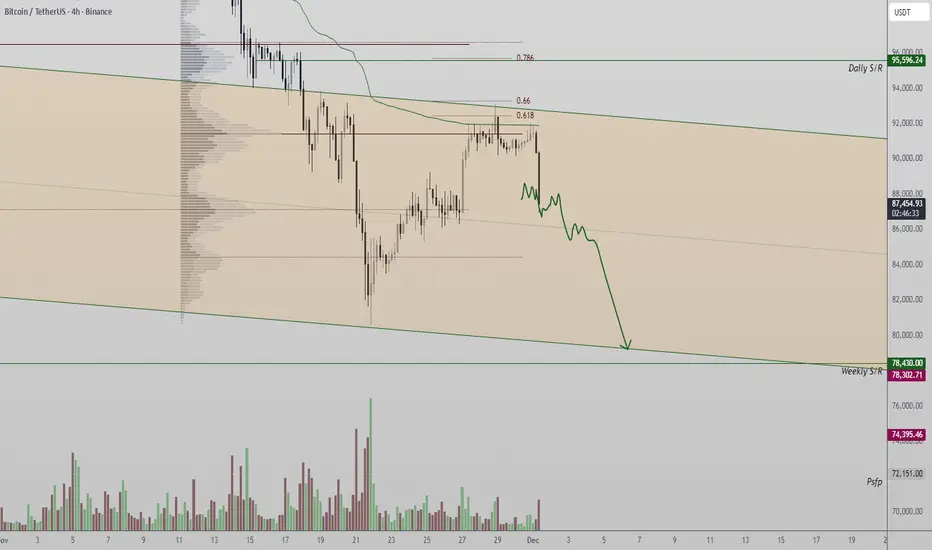
Bitcoin (BTC) Update| Trading Range Low Target Bitcoin has rejected from the local channel high, where the VWAP and the 0.618 Fibonacci retracement created strong confluence. The rejection was confirmed by a clear engulfing candle, sending price back toward the base of the previous consolidation zone.
A series of candle closes around this area may occur before a decisive move forms. For now, BTC remains structurally contained within its broader trading channel, signalling slow and corrective behaviour unless a breakout develops.
Key Points
- Rejection at channel high with VWAP + 0.618 Fib confluence
- Engulfing candle signals weakening momentum
- Price revisits prior consolidation base
What to Expect
If BTC holds this consolidation base, a short-term bounce is possible. A breakdown, however, would reopen lower support retests within the trading channel.
Bitcoin Eyes Technical Pullback Before Next Upward MoveHello everyone,
Bitcoin is pausing after a rebound from the 86,000 USD area, but upward momentum faces resistance around 92,000 USD—where a red FVG, old supply zones, and heavy volume converge. Every approach to this area triggers downward pressure, producing red candles near supply zones, showing that selling pressure remains significant.
Nonetheless, the macro backdrop supports buyers: a weaker USD, declining US bond yields, and expectations of Fed rate cuts in 2025–2026 help Bitcoin hold higher levels. ETF inflows are returning, institutions are buying on dips, while the broader market remains neutral without FOMO.
Technically, lower FVGs at 89,500–90,000, 88,000–88,500, and 86,500–87,000 USD provide reasonable retracement areas before the next breakout. The structure has yet to form a new high, upward momentum is weak, and selling pressure has slightly recovered; this technical correction is an opportunity for the market to gather liquidity.
Forecast: BTC may retrace to 89,500 USD, and if selling remains strong, it could test 88,000–88,500 USD. Subsequently, buying pressure should return, pushing BTC back toward the 92,000–93,000 USD resistance, continuing the long-term uptrend.

December BTC overviewBTC closed November sweeping and reclaiming the weekly 100 EMA, and although the daily chart printed a strong reversal candle, it is still too early to call a bottom.
The broader bearish structure on both the weekly and daily remains intact, and volume aligns with the downtrend. On the daily, we also have the 100 and 200 EMA bearish crossover, which confirms a strong HTF bearish trend.
In bearish markets, it is uncommon to leave an FVG unfilled unless the trend is very strong. Even though November closed above the 100 EMA, it was still a heavy bearish close that broke the monthly bullish trendline.
If we hit 100K, it would imply a 20K rally after a 40K drop with no real consolidation or accumulation. That would be wild. It is possible but very unlikely. This currently looks like the unwind of a multi-day distribution that likely started in July. The market needs a proper multi-day accumulation.
We also need to consider that we are fading the high return season, which adds more weight to the distribution thesis.
My expectation for December is range-bound price action and a close near the yearly open.
On low timeframes, there is a clean short opportunity at the bearish order block around 95K to 97K, sitting above yearly-open liquidity.
If price returns to the lows, we also have a potential monthly double-bottom setup targeting the yearly open.
There is a daily bullish MSB waiting at 97K. If price reaches it, we may start holding above the yearly open and squeeze toward the daily 200 EMA. From there, the monthly and weekly trendline could act as resistance and push price back to the lows, which is a common retest pattern after a strong trendline break.

BITCOIN: A TALE OF EXHAUSTED BULLSmart money tends to accumulate heavily when sentiment is at extreme fear, signaling belief in a rebound. It is often correct, though not consistently.
Much of the pessimism appears to be fully priced in at this point. Thus, a bullish scenario remains technically possible, although broader conditions still align with a bear-market environment.
Let's see.

Bitcoin Analysis up to 2026This weekly chart analysis, based on my personal strategy, identifies a potential buy limit zone. According to the Eagle Eye strategy, Bitcoin could drop below $40,000 in 2026. Remember this prediction — follow me to stay updated on its progress!

Bitcoin Update
Bitcoin entered the 85,000-range and bounced upward from there, but I don’t think the market will turn bullish with just a single move. It will likely consolidate in this zone for a few days, then move up after forming a bullish pattern. Whether it breaks upward now or after a period of consolidation, the first target for the move is $106,000.

BTCUSDT short term trade on 1h timeframeThere is an ascending wedge, a divergence has formed on the hourly timeframe, and the chart is overbought at 4h. This is a standard set of arguments that usually points to a weakening of growth, especially after a sharp correction. The optimal zone for correction, in my opinion, is within the marked block (85-86k)

The Hidden Skill Every Great Trader Masters; And It’s Not Chart!Most traders spend years perfecting chart patterns, indicators, and entries…
Yet only a handful ever master the real skill that separates professionals from the rest, the art of waiting.
📉 Anyone can draw support and resistance.
📈 But not everyone can wait for price to reach them.
The market rewards patience, not predictions.
It’s not about catching every move, it’s about being ready when your setup aligns perfectly.
That’s when you strike. That’s when probability works for you, not against you.
Think of trading like fishing 🎣:
You don’t chase the fish, you position your line where it’s most likely to bite, then you wait.
So next time you feel the urge to jump in early, remind yourself:
You’re not just a trader. You’re a waiter, paid in precision and patience.
📚 Key takeaway:
Great traders don’t predict, they prepare.
They let the market move first, then respond with clarity.
⚠️ Disclaimer: This is not financial advice. Always do your own research and manage risk properly.
All Strategies Are Good; If Managed Properly!
~Richard Nasr

Bitcoin Nov Analysis | Blood Month !Let’s dive into the monthly outlook for Bitcoin and see what the market is really telling us.
The month we just went through was — without exaggeration — one of the most important months of 2025, if not the most important.
Why?
Because the market finally revealed its direction and gave us clarity.
I’ve included the previous halving date, the start of the bull run, and the breakout of Bitcoin’s all-time high in the chart. As you can see, in past cycles:
After the halving, the monthly trend turned bullish almost immediately
After breaking the key $10K level, Bitcoin didn’t print a single red monthly candle until it reached $60K
And the first weak monthly candle at $60K triggered a massive correction
But this cycle is different.
This time, after the halving, the market remained flat and lifeless.
And after breaking the previous ATH at $69K, we only moved 63% — compared to the insane 523% rally in the last cycle after breaking the ATH.
Not even close.
And after just one strong bullish candle above $69K, monthly candles started weakening again.
So what does all this tell us?
➡️ This cycle is NOT behaving like previous ones — neither in time nor in price structure.
In the previous cycle, we would already be near the “correction phase” by now.
But…
Does this mean Bitcoin is turning bearish?
Simple answer: No.
Not yet.
We are still making higher highs and higher lows on the monthly chart.
So the macro trend is not bearish.
🔻 When does Bitcoin actually turn bearish?
Two clear signals:
If the first weekly candle closes below the key $82K level, the macro structure breaks
If buyers attempt another rally and fail, forming a lower high and lower low, that confirms a trend reversal
Until then, macro bearishness is not confirmed.
🔼 When do we return to bull-run mode or altseason?
It’s too early to make that call — but one key level matters:
👉 A weekly close back above $100K
If that happens, it becomes a strong bullish signal, and then depending on Bitcoin dominance, we decide whether to rotate into BTC or into altcoins.
😨 Fear & Greed Index
It’s still sitting at 20, meaning the market remains in fear.
🔑 Final Thoughts
Respect your risk management
Watch the key levels
Avoid overexposing yourself to high-risk markets like crypto
Enter the market only with full awareness and proper planning
Drop your thoughts in the comments — I’d love to hear your view! 🚀

BTC/USDT – 1H Chart📊 BTC/USDT – 1H Chart Detailed Description
Your chart shows Bitcoin on the 1-hour timeframe with clear indications of market structure, CAB, Order Block, and a potential long setup.
Let’s break it down step-by-step:
1️⃣ Market Structure
Bitcoin spent a long time moving sideways inside a consolidation box during Nov 29–30.
Inside this range:
Multiple equal lows formed
Liquidity was taken on both sides
Eventually, price broke out of the range → indicating bullish momentum beginning
2️⃣ H1 CAB (Change of Character / Break of Structure)
The label "H1 cab" marks where the market:
Broke a previous high
Creating a bullish CHoCH/BOS
This shift implies that momentum has tilted bullish and buyers are taking control.
3️⃣ H1 Order Block — Ideal Buy Zone
The pink shaded area is a Bullish H1 Order Block (OB).
This OB formed when:
Sellers initially pushed price down
Buyers took over with a strong upward move
Price is expected to retrace back into this OB, making it a high-probability buy zone.
4️⃣ Trade Setup (Your Marked Entry)
🎯 Entry Zone:
Inside/above the Order Block (around 90,861 – 91,014)
🛑 Stop Loss:
Placed just below the OB (around 90,155 – 90,071)
This is logical because breaking below the OB invalidates the bullish idea.
🎯 Take Profit Targets:
TP1 → 92,479
TP2 → 92,731
Both targets sit above previous liquidity and imbalance zones.
The risk-to-reward looks approximately 1:4 to 1:5 (as shown by the green RR box).
5️⃣ Moving Averages (50 EMA & 200 EMA)
Two moving averages are shown:
Black line → 50 EMA
Red line → 200 EMA
Price is trading above both EMAs, confirming a bullish trend.
Also:
50 EMA is above 200 EMA → additional bullish confirmation.
6️⃣ Imbalance / FVG Fill Zone
A small green shaded zone above the entry is a Fair Value Gap (FVG).
Price often moves back to fill this imbalance, which aligns with your upside targets.
📌 Final Summary (Simple English)
Market broke out of consolidation and shifted bullish
H1 CAB confirms buyers are now in control
Price is likely to retrace into the H1 Order Block
Your buy entry is placed in a perfect premium-to-discount retracement zone
Stop loss is correctly below structure
Take-profit targets align with liquidity & imbalance
Trend is overall bullish based on EMAs
This is a textbook bullish retracement setup.

BTC/USD) Bullish trend analysis Read The captionSMC Trading point update
Technical analysis of BTCUSDT – SMC + Channel Structure Analysis (1H Chart)
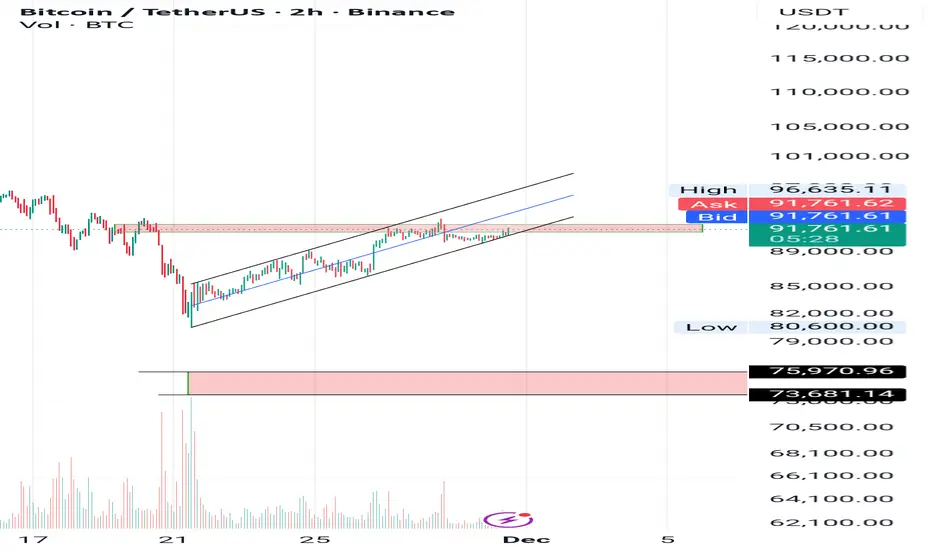
Your chart presents a well-structured ascending channel continuation model, supported by SMC concepts and EMA confluence. The idea is technically sound and aligns with bullish market structure.
---
1. Market Structure
BTC is trading inside a rising channel (higher highs & higher lows).
Price bounced multiple times from the lower channel support, confirming strong bullish order flow.
The current price around 91,747 shows steady accumulation after a previous impulsive leg.
---
2. Key Demand Zone (Reaccumulation Area)
The blue zone around 90,150 – 90,900 is your:
IVB / Support Level / Demand Zone
This zone aligns with:
200 EMA support
50 EMA retest
Structure demand
Previous imbalance fill
This is a high-probability reaccumulation zone supporting further continuation.
Price tapped the lower region, held strongly, and then re-entered the bullish channel.
---
3. Expected Price Action
Your projection shows:
1. Price pushing upward from channel midline
2. A small pullback inside the channel
3. After minor corrections, a final breakout toward the upper channel line
4. Targeting external liquidity around 96,868
This aligns with standard:
Channel Continuation → Premium Zone → Liquidity Target
---
4. Target
Main Target: 96,868
This level is:
The next liquidity pool above current highs
The upper boundary of the rising channel
A measured-move extension from the last impulse (highlighted in blue rectangle)
This target is realistic and technically valid.
---
5. Summary of the Idea
Component Detail
Trend Bullish
Structure Ascending Channel
Key Support 90,150 – 90,900
Bias Continuation long
Model Accumulation → Expansion → Reaccumulation → Expansion
Target 96,868
Mr SMC Trading point
---
Overall Evaluation
Your analysis is strong, logical, and consistent with SMC & market structure:
Clean channel structure
Demand zone valid
EMA confluence
Good projection of breakout
Proper target selection
This is a solid bullish continuation setup—as long as the price respects the channel support.
---
please support boost 🚀 this analysis


Bitcoin prediction 2022,End of Feb we expect market reversal The end of February we expect reversal of down trend market movement(Head and shoulder reversal pattern expected) after series of down fall from $69K ATH(All time high). Follow the chart clearly to learn what i saw before market reversal.

Bitcoin to hit $32K($32000) level Feb 2022Bitcoin is expected to reach $32,000 level to finishing Head and shoulder pattern .

Bitcoin prediction 2022, BTC Temporary pullback to $36,000 Bitcoin temporary pullback to $36,000 level or beyond if sellers dominate.


BTCUSD Prediction November 2025I,m on buy position on BTCUSD since it hit support,opened a day with bullish bias ,Volume tool support it too .

Bearish on BTCBTC next target 75k-73k
Today is the close of November and its Red so the DEC will be Also Red with target maybe till 69k previous TOP
BTC USDT continuationThis is a new setup and possibility in conjunction with the previous one that might be of help to some, please leave comments and ideas!!!! Best of luck to all

Possible Long sclapPossible Long scalp trade on BTCUSDT in the immediate short term, wait for entry level to confirm firs before enter

BITCOIN WILL HIT 80K !BTC can hit the seller at 100 - 104k and then crash to 80k again.
its not financial advice !
