Bitcoin Bulls Are Losing Power - Signal To Sell NOW!!!?Bitcoin Bulls seem to be losing power. If this rising wedge aka Contracting triangle starts to break down, the descending triangle we are trading at will resume and MARKETSCOM:BITCOIN might go as low as $93k!!! Is your trading strategy ready for that?
BTCUSDT.P trade ideas

BTC Looking To Break Above Resistance Of Bull-FlagBTC showed a strong move off support at 100310 that is now looking to break above resistance of the bull-flag, which will signal the end of the decline. A daily break above 106800 is confirmation of the uptrend continuation, which should target ATH in the first instance. Following a pullback, BTC should then make its way to new highs, with a first target at 138000, which is a 100% extension from 74500, with a bull-flag mid-point.
Trades
Long on a break above the descending resistance (close on the 30min chart)
Add to long position on a break above 106800
Reduce position size at 112000, to allow for a brief pullback or potential consolidation at ATH
Return to 100% allocation on a solid close above 112000 or a pullback to 106800

[SeoVereign] BITCOIN Bearish Outlook – June 29, 2025We are the SeoVereign Trading Team.
With sharp insight and precise analysis, we regularly share trading ideas on Bitcoin and other major assets—always guided by structure, sentiment, and momentum.
🔔 Follow us to never miss a market update.
🚀 Boosts provide strong motivation and drive to the SeoVereign team.
--------------------------------------------------------------------------------------------------------
Hello,
This is Seobeorin, approaching technical analysis not as a result but as a prediction, from a realistic perspective.
I am presenting a bearish view on Bitcoin as of June 29, 2025.
If you refer to the Ethereum idea from June 27, 2025, you can confirm that I presented a bearish perspective on Ethereum at the time. The basis for that perspective is still valid, and we are currently waiting for the take-profit level to be reached. The reason I selected Ethereum at the time was because I believed that the downward pressure on Ethereum was relatively stronger than that on Bitcoin.
However, based on today’s Elliott Wave count on the Bitcoin chart, I now judge that Bitcoin is also likely to experience some short-term downward pressure. Therefore, I am presenting a short position idea on Bitcoin.
The first take-profit target is set near $106,056. Depending on future price movements, this take-profit target may be narrowed or expanded. I will continue to track this idea, and as it develops, I will align the reasoning accordingly to organize the thought process more clearly.
Thank you.

BTCUSDTBitcoin has two paths: if it stabilizes above 111,800, it can go to the target of 144,540, but if this move is a fake break, it can go to the targets of 91,410 and even 85,662, but it is expected to fall and then move.

BITCOIN TWO LONG TRADE SETUPS Two potential long trades for Bitcoin are mentioned.
Each trade has an entry point, profit target, and stop loss.
A bullish divergence in the 24-minute time frame is recommended before making the trade.

BTC Analysis (4H)This analysis is an update of the analysis you see in the "Related publications" section
Since the red arrow was placed on the chart, Bitcoin's bullish phase has ended and it has entered a corrective phase. This correction appears to be forming a Diametric pattern, and we are currently in the middle of wave E.
After interacting with the demand zone, the price may move toward the specified targets.
A daily candle closing below the invalidation level will invalidate this analysis.
For risk management, please don't forget stop loss and capital management
Comment if you have any questions
Thank You

BTC - Will the Bearish Channel continue?Market Context
After a strong impulsive rally earlier in the year, BTC has been trading within a descending channel on the daily timeframe. This corrective structure suggests a period of consolidation and redistribution, as price oscillates between the channel's boundaries. The repeated rejection from the upper trendline and the inability to break through key highs reinforce the bearish bias in this structure.
Buy Side Liquidity Sweep Potential
Price is currently positioned just beneath a relatively clean swing high, sitting above the mid-range of the channel. This high represents a clear area of Buy Side Liquidity—stop losses from short positions and pending breakout orders from longs are likely clustered there. An engineered sweep of this high would serve as a strategic move for larger participants to collect liquidity before driving price lower.
Fair Value Gap as a Pivot Point
Beneath current price lies a Fair Value Gap—a visible inefficiency formed during a fast upward move earlier in the structure. This Gap remains unfilled and offers a compelling target for price once the Buy Side Liquidity Sweep occurs. It represents a logical zone for price to rebalance before deciding on continuation or reversal. Should price break below the Gap cleanly, it would confirm the bearish intent and potentially accelerate toward the lower bounds of the channel.
Channel Continuation Structure
The overall geometry of the channel remains intact, and the price respecting both upper and lower boundaries strengthens the likelihood of a continuation toward the downside. If the Buy Side Liquidity Sweep and subsequent rejection occur, the market could be poised for another leg lower—possibly seeking the next structural support closer to 90,000 or even toward the lower extremities of the channel around 80,000–82,000.
Final Thoughts
This chart reflects classic price delivery behavior: corrective structure, engineered liquidity sweeps, and the magnetic pull of inefficiencies like Fair Value Gaps. Whether you’re actively trading or simply observing, this is a clean, educational setup to learn from.
If this breakdown helped you see the market a bit clearer, I’d really appreciate a like. And feel free to share your thoughts or counterviews in the comments—your insights make the analysis even more valuable.

Bitcoin has dropped for profitable purchasesBitcoin is within the range. Quite a bit of time has passed since the last retest, and the liquidity pool that has formed below 106345 may not allow the price to fall on the first attempt.
Global and local trends are bullish. Enter a buy position after a false breakout of support and the formation of a local reversal pattern on TF m5-m15
Scenario: if, after a false breakout, price consolidation forms above 106500, then the entry point could be a breakout of local highs (breakout of the structure - ‘bos’).

Bitcoin long back to $110000Recently opened a long position on bitcoin. Aggressive entry. Soon I anticipate a push back up to 110000
4hr trend is still in tact. 1hr trend is bearish failed to make new LL.
Lets see how it goes.
2RR trade roughly.

BTC price prediction As my personal analysis if BTC crossing 🚸 110655 without touching the previous high 111960 then BTC moving down 👇 directly or after sideways condition some days

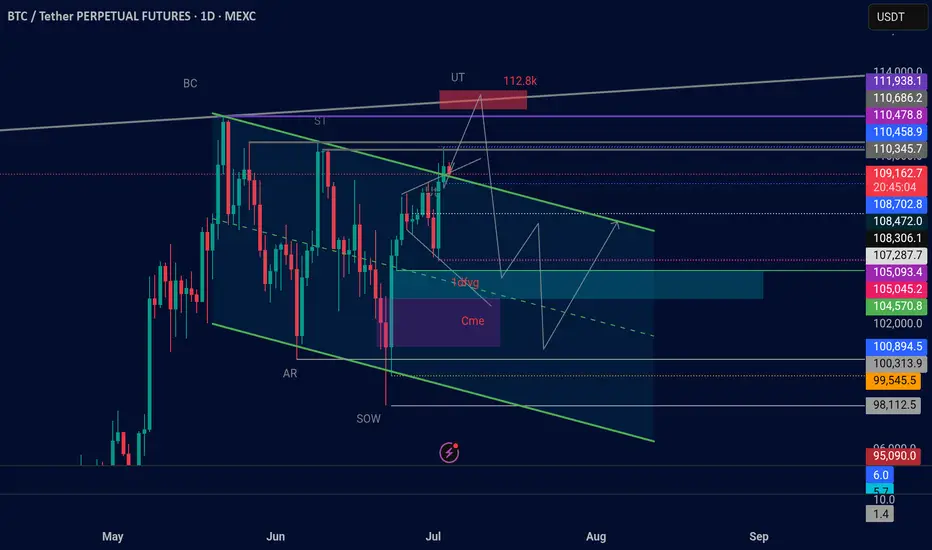
BTC Wyckoff distribution idea...Based on the Wyckoff distribution methodology, the current chart suggests an upward trajectory, considering the presence of unfilled CME and FVG gaps. The anticipated scenario involves a continuation of the UT phase, potentially reaching targets around 112k/113k, followed by a correction towards the CME gap at approximately 102.5k.
Subsequently, a continuation into the UTA phase is expected, which may indicate the conclusion of the bull market.
Btc Wyckoff distribution Based on the Wyckoff distribution methodology, the current chart suggests an upward trajectory, considering the presence of unfilled CME and FVG gaps. The anticipated scenario involves a continuation of the UT phase, potentially reaching targets around 112k/113k, followed by a correction towards the CME gap at approximately 102.5k. Subsequently, a continuation into the UTA phase is expected, which may indicate the conclusion of the bull market.
BTC breakoutIf the daily candle closes above the trendline, a breakout toward a new all-time high is likely to occur very soon.


CONSOLIDATIONfriends BTC will consolidate inside the channel for couple of days . if it break upside it will make all time high definitely. if it break downside there is chance of dump till 105k.

Let's fire it up!BTC has to break $110,217.2 for good, and then I'd say we're off to the moon and beyond.

BTC - Reaching to the highest resistance.Bitcoin is approaching its highest resistance zone ever. As it approaches this zone, we need to closely observe the reactions including:
- Price patterns
- Candlestick patterns
- BTC Chart.D


BTC UP OR NO📈 Bitcoin to Reach $113K, With a Breakout Path to $120K – A Professional Outlook
After analyzing the macro trend, technical structure, market sentiment, and on-chain behavior, I strongly believe that Bitcoin is on a clear trajectory toward $113,000, with a potential extension to $120,000 if key resistance is broken.
---
🔍 1. Technical Analysis Perspective
Macro Bullish Structure: Since the 2022 bear market bottom, Bitcoin has maintained a consistent higher highs and higher lows pattern, confirming a long-term uptrend.
Fibonacci Extension: The 1.618 Fibonacci extension from the $15.5K bottom to the $69K peak gives a projected target of around $113K.
Historical Fractal Patterns: In previous cycles, Bitcoin has always broken past previous all-time highs by 1.5x to 1.75x, placing this cycle's peak in the $110K–$120K range.
Ascending Triangle Breakout: On the weekly chart, BTC is forming a bullish ascending triangle with the top resistance at ~$73K. A confirmed breakout targets $113K as the next major supply zone.
---
🧠 2. Market Psychology & Cycle Timing
Halving Effect: Historically, Bitcoin peaks occur 9–12 months post-halving. The most recent halving was in April 2024, aligning a potential peak by Q1 or Q2 of 2025.
Psychological Resistance Zones: The $100K–$113K range is not only a Fibonacci target but also a powerful psychological barrier. Once breached, FOMO and institutional momentum could push BTC rapidly to $120K.
Retail vs Institutional Flows: Data shows increased ETF inflows and long-term holder accumulation — a classic pre-peak indicator.
---
🔗 3. On-Chain and Whale Behavior
Realized Price vs Market Price: BTC market price is well above long-term holder realized price, signaling bull market phase 2 (the steep climb).
Dormant Supply: Over 70% of BTC has not moved in 6+ months, showing strong holder conviction. This reduces sell pressure as price increases.
Whale Accumulation Zones: Whales are heavily positioned around $60K–$65K, and there is minimal sell volume above $100K on major exchanges, opening the path to $113K with low resistance.
---
🚀 Conclusion:
> Based on comprehensive technical patterns, market structure, psychological phases, and on-chain behavior, Bitcoin is highly likely to reach $113,000.
If momentum continues and $113K is breached with volume confirmation, a sharp move toward $120,000 becomes not only possible — but likely.

BTC — Major Resistance & Long TP Zone1. TP longs in red resistance zone (110k–111k)
2. Watch for rejection: possible short setup on bearish reaction
3. Key support at 105k — monitor for bounce
4. If price holds above red zone, scenario invalid — look for breakout

Bitcoin is in a downward trend.Hello dear friends.
Considering the trend of Bitcoin, it is expected that this Bitcoin will fall to around $100,000.
❌Please note that this is just a prediction, so be careful with your capital.

BTCUSDT: Positive CDV Divergence for Potential Long Setups• Market Overview: Bitcoin currently sits at a pivotal point. Although the price movement has been somewhat indecisive, we’re watching closely for signs of bullish momentum.
• CDV Divergence Focus: Our attention is on a potential positive Cumulative Volume Delta (CDV) divergence. This takes shape when the price makes a lower low but CDV registers a higher low (regular bullish divergence), or when the price posts a higher low and CDV shows a lower low (hidden bullish divergence). These patterns can hint at growing buying interest even if price action hasn’t caught up yet.
• Support Zones (Blue Boxes): The highlighted blue zones on the chart signal potential support levels where buyers may step in. These are mapped from prior demand areas or structural support points.
• Trade Setup: Should a confirmed positive CDV divergence appear near or inside one of these blue zones, it could offer a strong case for a long entry. This would suggest that while the price may look weak, buying strength is quietly building underneath.
• Managing Risk: Any long entry must be accompanied by a well-defined invalidation level—typically just below the blue box support or the lowest point of the divergence.
Disclaimer: This is a technical pattern-based analysis intended for informational purposes only. Trading involves risk. Always perform your own due diligence and assess your risk appetite before entering any trades.

BITCOIN TOUCHED 110K — THEN REJECTEDNot what bulls wanted to see.
With massive gaps below, this kind of price action ain’t it.
