Analytics: market outlook and forecasts
WHAT HAPPENED?
Last week, the medium-term downtrend continued, and we reached the next significant volume support zone - $88,000-$82,000.
On November 21, the daily candle closed at the largest volume, comparable to the dump on October 10, 2025. However, there was no equally significant price movement, which indicates an active struggle between buyers and sellers within the framework of this candle.
WHAT WILL HAPPEN: OR NOT?
At the moment, there is an initial rebound. However, consumer activity remains weak so far, so a retest of the lower levels is possible. There are strong volume zones above, which may become targets for buyers this week.
We expect a test of the $84,000-$82,000 volume anomaly zone, either from current prices or after the test of the first resistance zone of $90,000-$92,300 (volume zone). Then we can expect a more confident resumption of buys with the potential to move towards $95,000.
If buys from the designated zone don’t resume, a test of the $74,600 level is likely with the prospect of reaching lower price levels.
Buying Zones
$97,000–$93,000 (high-volume zone)
$88,000–$82,000 (high-volume zone)
Selling Zones
$101,000–$104,000 (accumulated volume)
$105,800–$106,600 (local resistance)
$109,500–$110,700 (accumulated volume)
$112,400–$113,300 (accumulated volume)
$114,700–$115,700 (accumulated volume)
$120,900–$124,000 (high-volume zone)
IMPORTANT DATES
Macroeconomic developments this week:
• Tuesday, November 25, 7:00 a.m. (UTC) — publication of German GDP for the third quarter of 2025;
• Tuesday, November 25, 13:30 (UTC) — publication of the basic index of retail sales and their volume, as well as the US producer price index for September;
• November 25, Tuesday, 3 p.m. (UTC) — publication of the CB U.S. Consumer Confidence index for November;
• November 26, Wednesday, 1 a.m. (UTC) — announcement of the New Zealand interest rate decision;
• Wednesday, November 26, 10:00 a.m. (UTC) — UK autumn budget forecast;
• Wednesday, November 26, 13:30 (UTC) — publication of US GDP for the third quarter of 2025, as well as the number of initial applications for unemployment benefits in the United States;
• Wednesday, November 26, 15:00 (UTC) — publication of the basic price index of personal consumption expenditures and sales data new housing in the USA in September;
• Friday, November 28, 13:00 (UTC) — German consumer price index for November is published.
*This post is not financial recommendation. Make decisions based on your own experience.
#analytics
Trade ideas

BTC: Start Going LongAfter experiencing a sharp decline, BTC has now begun to show signs of stopping the fall. It will not see another continuous downward trend in the short term and is gathering momentum waiting for a rise. This is currently an excellent opportunity to buy.
BTC Trading Strategy for Today:
BTCUSDT Buy @ 81000 - 83000
TP: 90000 - 92000
With 15 years of focus on trading, I will provide accurate signals and strategies every day to help you achieve stable profits in the market. Don’t miss the daily analysis.

BTC, "A breakout first ... then absoloute fear"We’re looking at Bitcoin on the 4H timeframe, and what we’re seeing right now is just a pullback within a bearish structure.
Is the volume supporting this move up?
Definitely not.
That tells us this push higher is most likely caused by short liquidation, not genuine buying or fresh long positions entering the market.
My expectation?
BTC could fake-break the 90K level, dance around that zone for a bit, and then roll over again—
but this time, not as aggressively as before.
I’ve marked the target area for you on the chart, and I’ll keep updating as the structure develops.
If there’s any coin you want analyzed, drop it in the comments.
Your support helps me deliver even deeper, more accurate breakdowns and be your roadmap in this market.
Thanks for being here — appreciate every one of you.

BTC: Is it possible we are forming HEAD & SHOULDERS on D1 ??If we zoom back a bit on Daily BTC chart we can see it might be possible that we will have another leg formation as a right shoulder for Head and Shoulders pattern.

BTCUSDT: Elliott Wave 5 Completed – Road to $60k-$70k Support?Technical Breakdown: Analyzing the daily chart structure, Bitcoin appears to have completed a major 5-wave impulsive cycle within a long-term ascending channel. The recent peak marks the termination of Wave (5), coinciding precisely with the upper channel boundary. The RSI indicator also suggests overextended conditions, signaling a potential trend exhaustion.
Projected Path (The Blue Line): Following the completion of the motive phase, a corrective structure (A-B-C) is anticipated:
Relief Rally / B-Wave: We may see a short-term bounce or a "Bull Trap" retesting the $95,000 - $106,000 zone. This area serves as a critical supply zone.
Corrective Leg Down: Rejection from the highs should trigger a deeper correction towards the dynamic support of the channel.
Key Levels to Watch:
Resistance Zone: $95,000 - $106,000
Target / Support Zone: $60,000 - $70,000. This zone represents the confluence of the lower channel trendline and previous structural support, offering a high-probability area for a long-term bounce.
Conclusion: While the macro trend remains bullish, the risk/reward ratio at current levels is unfavorable. Traders should exercise caution and look for the completion of the corrective phase near the $60k-$70k region for optimal re-entry opportunities.
Disclaimer: This analysis is for educational purposes only and does not constitute financial advice. Always manage your risk.

BTC/USDTFollowing the OTE pullback, price has corrected into the discount zone.
If the market provides proper confirmation signals, this area may offer valid long opportunities.

BTC market snapshotI’m expecting a price pause on BTC soon — the probability is high. On the daily timeframe we’re extremely oversold, and many altcoins are showing clear bullish divergences, which usually signal at least a slowdown.
I don’t rule out a deeper move toward the $60k–70k range, especially with the current frustration around the stock selloff and large players exiting MSTR. If we can hold the $80k zone, BTC has a good chance to enter a wide consolidation range between $80k and $108k. If we fail to hold it, the probability of a crypto winter increases sharply — with a real chance of a deep panic sell.
For now, I’m leaning toward the long side. I’m long on ETH: I think Ethereum might partially decouple from BTC thanks to the staking ETF narrative, and alts may also show strength once BTC stabilizes.

$BTC Update – Quick & HonestStill bearish on Weekly & Daily.
Only 30-min & Monthly are holding green.
I know trading against higher TF trend is dangerous but here’s why I stayed calm & even bought the dip for members.
1- Weekly bounce zone + Monthly higher low
2- Weekly untested bullish Order Block + dynamic trendline support
Daily close below 83.4–85.6k = real trouble.
Till then → low volume, sideways, waiting for a trigger.
30-min flipped bullish yesterday → I posted free update here instantly.
Exact buy entries, SL & TPs → given in exclusive group.
That’s it. No hype, no bullshit, just levels & logic.

Next Move Bitcoin Is 72.5K the Reversal Zone ?BTCUSD is still evolving inside a W-X-Y-X-Z complex corrective structure which is typical after a strong bullish leg this formation indicates that the market is still correcting but without showing any signs of a deeper bearish reversal
Based on my analysis Bitcoin seems to be targeting the $72,500 level which aligns with
A major liquidity zone
A relevant harmonic extension
The probable completion area for wave Z
A historically significant dynamic support zone
If price reaches this level and reacts with clean bullish signals rejection, divergence, momentum recovery this could mark the end of the corrective pattern and trigger a new bullish impulse
As long as BTC stays above major support levels the mid-term bullish structure remains intact.
I am closely watching the $72,500 zone as the key level where the correction might end and upside continuation could begin

BTC 1 week analysisbtc will take support from this area and 70% chance are the reversal going to happen from this area. we need to see how the BTC will react from this area.

BTC temporary recovery - short term this week📌 BTC Weekly Outlook Update — Plan Remains on Track
Bitcoin continues to follow the expected roadmap with precision. The recent price action confirms a corrective move to the upside before resuming the larger bearish structure.
📍 Current Structure & Price Behavior
BTC has shown a short-term bullish retracement after forming a temporary low. However, the overall outlook remains bearish as price continues to trade below key moving averages and under the major downtrend line.
Price is now heading toward the resistance area between 94,300 and 100,780 USD, where the following confluence exists:
Previous support turned resistance
Fibonacci retracement zone
Trendline rejection zone
Liquidity pool
This area remains the most important zone to watch early this week.
📈 Expected Move — Still Valid
The original plan remains unchanged:
Short-term move upward into the supply zone at 94K → 100K.
Rejection and continuation of the downtrend.
Price targets the Fibonacci 1.618 extension zone at ~80,000 USD.
🎯 Key Target: Fibonacci 1.618 (≈ 80,500 USD)
This level is crucial as it aligns with:
✔ A major demand zone
✔ The 1.618 Fibonacci extension
✔ A deep liquidity sweep level
✔ Potential cycle correction completion
This area is expected to act as the macro support level where buyers step in aggressively.

DeGRAM | BTCUSD continues to decline below $85k📊 Technical Analysis
● BTC/USD continues to move within a broad descending channel, rejecting the dynamic resistance line multiple times and forming lower highs.
● Price is failing to reclaim the 88–90K resistance zone, and the structure points toward a continuation lower into the 82–80K support region as momentum weakens.
💡 Fundamental Analysis
● Bitcoin remains under pressure as risk sentiment cools and ETF inflows slow, with stronger USD liquidity weighing on crypto.
✨ Summary
Resistance: 88–90K. Targets: 82K → 80K. Medium-term bearish bias while below channel resistance.
-------------------
Share your opinion in the comments and support the idea with a like. Thanks for your support!

BItcoin Short Term Analysis (4H)As we had already identified Bitcoin’s support zone in previous analyses, this area is still valid.
To assess Bitcoin in the lower timeframes, there are two possible scenarios:
One is that it starts moving upward from the current prices, and the other is that it revisits the green zone once more, forms a double bottom, and then moves toward the red target.
A daily candle closing below the invalidation level will negate this analysis.
For risk management, please don't forget stop loss and capital management
When we reach the first target, save some profit and then change the stop to entry
Comment if you have any questions
Thank You

BTCUSDT Long-Term Swing Setup: Key Supports to WatchBitcoin is consolidating above the $114,000 level, showing resilience after its latest pullback. The broader structure remains bullish as long as higher lows and the ascending trendline hold. Key supports below will be critical in determining whether buyers can sustain momentum or whether a deeper correction unfolds.
🔍 Technical Analysis
Current price: $114,405 (Binance Perpetual).
Price has bounced from recent lows and is attempting to reestablish upside momentum.
The long-term ascending trendline continues to guide bullish structure.
Strong demand zones remain layered below price action.
🛡️ Support Zones (if pullback occurs):
🟢 $101,412 – 1H Support (Semi-Risky Trade)
First reaction level, suitable for intraday setups.
Stop-loss: Below $97,802
🟡 $85,210 – Daily Support
A major base of demand, critical for maintaining broader structure.
Stop-loss: Below $83,701
🟠 $69,887 – Last 4H Support (Protected by Daily)
Long-term structural support and high-conviction entry zone.
Stop-loss: Below $68,614
🔼 Resistance Levels:
Immediate resistance: $116,000
Break above → continuation toward $120,000 psychological level.
🧭 Outlook
Bullish Case: Price sustains above $114,000 and pushes past $116,000 → opens the door to retest $120,000+.
Bearish Case: Break below $101,412 → correction into $85,210. Losing this zone exposes $70,000.
Bias: Bullish while above $101,412 and long-term trendline holds.
🌍 Fundamental Insight
Bitcoin remains supported by expectations of rate cuts, weakening USD momentum, and continued institutional adoption. However, macro risks (global liquidity, regulation, or risk-off sentiment) could add volatility, especially if equities face broader pressure.
✅ Conclusion
BTCUSDT remains structurally bullish above $114,000, with demand stacked across multiple support zones. Bulls aim for a push toward $120,000, but a break below $101,412 could trigger a deeper correction toward $85,210.
⚠️ Disclaimer
This analysis is for educational purposes only and does not constitute financial, investment, or trading advice.

Short-term analysis of Bitcoin (12H)After the heavy drops | which we had already identified in previous analyses () | Bitcoin is now approaching a strong supportive order block.
From the point where we marked the red arrow, Bitcoin entered a bearish phase, and it is expected that wave C of this phase will complete around the green zone.
We will see whether the price reaches the green area or not.
The initial target for this bounce can be the 95K to 96K range.
For any reason, the closing of a daily candle below the invalidation level will break the structure and invalidate this upward correction
For risk management, please don't forget stop loss and capital management
When we reach the first target, save some profit and then change the stop to entry
Comment if you have any questions
Thank You

Bitcoin pump will come soonBitcoin is standing at multiple support areas like the 0.702 Fibonacci, trendline, and weekly 100MA, and a pump is very likely to come soon pushing the price to 110k.

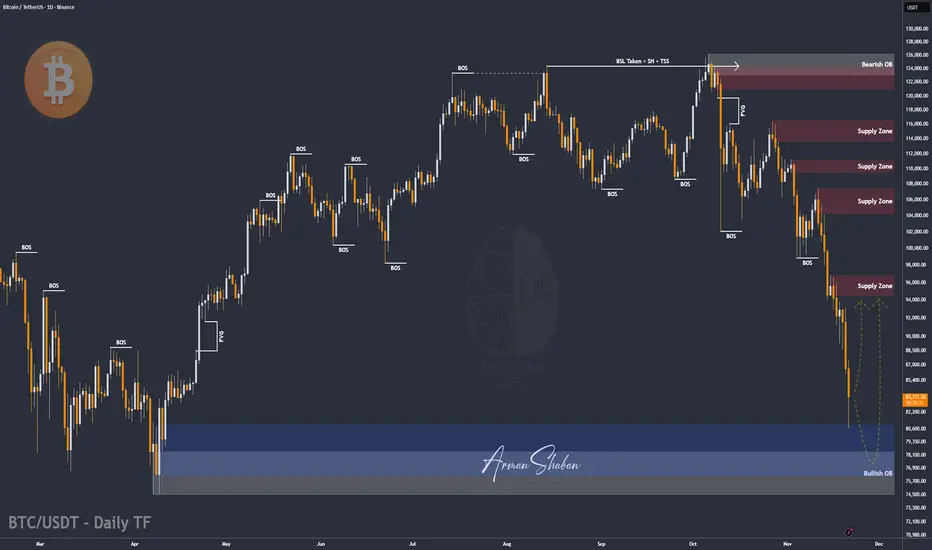
BTC/USDT | Bitcoin Hit Major Demand, What’s Next?By analyzing the #Bitcoin chart on the daily timeframe, we can see that the price dropped exactly as expected and fell sharply to $80,500. Once it reached this major demand zone, buyers stepped in and Bitcoin bounced back to around $83,900.
As long as BTC can hold above the large demand zone between $74,000 and $81,000, we can expect the next bullish wave to start.
From my perspective, the trend is not bearish! this is still a healthy correction.
From the ATH at $126,200, Bitcoin has corrected 36%, which is completely normal in strong uptrends. Now it’s time to watch for decreasing selling pressure and the beginning of a stronger upside move. This analysis will be updated soon.
Please support me with your likes and comments to motivate me to share more analysis with you and share your opinion about the possible trend of this chart with me !
Best Regards , Arman Shaban
Bitcoin Daily Analysis | Nov 22- Still a sellers’ market ?Fear & Greed Index is sitting at 12, which puts the market deep in Extreme Fear territory.
Today is one of those days where we simply wait for the market to show a reaction, and then we act based on our scenarios — not predictions.
Let’s break down the possible paths:
🔹 Scenario 1 — Bounce & Higher Low Formation
Bitcoin has shown a solid reaction to the $82,000 level and has bounced off that zone.
However, at the moment I still don’t have a valid long setup in my system. The structure simply isn’t ready yet.
What I’m waiting for:
A rejection from any nearby level
Followed by a higher low above $81,000 on the 4H timeframe
And then a breakout above the high that created that structure
That breakout would serve as my entry trigger.
Depending on Bitcoin Dominance (BTC.D), the position could be on BTC itself or on strong altcoins.
🔹 Scenario 2 — Retest of $82,000 & Short Opportunities
Another likely scenario is a retest of the $82,000 level.
If you're planning to take a short from that area, you’ll need to:
Drop to the 15-minute timeframe
Look for a clean structure
Enter only after a confirmed break of the local low (15m or 1H)
⚠️ Keep in mind:
Short trades here carry higher risk — simply because the market is printing lower highs and lower lows, meaning the trend is still bearish, and we want to stay aligned with the market’s momentum.
🔹 Scenario 3 — A Range for the Rest of the Week
There’s also a chance that this week will simply range.
If you haven't already picked out strong altcoins for the upcoming week, you might end up without a position — which is perfectly fine.
No position is better than a bad position.
✔ Final Notes
Never take risk management lightly — it matters more than any technical pattern.
Volume can be extremely helpful today to confirm whether the market supports your position’s direction.
Thanks for reading my analysis.
Wishing you a profitable day ahead — stay safe and disciplined! 🚀📉

Bitcoin Report — Is the sell-off over?Short answer: Not proven yet. Price is at a critical support area (≈ 85k–90k) after heavy selling; a bounce is possible but downside risks remain wide if that support fails.
Key technical facts
Current support zone: ~85,000–90,000 — price has bounced here recently and printed notable wicks around 80k during the weekend, showing buying interest. If this holds we may see consolidation in the 80–90k band.
Downside liquidity gap: There’s little on-chain / order-book support between 83k and 75k, so a break of 83k could accelerate a drop toward ~75k quickly.
Brave New Coin
+1
Momentum & structure: Market shows lower highs / lower lows and strong bearish candles—classic continuation structure until proven otherwise. Short-term oversold readings increase probability of a bounce or range, not a clean reversal.
CoinDesk
Fundamental drivers (why traders should care)
ETF flows: U.S. spot Bitcoin ETFs have seen record outflows this month, a big headwind to price (reduces institutional bid). This means less structural support and more sensitivity to risk-off moves.
CoinDesk
+1
Macro (Fed / USD): Market pricing around Fed rate cuts is moving; if expectations for no December cut stick, the USD stays strong and risk assets (incl. BTC) remain pressured. Recent news shows cut probabilities have weakened.
Reuters
+1
Miners / supply dynamics: Recent on-chain signals show miners moving from heavy selling toward more accumulation, which could reduce sell pressure over time — but this is early and not yet decisive.
The Coin Republic
+1
Practical trading plan (two scenarios)
Bullish (probability: conditional):
Condition: Clear double-bottom / strong bullish reversal candle in 85–90k zone + improving ETF flow or weaker USD.
Entry: Scaled longs on confirmed bounce (e.g., reclaim of local resistance).
Targets: 95k → 100k+.
Stop: below the weekend wick low (protect vs fast gap down).
Bearish (higher-probability while structure is bearish):
Condition: Close below 83k or failed bounce (strong bearish candle).
Entry: Short on break and retest or on conviction close below 83k.
Target: ~75k (fast path, low liquidity).
Stop: back above retest level / broken support.
Risks & timing
Weekend liquidity and ETF flow volatility can cause violent moves; use smaller size and wider stops.
Macro surprises (Fed commentary, US data) can quickly flip USD/risk dynamics — always check the economic calendar.
Bottom line: A bounce around 85–90k is plausible and would likely produce a choppy consolidation. But until 83k holds and macro/ETF flows stabilise, the door to 75k remains open. Trade small, wait for confirmation (retests / clean reversal candles), and manage risk tightly.

BTCUSDT SELL WITH LIMIT ORDER!!!!BTCUSD completed my last recent analysis predictions today we have the making a strong pull back into my poi after my inducement am taking a sell from that limit order after my min charts confirmations......

Lingrid | BTCUSDT April Lows Revisit - Possible Reversal ZoneBINANCE:BTCUSDT is rebounding from the major support zone near 82,300 after completing a full extension inside the downward channel. Price is now pressing into the descending trendline — a level that has capped every bullish attempt since early November. The market is forming a higher-low structure on the retest, hinting at an early accumulation phase.
From a fundamental side, Bitcoin is stabilizing as ETF inflows recover and risk sentiment improves after softer U.S. data this week, reducing pressure on high-beta assets. If buyers manage to break above the descending trendline and reclaim 93,300, this would confirm the start of a bullish recovery cycle.
➡️ Primary scenario: Break above the trendline → move toward 93,300.
⚠️ Risk scenario: Failure to break the trendline sends CRYPTOCAP:BTC back to for another liquidity sweep.
If this idea resonates with you or you have your own opinion, traders, hit the comments. I’m excited to read your thoughts!

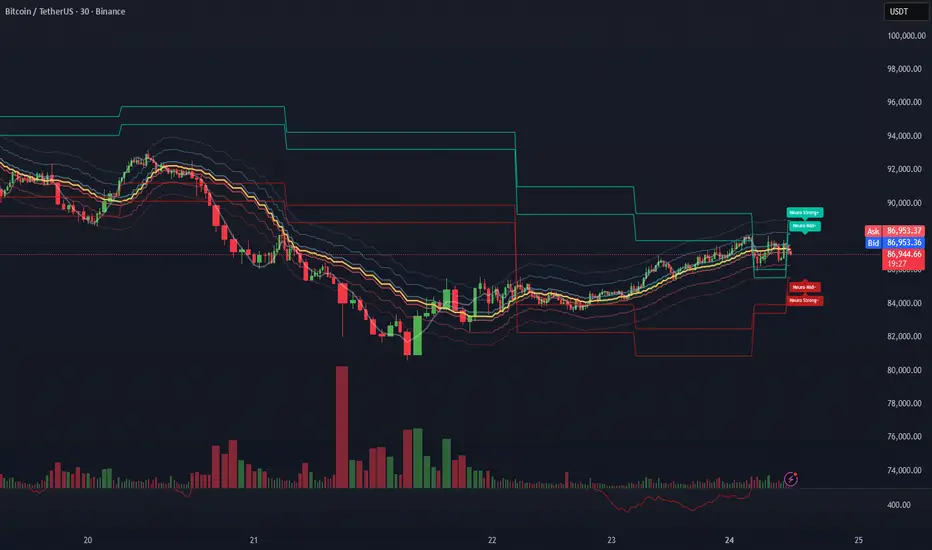
BTC (30m) – NPC-Based Rebuild After Dump | Volatility Zones After the sharp selloff, BTC has shifted from a momentum breakdown into a nonlinear stabilization regime inside the NeuroPolynomial Channel (NPC).
Instead of predicting direction, NPC helps quantify where price sits inside its volatility distribution.
1. Current Statistical Position
30m timeframe:
• Trading near NPC Core Cluster
• Distance from lower stress band: ~2.1%
• Distance from upper expansion band: ~1.8%
• Compression factor vs prior leg: ~0.63
This puts price in a statistical mean corridor, not in a trend exhaustion zone.
2. NPC Volatility Zones
Zone Area Distance Role
NPC Strong+ Upper 88,900 – 89,500 +1.8% Over-extension
NPC Upper Band 87,800 – 88,200 +0.8% Continuation band
NPC Core Cluster 86,900 – 87,300 Current Structural equilibrium
NPC Lower Band 85,600 – 86,000 -1.3% Rejection / test
NPC Strong- Lower 84,300 – 84,800 -2.6% Breakdown re-entry
3. Conditional Scenarios (Not Predictions)
Scenario A – Controlled Rebuild (~60%)
If price holds above the core cluster:
→ Rotation zone: 87,800 – 88,200
→ Stretch zone: 88,900 – 89,500
(~+1.8% to +2.3%)
Scenario B – Failed Rebuild (~40%)
If price loses the core cluster:
→ First test: 85,600 – 86,000
→ Risk zone: 84,300 – 84,800
NPC is used here only as a statistical structure lens, not a signal generator.
Let me know if you’re applying this on ETH / SPX / NIFTY — curious how it adapts across markets.
BTC/USDT CHART UPDATE !!Bitcoin (BTCUSDT) is currently approaching a major support zone between $76,000 and $80,000. The chart shows two possible scenarios:
If support holds, a rally to $90,000 or above is possible, continuing the overall long-term bullish trend.
If support breaks, a downward move is likely to retest the lower support zone before any major recovery move can begin.
The chart suggests that this area is crucial; the next major action depends on how the price reacts to this support zone.
DYOR | NFA
