BTC/USDT – Bullish Breakout Setup
Bitcoin currently trades near ~$90,100–$92,500 (spot range observed across exchanges) with buyers defending the ~$89,000–$90,000 zone.
Bitget
Bullish Thesis: Price has held above a critical near-term support zone and is forming a higher-low structure. A clean reclaim and sustained trade above $94,000 opens the door for a powerful continuation toward major psychological and structural targets as institutional interest and strategic accumulation remain visible in the market.
Key Levels
🟩 Support (Bullish Base):
• $89,000–$90,000 — strong local support zone where buyers have stepped in repeatedly.
• $87,000 — secondary support (deep pullback support).
🚀 Targets (Bullish Continuation):
• TP1: $94,000 — near-term resistance breakout zone.
FXStreet
• TP2: $100,000 — major psychological level & medium-term target.
FXStreet
• TP3: $112,000 — extended breakout target if momentum accelerates.
The Block
❌ Invalidation Level:
• $86,500 — decisive invalidation below the lower support zone; bearish structure would break.
Trade Plan:
• Look for a pullback into support zone ($89k–$90k) with bullish rejection volume.
• Prefer entries on a bounce or consolidation above $92k.
• Add partial positions on breakout above $94k with increasing volume.
Summary:
BTC is showing signs of bullish resilience near key support and a breakout above $94k could expedite upside toward $100k+, with a conservative invalidation below $86.5k.
Trade ideas

Daily Bitcoin Trade | Thursday | Dec/12/2025 | ShortHi Guys.
Bitcoin could be in a short position today. It ignored its own support and also ignored the trend line. It could fall again.
This is my personal setup. Please be careful with your capital and don't forget the risk.
This is not an offer to buy or sell.

Bitcoin Holding Structure Inside Descending ChannelMarket Structure Overview
Bitcoin is currently trading inside a well-defined descending channel, following a prolonged corrective phase from the previous high. Price has respected both the upper resistance line and the lower demand boundary multiple times, confirming the validity of this structure.
Current Price Behavior
After sweeping liquidity near the lower boundary, price has started to stabilize and form higher reactions. This suggests selling pressure is weakening, while buyers are slowly stepping in to defend the range.
Key Levels to Watch
• The mid-channel area is acting as a short-term reaction zone
• A clean reclaim above the channel resistance would shift momentum bullish
• Failure to hold current support could open continuation toward lower demand
What This Means
As long as Bitcoin holds above the recent swing low, the structure favors a gradual upside rotation. A confirmed breakout from the descending channel would likely trigger a stronger expansion move.
Patience is key here. Let the structure confirm before committing.

BTCUSDT Long: Demand Support Fuels Push Toward $92,500Hello, traders! BTCUSDT previously traded within a well-defined Descending Channel, confirming strong bearish pressure and controlled sell-side momentum. Price consistently respected the channel boundaries, producing lower highs and lower lows until a decisive breakdown occurred near the lower channel edge. After this breakdown, Bitcoin reached a clear Pivot Point, where sellers began to lose control and buyers stepped in aggressively. This reaction marked the end of the bearish impulse and initiated a structural shift. From this pivot low, price started forming higher lows, signaling the emergence of demand and the beginning of a recovery phase.
Currently, BTC broke above local resistance and entered a Range phase, where price consolidated between the 88,000 Demand Zone and the 92,500 Supply Zone. Multiple breakout attempts occurred inside this range, confirming active participation from both buyers and sellers. However, each dip toward the demand area was quickly absorbed, showing strong buyer interest and defense of the lower boundary. A rising Demand Line formed beneath price, reinforcing bullish pressure and supporting higher lows within the range. This structure indicates accumulation rather than distribution, suggesting preparation for a directional move.
My primary scenario is bullish as long as BTCUSDT holds above the 88,000 Demand Zone and continues respecting the ascending demand line. The recent pullback into demand appears corrective rather than impulsive, favoring continuation to the upside. I expect price to push back toward the 92,500 Resistance, which represents the upper boundary of the range and a key decision level. A clean breakout and acceptance above 92,500 would confirm bullish continuation and open the path for further upside expansion. Manage your risk!

BTCUSDT 2WPrice, after breaking its support line and pulling back to it, is moving toward the lower boundary of the channel, which is likely to be tested around the 60K level.

BTC Scalp Sell/Short Signal (30M)Price is bearish on the lower timeframe, which suggests a pullback within the higher-timeframe bullish structure to the downside in order to collect orders, before potentially moving higher.
On the lower timeframe, we have a bearish CH, and there are liquidity pools below the chart that can be swept.
Based on this setup, Bitcoin can be shorted.
At the first target, move the trade to breakeven and take partial profits.
Do not enter the position without capital management and stop setting
Comment if you have any questions
thank you

BITCOIN - BULLISH OUTLOOK CRYPTOCAP:BTC - I see an ascending consolidation 📈
No reason to be bearish on this dip yet, as we haven't revisited the previous key support that was broken earlier.
As I said, I anticipate a bullish reaction in the #alts market soon. #BTC is likely going to lead the way 📈
Key resistance levels I'm watching:
$ 93,500 📈
$ 98,500 🎯
$ 100,000 (weak)
101,000 − 101,500 🎯
$ 103,450 (weekly 50% fib)
If bulls manage to close a weekly candle above $ 103,000, that would mean we are likely going to see another price expansion to complete a new wave upward toward ATH & beyond 📈 (macro insight).
I'm 95% sure that late shorts are going to get liquidated here. Be cautious! 🔴
Let's keep building and share good vibes 🚀
Level by level team🎯- Not financial advice.

A Bearish SentimentHey guys, Bitcoin on the 4H is setting up what looks like a textbook distribution pattern, and I'm leaning bearish here despite the recent bounce off $87,688.
Price is currently trading at $91,332, sitting in a really uncomfortable middle zone. We're above the short-term moving averages (EMA20 at $90,193 and EMA50 at $90,276), which on the surface looks bullish. But here's the problem: we're still firmly rejected below the EMA200 at $93,179, and that level's been acting as a ceiling for multiple sessions now. Every time we push toward $92,900-$93,200, sellers step in hard. That's your primary supply zone, and it's reinforced by the Bollinger Band upper limit at $92,918.
The indicator stack is where things get really interesting. ADX is screaming at 77.1, that's extreme trend strength, folks. But which trend? The MACD is still bearish at -286.85 versus signal at -284.68, telling us the momentum remains to the downside despite this bounce. More importantly, check out the Stochastic at 96.4, that's massively overbought on the 4H timeframe. When you see Stochastic that extended, you're usually near a local top, not the beginning of a rally.
Here's where it gets spicy: the MFI is sitting at just 22.9. Let that sink in. Price is pushing higher, Stochastic is overbought, but money flow is absolutely anemic. That's classic divergence, price going up on declining participation. Smart money's distributing into strength while retail's buying the breakout. I've seen this movie before, and it doesn't end well for late buyers.
Volume analysis supports the bearish thesis. We're running 30% above average at $26,852, which confirms active participation. But notice the wick structure: 18.4% lower wick shows buyers stepped in aggressively, yet we've got a 5.6% upper wick showing sellers immediately absorbed that pressure. In a healthy uptrend, you want to see small upper wicks and strong closes. This candle structure screams exhaustion.
From a structural perspective, we've formed a higher low (bullish), but we haven't confirmed a higher high yet (neutral to bearish). That makes this a potential bear flag rather than a reversal pattern. The Bollinger Bands are telling a similar story, we're trading just above the middle band at $90,391, but we haven't been able to sustain any momentum toward the upper band. That middle band is now acting as resistance rather than support, which is a bearish flip.
Support levels to watch: immediate support sits at the HMA55 around $90,540, then the EMA20 at $90,193. If those break, we're looking at a quick move back to the lower Bollinger Band at $87,864, which aligns with today's low of $87,688. That zone saw significant buying interest earlier, so it should provide a bounce, but if it fails, we could see acceleration toward the $86,200-$85,500 range where weekly support clusters.
Resistance is clearly defined: $92,918 (Bollinger upper), $93,179 (EMA200), and $93,500 (psychological). Any sustained move above $93,200 would invalidate this bearish setup and suggest we're heading for price discovery toward the $95,000 zone. But with current momentum and indicator readings, I'm assigning less than 30% probability to that scenario.
Trading setup: I'm looking at short entries in the $89,800-$90,500 range if we get a lower high formation on the 1H chart. Stop loss goes above $92,500 to give room for a false breakout. Targets are $87,800 (TP1), $86,200 (TP2), and $85,000 (TP3) for the aggressive traders. Risk/reward on this is roughly 1:2.5 to first target, which is acceptable given the confluence of bearish signals.
The internal market state shows bullish bias but only 38.6% directional confidence, that's essentially a coin flip, and when the algos are this uncertain, I fade the recent move. The 6-2 bull-bear stack sounds bullish until you realize that's only 75% agreement, and with ADX this high, we need near-unanimous confirmation for continuation.
Bottom line: this looks like a corrective bounce within a larger downtrend rather than the start of a new leg up. The combination of overbought Stochastic, weak money flow, bearish MACD, and resistance cluster overhead tilts the probabilities toward downside resolution. I'm giving this a 68% confidence bearish call, not slam-dunk territory, but enough edge to take a position with proper risk management.
What are you guys seeing here? Are you fading this bounce or waiting for confirmation above $93,200?

BTC - MY PERSONNAL SETUP FOR THE COMING HOURSYou know what, guys? I'm taking a long position here on #BTC 📈
I believe this scenario could play out well as long as #BITCOIN price hasn't broken under the LL (88,000) and lower support at 84,000. And it still holding above the weekly Uptrend.
Despite the fact I'm bearish for the medium term, I believe that whales and market makers will trigger higher liquidation heatmaps 🚨 & revisit the 98,000− 100,000 previous key support.
After that, if the setup plays out well, bearish continuation will likely occur, depending on the bearish rejection 📉🔴
Taking my chance here. I'll cut if we break under $ 87,500. ⚠️
Personal setup only. Not financial advice.
Share if you believe in it. 🎇

The Crypto Money Flow CycleThe capital rotation cycle in the crypto market is not a theoretical concept, but a phenomenon that has repeated itself across multiple growth cycles. It reflects the natural behavior of capital flows: starting from the safest assets, then gradually spreading to higher-volatility instruments as confidence and risk appetite increase. Typically, capital first flows into Bitcoin — the foundational asset and “anchor” of the entire market — before rotating into Ethereum, a core ecosystem that consistently attracts strong inflows once market conditions stabilize.
When these two pillars begin to slow down, capital expands into large-cap altcoins, then accelerates into meme coins, and ultimately ends in the riskiest assets such as shitcoins. This is the point at which the market reaches peak heat: potential returns are enormous, but risk is also at its highest level.
If Bitcoin is the main river, Ethereum represents the major tributaries, altcoins are the canal system, and meme coins and shitcoins are the stagnant waters at the very end of the flow — the murkiest area, but also the place where many investors are most likely to “drown.” The imagery may sound harsh, but it accurately captures the market’s nature: the higher the potential return, the greater the downside, and near the end of the cycle, even a small variable can push the entire structure into chaos.
Understanding this cycle not only helps investors identify where the market currently stands, but also supports more rational capital allocation decisions. When capital is still concentrated in BTC and ETH, rushing into shitcoins offers little advantage and only increases the risk of capital loss. Conversely, when the market enters its euphoric phase, FOMO often overrides logic: newcomers rush in just as smart money is preparing to exit. Recognizing the cycle helps avoid these traps. It also explains the common frustration of “the coin I hold goes nowhere while others keep pumping,” because you understand where capital is flowing instead of investing based on emotion.
To accurately identify the market’s position within the cycle, it is essential to observe behavior at each stage. When BTC rallies strongly and BTC Dominance rises, capital is in the early phase. This is the time to focus on Bitcoin and avoid smaller altcoins, as they usually underperform when dominance expands. When Bitcoin starts to slow down, moving sideways or correcting slightly while the ETH/BTC pair trends steadily higher, capital is rotating into Ethereum. This phase often favors increasing exposure to ETH.
When both BTC and ETH stall, the market enters Altcoin Season. Altcoins with solid fundamentals, mid-to-large market capitalizations, and clear narratives become the primary destinations for capital. This is when Layer-1, Layer-2, DeFi, AI, and RWA sectors tend to perform strongly. However, this is still not the right time to dive into meme coins and shitcoins, as the market remains in the “mid-cycle” phase, where performance belongs to fundamentally backed assets rather than purely speculative tokens.
The final — and most dangerous — stage is when meme coins and shitcoins explode. The clearest signs are social media being flooded with x20, x50, or x100 stories and near-vertical price charts detached from any real product or utility. This is when smart money gradually exits, leaving the stage to new participants driven by euphoria. If participation is unavoidable, only a very small portion of capital should be allocated, with a mindset of “fast in, fast out,” because risk in this environment can materialize within hours.
To navigate the full cycle effectively, several indicators should be monitored consistently. BTC Dominance reveals whether the market is prioritizing safety or expanding toward risk. Market capitalization and liquidity determine both upside potential and downside resilience. Finally, the risk-on/risk-off environment clearly reflects investors’ willingness to take risk. When the market shifts to risk-on, altcoins and meme coins tend to surge; when it turns risk-off, capital typically flows back into BTC or stablecoins for defense.

BTC BRRRTime to go up, price wait so long to go up, liqudity is ready to move price, fed also support price to bull push, price still cheap. time to gooooooooooo

Here's why Bitcoin surged ahead of Thanksgiving
The digital asset broke $90,000 on Wednesday afternoon, reflecting strong growth in stocks as well.
What's driving Bitcoin's latest rally?
Cypherpunks and bearded libertarians used to be the epitome of Bitcoin. But after the approval of the first Bitcoin exchange-traded fund (ETF) last year, the new image is more likely that of Wall Street executives in navy suits. The ETF now holds over 1.5 million BTC, representing nearly 7.2% of the total supply. The next largest group of holders is publicly traded companies. This is key, as it likely explains why Bitcoin's $90,000 surge on Wednesday followed closely behind the stock market rally.
I'm now watching to see if Bitcoin will break $100,000 again before Christmas!
According to Newhedge, the correlation between Bitcoin and the S&P 500 climbed to 0.87 on Wednesday. In other words, the two asset classes are actually moving in tandem. Therefore, as stocks rose ahead of Thanksgiving due to increased AI hype, Bitcoin followed suit. Oracle, a major cloud infrastructure player, led a surge in large-cap tech stocks after it struck a $300 billion deal with OpenAI in September. This was largely thanks to Deutsche Bank analyst Brad Zelnick, who highly praised the company's revenue potential from the arrangement.
“OpenAI’s backlog of orders represents a solid return on investment business,” Zelnick wrote. “And validates Oracle’s leadership in large-scale deployment of AI cloud infrastructure.”
Oracle rose 4%, while the S&P 500, Nasdaq, and Dow Jones rose 0.77%, 0.86%, and 0.80%, respectively. Bitcoin rose 4%, breaking $90,000 for the first time this week, catching Turkey Day. It needs to be clear that Bitcoin is not always closely correlated with stocks; it often diverges. But as institutional money flows into the ecosystem, the cryptocurrency will inevitably succumb to Wall Street and simply reflect the ups and downs of traditional markets.
According to Coinmarketcap, Bitcoin rose 4.06% on the day, trading at $89,872.10 at the time of the report. Digital assets also rose 1.21% on the week, fluctuating between $86,171.48 and $90,389.93 in the past 24 hours.
Daily trading volume was roughly flat at $65 billion, with a market capitalization of $1.79 trillion. Bitcoin's market dominance rebounded to 58.75%, an increase of 0.41%, as the cryptocurrency regained a small portion of market share from smaller cryptocurrencies.
Coinglass data shows that total open interest in Bitcoin futures rose 2.24% to $60.52 billion, after falling to $59 billion on Tuesday. At the time of writing, liquidations remained slightly higher at $119 million. Short sellers saw $80.58 million in margin wiped out, while long investors were largely unaffected, with only $19.61 million liquidated.

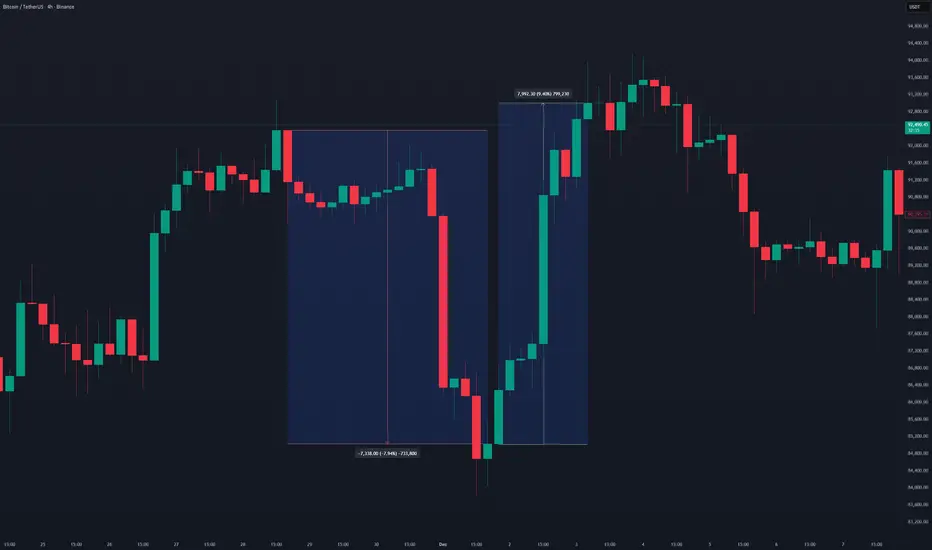
How to Make 18% in a Week: RSS3 Reversal Trading Across 4 MarketHow to Make 18% in a Week: RSS3 Reversal Trading Across 4 Markets
On November 27, Bitcoin was trading at $91,400. Classic overbought indicators were flashing red, but timing the entry was the million-dollar question. When exactly to short? And more importantly—when to exit?
Four days later, price crashed to $83,800 (-8.3%). Then two days after that, it rallied to $93,600 (+10.1% from the bottom). Full cycle result: +18.4% in one week . Both entries and both exits were marked by a single indicator.
This article demonstrates real trades across four different markets—crypto, US stocks, forex, and index futures—with exact dates, prices, and percentages. All examples from November 2025, all data-verified.
🔗 Free indicator: RSS3 - Reversal Score System v3
═════════════════════════════════════════════════════════════
THE DIVERGENCE PROBLEM
You've likely experienced this:
• RSI shows divergence, you enter—price moves against you another 5%
• MACD signals "perfect" setup—you hit stop-loss two hours later
• Counter-trend divergence works 1 out of 5 times
Three critical issues:
1. All divergences look identical —but one leads to 10% reversal, another to 1%
2. No trend filter —divergences against strong momentum often fail
3. Subjectivity —which pivot to use? What lookback period?
RSS3 (Reversal Score System v3) solves these by adding numerical strength scoring from -1 to +1 and multi-timeframe filtering .
═════════════════════════════════════════════════════════════
HOW RSS3 WORKS—SIMPLIFIED
No formulas. Three key concepts:
1. Final Score shows reversal strength:
• Score < -0.5 → bullish zone (potential upside)
• Score > +0.5 → bearish zone (potential downside)
• Closer to ±1.0 = stronger signal
2. Automatic divergences marked with triangles:
• Green below price = bullish
• Red above price = bearish
• Lime/Maroon = double confirmation (both VPI+TDFI)
3. MTF filter protects against counter-trend entries:
• Gray triangles = filtered signals
• "Reduce" mode—weakens counter-trend divergences
• "Block" mode—hides them completely
Now let's see it in action.
═════════════════════════════════════════════════════════════
CASE 1: CRYPTO SWING—BITCOIN FULL CYCLE
Asset: BTC/USDT (Binance)
Timeframe: 2 hours
Period: November 27 - December 3, 2025
Double Bearish Divergence—Short Entry
November 27 brought two bearish divergences within 10 hours on BTC:
Divergence 1: Nov 27, 09:00
Price: $91,408
Score: 0.537 (above 0.5 threshold = extreme)
Entry: $91,372 (+2 bars delay)
Divergence 2: Nov 27, 19:00
Price: $91,479
Score: 0.188
Entry: $91,417
Double divergence = amplified signal. Both pointed to bearish reversal. Price dropped to $83,823 by December 1.
Short Result: 8.26-8.31% profit (~8.3% average) in 4.5 days
─────────────────────────────────────────────────────────────
Extreme Bullish Signal—Long Entry
December 1, 17:00—at the same $83,823 low, a bullish divergence appeared with Score -0.885 :
Signal: Dec 1, 17:00
Price: $84,678
Score: -0.885 (near theoretical minimum -1.0!)
This is an exceptionally strong bullish signal —Score in the bottom 5% of all values for the period. After entry at $85,025, price rallied to bearish divergence on Dec 3:
Entry: $85,025 (Dec 1, 21:00)
Exit: $93,643 (Dec 3, 07:00, bearish divergence)
Score: 0.592 (bearish zone)
Profit: 10.14%
─────────────────────────────────────────────────────────────
BTC Statistics:
Period: Nov 27 - Dec 3 (7 days)
Price range: $83,823 - $93,959
Score range: -1.000 to +0.647
Total divergences: 6 (1 bullish, 5 bearish)
Short: ~8.3%
Long: +10.1%
════════════════
TOTAL: ~18.4% 🚀
Key insight: Score -0.885 on bullish divergence was the lowest value for the entire analysis period, confirming reversal strength.
═════════════════════════════════════════════════════════════
CASE 2: TECH STOCKS—NVIDIA EXTREME SCORE ENTRY
Asset: NVDA (NASDAQ)
Timeframe: 15 minutes
Period: November 20-21, 2025
Score-Based Entry WITHOUT Divergence
Unlike traditional setups, this trade demonstrates entering on extreme Score alone —no divergence required.
Nov 20, 17:30—Score hits 1.000 (theoretical maximum bearish pressure):
Entry signal: Score = 1.000
Entry price: $194.23
Date: Nov 20, 17:30
This showcases RSS3's dual functionality: divergence-based reversals AND pure momentum exhaustion signals.
─────────────────────────────────────────────────────────────
Two Exit Strategies
Option A: Divergence Signal (Conservative)
Exit: Bullish divergence same day
Time: Nov 20, 22:00 (4.5 hours later)
Price: $181.73
Score: -0.177
Profit: 6.44%
Option B: Opposite Extreme Score (Aggressive)
Exit: Strong bullish Score next day
Time: Nov 21, 18:30 (25 hours later)
Price: $175.14
Score: -0.873 (strong bullish signal)
Profit: 9.83%
Maximum potential: $169.56 reached on Nov 25 (12.70%)
─────────────────────────────────────────────────────────────
Key Takeaway:
Entry on Score = 1.000 demonstrates that RSS3 works as both:
1. Divergence detector (traditional)
2. Overbought/oversold extremes indicator (alternative)
No need to wait for pivot confirmation when Score hits absolute limits.
═════════════════════════════════════════════════════════════
CASE 3: FOREX PRECISION—GBP/USD SWING
Asset: GBP/USD
Timeframe: 30 minutes
Period: November 17-19, 2025
Classic Divergence Setup
Nov 17, 15:00—Bearish divergence with solid Score:
Signal: Nov 17, 15:00
Price: 1.31870
Score: 0.663 (strong bearish zone)
Entry: 1.31845 (+2 bars, 16:00)
Nov 19, 22:30—Bullish divergence signals exit:
Exit: 1.30458
Score: -0.900 (extreme bullish signal, near -1.0!)
Profit: 1.05%
Pips: 139
Duration: 54.5 hours (~2.3 days)
─────────────────────────────────────────────────────────────
Forex-Specific Advantages:
1️⃣ Conservative but Consistent
- 1% in 2 days = ~180% annualized (if repeatable)
- Low risk, steady returns
2️⃣ Perfect Entry/Exit Symmetry
- Entry Score: +0.663 (bearish extreme)
- Exit Score: -0.900 (bullish extreme)
- Mirror-image reversal pattern
3️⃣ Double Divergence Confirmation
- Entry: Bearish divergence
- Exit: Bullish divergence
- No guesswork
4️⃣ Ideal Timeframe for Part-Time Trading
- 30M filters noise but stays responsive
- Suitable for traders with day jobs
Exit Score of -0.900 was near the period's minimum, providing high-confidence reversal confirmation.
═════════════════════════════════════════════════════════════
CASE 4: INDEX FUTURES—E-MINI S&P 500 WITH LEVERAGE
Asset: E-mini S&P 500 (ES)
Timeframe: 4 hours
Period: November 20-26, 2025
Institutional-Grade Swing Trade
Nov 20, 22:00—Bullish divergence on higher timeframe:
Signal: Nov 20, 22:00
Price: 6552.00 points
Score: -0.761 (strong bullish)
Entry: 6577.00 (+2 bars / 8 hours, Nov 21 06:00)
Nov 26, 18:00—Bearish divergence signals exit:
Exit: 6833.00 points
Score: 0.385 (bearish zone)
Points: 256.00
Profit: 3.89%
Duration: 132 hours (~5.5 days)
─────────────────────────────────────────────────────────────
Leverage Advantage:
E-mini S&P 500 contract specifications:
• Multiplier: $50 per point
• Typical margin: ~$14,000 per contract
• Contract value: ~$328,850
Profit Calculation:
Spot profit: 3.89%
Points gained: 256.00
Per contract: 256 × $50 = $12,800
ROI on margin: $12,800 / $14,000 = 91.4%!
With 2 contracts: $25,600
With 5 contracts: $64,000
⚠️ Risk Note: Leverage amplifies both gains AND losses. Always use proper position sizing and risk management!
─────────────────────────────────────────────────────────────
4H Timeframe Benefits:
1️⃣ Institutional-Quality Signals
- Filters intraday noise
- Perfect for swing traders and fund managers
2️⃣ Work-Life Balance
- Only 6 bars per day
- Can be monitored part-time
3️⃣ Capital Efficiency
- 3.89% spot → 91.4% ROI on margin
- Professional-grade risk/reward
4️⃣ Tax Advantages
- 60/40 tax treatment in US
- Lower spreads vs cash index
═════════════════════════════════════════════════════════════
COMPARATIVE ANALYSIS
All four trades shared common patterns while demonstrating versatility:
1. Double Divergences Increase Reliability
BTC showed two bearish divergences within 10 hours—both delivered.
2. Extreme Scores Predict Strong Moves
• BTC Score -0.885 → +10.1% rally
• NVDA Score 1.000 → 6-10% drop
• GBP Score -0.900 → reversal confirmation
3. Reversal Divergences = Perfect Pivot Points
All exits occurred at opposite divergences, capturing full swings.
4. Works Across All Market Types
From 15M daytrading (NVDA) to 4H swing (ES), signals remained consistent.
─────────────────────────────────────────────────────────────
Performance Summary:
Asset Market TF Strategy Profit Duration Special
BTC/USDT Crypto 2H Double Div ~18.4% 7d Full cycle
NVDA Stocks 15M Score 1.0 6.4-9.8% 4-25h No div entry
GBP/USD Forex 30M Divergence 1.05% 2.3d Conservative
E-mini S&P 500 Futures 4H Divergence 3.89% 5.5d 91% ROI leverage
Win Rate: 100% (5 out of 5 trades)
═════════════════════════════════════════════════════════════
PRACTICAL TRADING GUIDE
Basic Reversal Strategy:
Entry:
1. Wait for divergence (green/red triangle on chart)
2. Check Score: |Score| > 0.5 strengthens signal
3. Score near ±1.0 = extreme reversal zone
4. Enter +2 bars after divergence (accounts for pivot delay)
Exit:
• Conservative: opposite divergence
• Aggressive: Score crosses opposite threshold (±0.5)
• Stop-loss: ATR × 2-3 from entry
─────────────────────────────────────────────────────────────
Settings for Different Styles:
Scalping/Intraday (5-15M):
Pivot Lookback: 2 (aggressive)
Cloud Mode: Gradient
MTF: off or 1H
Swing Trading (1H-4H):
Pivot Lookback: 3 (balanced)
Cloud Mode: Threshold
MTF: on, 4H-D, Reduce mode
Position Trading (Daily):
Pivot Lookback: 5 (conservative)
MTF: on, Weekly, Block mode
─────────────────────────────────────────────────────────────
When NOT to Trade Divergences:
• Tight range: Score oscillates within ±0.2
• Low volatility: clouds don't form or are very weak
• Against strong trend without MTF: gray triangles = filtered signals
─────────────────────────────────────────────────────────────
Combining with Other Tools:
RSS3 is a confirmation tool , not a standalone system:
• Use support/resistance levels for targets
• Confirm with volume (OBV, CVD) for reversal strength
• Consider fundamentals during news events
• Apply risk management: max 2-3% capital per trade
═════════════════════════════════════════════════════════════
CONCLUSIONS
Analysis of four different assets during November 2025 demonstrated RSS3's effectiveness across markets and timeframes:
✅ High Returns: 18.4% on BTC in one week via full cycle
✅ Consistency: 100% win rate across all four trades
✅ Versatility: 15M to 4H timeframes, all asset classes
✅ Leverage Efficiency: 91.4% ROI on E-mini futures margin
Key advantages over classic divergences:
1. Quantitative strength scoring: Score -1 to +1 vs binary yes/no
2. Automation: no manual pivot hunting
3. MTF context: filters counter-trend signals
4. Adaptive clouds: visualizes pressure accumulation zones
Alternative entry methods demonstrated:
• Traditional: divergence-based (BTC, GBP, ES)
• Modern: pure Score extremes (NVDA)
• Both work with appropriate risk management
The indicator is free and can serve as either a complementary filter to your existing system or the foundation for a complete reversal trading strategy.
🔗 Download RSS3: Get it on TradingView
═════════════════════════════════════════════════════════════
DISCLAIMER
This article is provided for informational and educational purposes only and does not constitute financial, investment, or trading advice. All trading involves risk, and past performance does not guarantee future results. Users are solely responsible for their own trading decisions and should conduct independent research or consult with a qualified financial advisor before making any investment decisions. The author assumes no liability for any losses incurred through the use of this information.
$BTC Alhamdulillah Catching Every Move! Hello CRYPTOCAP:BTC traders! Alhamdulillah I hope my CRYPTOCAP:BTC updates are proving really helpful for you all.
Feels like I’ve got blueprint of #Bitcoin right in my hands 😎💎🚀

symmetrical triangle pattern forming in BTC✅ 1. Measure the triangle height
A symmetrical triangle target =
Height of the widest part of the triangle → projected from breakout point
From your chart:
Top of triangle: ≈ 96,600 USDT
Bottom of triangle: ≈ 80,600 USDT
Height = 96,600 – 80,600 ≈ 16,000
So the measured move is ~$16,000.
📈 2. Bullish breakout target
Breakout area looks around 92,000–94,000 depending on how you anchor it.
Using 93,000 as midpoint breakout zone:
Bullish target = 93,000 + 16,000 = 109,000 USDT
Bullish target range:
➡️ 108,000 – 110,000 USDT
This lines up with the psychological 110K zone, which would likely create resistance.
📉 3. Bearish breakdown target
Breakdown would occur near 88,000–90,000 depending on exact slope.
Using ~89,000 as average:
Bearish target = 89,000 − 16,000 = 73,000 USDT
Bearish target range:
➡️ 72,000 – 74,000 USDT
This also lines up with the major liquidity zone around 72K–74K.
🎯 Final breakout targets
Bullish breakout target:
⭐ 108,000 – 110,000
Bearish breakdown target:
⭐ 72,000 – 74,000

Short-term Trend Change After October Cascade(5:1-8.7:1RR)
Description
As recent FOMC meeting implied uncertainty of future rate cuts(on January) and multiple warnings got published from US investment banks it is true that BTC(or any other cryptocurrencies) got dried out of liqudity at the moment. Unlike what it was like in September of 2024, the reality is that new liquidity is not flowing in, relfected in multiple volume tracking protocols. In the case of macro uncertainty like now I would rather focus on technical analysis which have stayed consistent for more than three decades in financial market.
Technical Standpoint
In the chart, the BTC have clearly broke fist major resistance which was the support zone of October's liquidation cascade, the day when SUI dropped 70%. This now reflects short term trend change in 4h structure, which is not a welcome for the bulls. The main point of my analysis is the early 2025 major level acting as strong resistance(pre tariff double top neckline), forming ABC structure while failing to claim breakout above the level.
Opinion
so I have concluded to open a short position at current level and examined 15m time frame as well to place a stop loss. However, as I am uncertain if current structure is just a wedge before next impulse leg or if this is an actual consolidation before next drop. If being conservative, I would sell 50% of my bag at 0.618 level of current ABC and hold 50% until the 2024 accumulation high which is each 5:1 and 8.7:1 RR.
*Educational purposes only, this is not a trading advice. Be smart, make your own choices

BTC Technical analysis 4H time frame📊 BTCUSDT 4H Analysis
Trend Analysis
BTC is still in a medium-term downtrend because price remains under the 4H EMA ribbon, especially the heavy red EMAs (bearish control).
But short-term trend has flipped bullish, as BTC is reclaiming the lower EMAs and pushing into the resistance cluster at $92,000 – $94,000.
Key Support & Resistance Levels
Resistance
4H R1: $92,200
4H R2: $93,000
4H R3 / Major Resistance Zone: $93,500 – $94,000 ← very strong supply
Support:
Major Support: $89,800 – $90,300
Critical Support: $86,000 – $87,000
Local ascending trendline support also aligns with the critical zone — strong confluence.
Candlestick Interpretation
Current candlestick structure shows a series of strong green-bodied candles approaching resistance. No reversal pattern yet.
BTC is attempting a controlled bullish continuation sequence, but confirmation requires a close above $92,300 to validate a trend reversal attempt.
Indicators & Oscillators
MACD crossed bullish
Histogram is increasing
Momentum is rising but still below the zero line → trend reversal not confirmed yet
EMA Ribbon- BTC is fighting the mid-band. A breakout above $93k would flip the ribbon bullish on 4H
Indicators show early bullish strength, not yet full trend reversal.
Volume Analysis
Volume increased on the bounce from $89k, but buying volume approaching resistance is not strong enough yet. For a breakout above $94k, we need volume expansion + long candle body closure
Wave Analysis (Simplified Elliott Structure)
Current move looks like a Wave B upward correction unless $94k breaks. A break above $94k activates Wave 3, targeting $98.2k–$100k. Failure below $92.3k leads into Wave C downward to $88.5k then $86k
Intraday Trading (4H)
Long after confirmed 4H close above $92,300
SL: $91,200
TP1: $93,000
TP2: $93,500–$94,000
OR
Short rejection at $93,500–$94,000
SL: $94,450
TP: $92,200 then $91,500
Swing Trading (Multi-day)
Swing long only after daily close above $94k
SL: $91,800
TP1: $97,500
TP2: $100,000
Swing short if price loses $89,800
SL: $91,300
TP: $87,000 → $85,500
***NOT Fianacial advice, just a technical ananlysis***

BTCUSDT // We cannot see regular closings above the Kaufman indicator in the area I have indicated with a circle. For an increase, we must look for at least 3 closings above the Kaufman indicator.


Bitcoin Analysis – Market in a Fog of DoubtAlright traders, let’s jump into today’s analysis and see what the market is telling us 👇
As you can see, we’re still in that same area I told you about before —
we’re inside the secondary trend on the daily timeframe, meaning we’re simply correcting the larger downtrend we already had.
On the 4H timeframe, we still can’t call this an uptrend.
Why?
Because even though we are forming higher lows, buyers still don’t have enough strength to print higher highs — they keep creating equal highs instead.
So for now, the 4H trend is unclear ❗️
🎯 Key Levels That Define Everything
There are two major levels that will break this indecision:
93,500
89,100 – 89,800 zone
Whichever side breaks first — that’s where I’ll take a position with momentum.
Especially the 89,100 level, because that one matches my higher-timeframe bias.
📉 Risky Short Setup
I’ve also set a risky short trigger at 92,000.
This one needs another clean reaction before entering —
but if we get that reaction, it gives us a decent short setup.
⏳ Why Lower Timeframes Matter Right Now?
Because on higher timeframes we’ve just reached a support area,
and the market needs time to show a proper reaction.
That usually takes a while.
So right now:
✔️ Most confirmations come from lower timeframes
✔️ We secure profits quickly
✔️ We avoid holding long trades with no clear trend
That’s it for today’s analysis ❤️🔥
Make sure to listen to Powell’s speech tonight,
and never forget your risk management.
Stay profitable and stay sharp! 💰🔥

BTC: Awaiting Target HitI’ve been consistently advising to buy BTC below the 90K mark. Market rallies take time — keep a close eye on the 94K-96K resistance zone for now. The price will eventually surge past 100K. Sit tight for the breakout and stick to the long position strategy.
All signals have been 100% accurate for two consecutive weeks. I’ll keep delivering precise signals — act fast to get yours now.

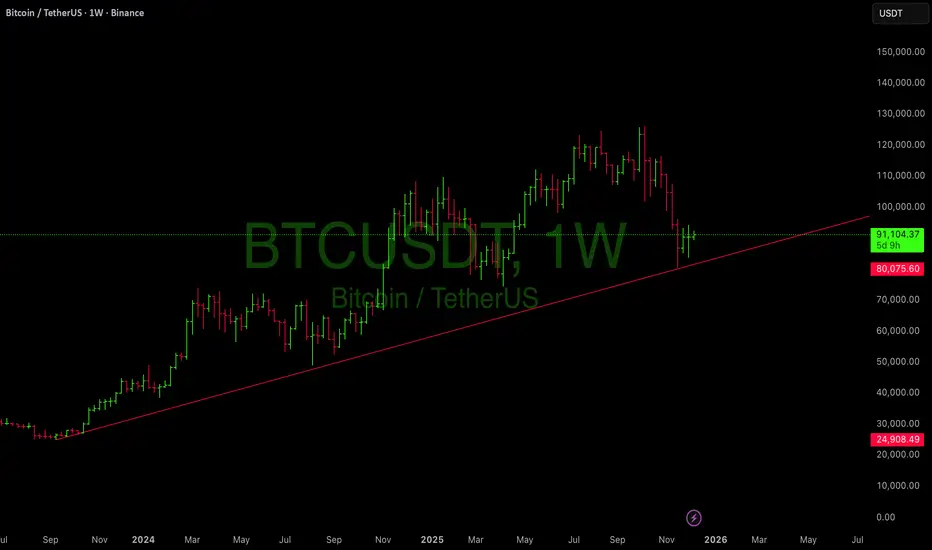
BTC – Trendline Retest Success | Momentum Reloading for Next LegBitcoin just completed a clean retest of its multi-year rising trendline, a structural level that has guided institutional accumulation since 2023. Price wicked below, tagged liquidity, and closed back above a classic bullish deviation → reclaim.
This type of structure historically marks the end of corrective phases and the beginning of new expansions.
📌 Key Bullish Factors
1. Long-Term Trendline Respect
Your chart shows a trendline starting from late 2023.
Price tapped it perfectly and is now holding above $80,000–$82,000, confirming:
Buyers stepped in where they were supposed to
Smart money defended the bullish structure
Heavy liquidation likely cleared weak longs
2. Weekly Candle Structure Turning
The last 2–3 weekly candles show:
Downward momentum slowing
Smaller bodies
Long wicks → buying from lower levels
A potential swing low forming at the trendline
Bitcoin is showing the early signs of seller exhaustion you typically see before a weekly reversal.
---
👉 The move tends to trap sellers before a strong leg up.
---
📈 Upside Targets (Weekly)
If BTC continues holding above trendline:
1. $98,000 – $102,000
→ First major liquidity pocket / inefficiency
2. $112,000 – $120,000
→ Prior breakdown zone + weekly imbalance
3. $135,000 – $150,000
→ Trend extension target / potential new ATH expansion
These are not promises they are structural destinations based on the weekly map.
---
## **🔻 Downside Invalidation**
The bullish thesis remains valid as long as Bitcoin doesn’t close a weekly candle below $80,000.
Break + close below would open deeper retracement into mid-70Ks.
But right now? The trendline holds strong.
---
🧠 Holistic Trader Insight
Institutional players accumulate on weakness, not strength.
When retail panics, smart money buys structure.
This entire move fits the textbook rules:
Trend intact
Liquidity swept
Structural level reclaimed
Momentum slowing into support
This is what early expansion phases look like.
#BTCUSDT.P 2H ChartPrice previously bounced off a discounted area of demand and left a freshly printed demand zone on its way up. In addition, it recently got rejected off a minor area of supply and it is consolidating showing no major movements. Price is expected to tap into our demand zone where we have placed our limits aiming to break the previous swing high at $94,185.
