Probable Scalp Short BTCShorting at this moment can be risky. But I will trying with a small amount to mid of the range.
Trade Idea:
Old high was purged + TBS of CRT candle in ltf. OB Confirmation.
I am targetting 2r.
Very High chances of SL, due to weekend and low volume.
#NFA #DYOR
Trade ideas

BTC: price enters the buyer zone (86,000–79,500)This analysis is based on the Initiative Analysis (IA) method.
Hello, traders and investors!
On the monthly timeframe, the last buyer candle with increased volume appeared a year ago — in November 2024. From that point, buyers attempted to resume the trend twice.
The first attempt — in January — formed the level 89,256.
The second attempt came after a manipulation of the 89,256 level between February and April 2025.
This led to the formation of a new buyer initiative with:
— upper boundary at 126,199,
— lower boundary at 74,508.
The current buyer target from this initiative is 109,608.
Now the price has returned to the volume accumulation zone created during that manipulation — the 86,000–79,500 range.
The blue band on the chart marks the minimal price range where 50% of the candle’s volume was accumulated.
The blue line marks the price of the maximum volume inside that candle.
The daily candle from 21.11 has entered the 86,000–79,500 range with the largest volume since April 2025.
(And April 2025 was exactly when the 89,256 level manipulation took place.)
This confirms buyer interest in this price zone.
This daily candle is part of the forming seller initiative.
The upper boundary of this seller initiative is 93,836, while the lower boundary is not yet defined, as the seller move has not been stopped by a buyer candle.
Any market scenario remains possible. With strong seller pressure, the price may fall below 74,508 (lower boundary of the monthly buyer initiative) or even below 66,835 (the low of the November 2024 buyer candle).
A consolidation phase is also possible — and even the most likely — but for that, we first need to see a buyer candle, followed by a return to 89,256 or higher.
We continue to monitor the situation.
Wishing you profitable trades!

btc idea for next 2 yearswould make sense to me if btc has topped for the cycle all the dates line up for the 4 year cycle an ideal setup would be a retest of the 96-98k level for head and shoulders type of set up for a short down the the 60k and below levels think they will want to hunt saylor, could go back to ath if macro conditions line up and there is indeed a supercycle but give it a lower probability

BTC Has Started Its Crash Right Now!!!!!Bitcoin has ran into a resistance that started to form since the December 2017 top. Expect a lot of bleeding.
I've been trading for 8 years. I'm just warning you all. I wouldn't look for another long Until I see an 85k BTC. GOOD LUCK!
$107k in 40 days - 23 November to 1 January ForecastLeveraging the MTOPS method, this forecast is built around the principle of time-price symmetry and natural vibration cycles. Starting from 23 November, we identify a key Gann time window of 40 days, extending to 1 January. In this period, price targets are projected using Gann angles—particularly the 1x1 and 2x1 angles—plotted from the most recent swing low. According to Gann’s Square of Nine calibration, $107,000 aligns with a significant harmonic square, suggesting both psychological and geometric resistance in the current cycle.

$BTC = THIS IS NOT BUY THE DIP YET!An updated analysis on Bitcoin price action.
Let chasers buy the dip first.
Feel free to comment and argue against. In fact, I want to hear your opinions.

Why This Time Is Not Different — BTC Could Still Drop >50%Bitcoin is moving into a phase where long-term cycles matter more than whatever the market narrative happens to be this week.
And if you look at those cycles, one thing becomes clear: BTC has never avoided a major drop after making a new ATH.
1. The timing keeps repeating — almost to the day
Every big drawdown in Bitcoin’s history has lasted almost exactly the same amount of time:
Cycle 1: 371 days
Cycle 2: 378 days
Cycle 3: 378 days again
That kind of symmetry doesn’t happen by accident.
It’s a pattern driven by liquidity, leverage, miner economics and investor behavior.
Right now, BINANCE:BTCUSDT is lining up with that same timing structure once more.
2. The size of corrections is falling… but still huge
Past drawdowns:
–83%
–77%
The market is more mature now — more liquidity, more derivatives depth, more institutional money — so the volatility is naturally lower.
But “lower volatility” in Bitcoin still means:
👉 –50% to –70% corrections
And a drop in that range would land BTC somewhere around $40k–$50k, which is consistent with the historical pattern.
3. Market maturity doesn’t erase Bitcoin’s cycles
Even with ETFs, institutional flows, and a stronger market structure, BTC still reacts to:
leverage resets
liquidity tightening
miner selling pressure
sentiment washouts
These things don’t disappear just because the market grows.
4. What the full cycle is pointing to
If the cycle keeps rhyming with the past:
Potential bottom: roughly late 2026, at the end of another ~370–380 day drawdown
Next peak: around 2028
Long-term target: $120k–$150k+
The rhythm remains the same:
big drop → long consolidation → explosive recovery.
Takeaway
This time isn’t different.
Even in a more “institutional” Bitcoin, the cycles still point to a >50% reset before the next major expansion.

I am right. Emotional traps in tradingVery often I catch myself thinking before opening a trade that I want to be right about the chosen direction. The first thought is not even about how much I can earn, but that it feels nice to be right, nice when the market confirms the chosen direction — that warm and pleasant feeling of a life-winner who takes control into their own hands. Sometimes I think that the overwhelming majority of traders came to the market not for money, but for this very feeling of being right, being competent and important. And opening a trade from this point is an emotional trap that eats up our deposits. Let’s figure out why and how to fix it.
Let’s start with what happens before opening a trade, when we come to the market to prove that we are right. You’ve surely seen such posts, and maybe even wrote them yourself, like “I told you so!”. This often happens with beginners in trading, because in the beginning, by the laws of the genre, the price often goes in the direction of the beginner, and it seems more and more to them that they’ve cracked the market, are always right and cannot be wrong. Before opening a trade in such a case there appears the emotion of happiness in anticipation of that cozy feeling of being right.
Usually the trader starts thinking and saying phrases like:
I know where the price will go
The price will be 1000 in a week
Save this post/tweet
I’ve always been right and now too, you’ll see
I’m telling you for sure the price will be 500 in 4 hours
This is the bottom/reversal point/top, from here we will go this way
If you recognize similar patterns and use them as a signal to open a trade, I have bad news for you. The moment will come when “I am right” inside one single trade will take away your whole deposit, and maybe not just one. You will never forget that dull pain somewhere in the chest after this. It usually pushes 95% of beginner traders out of the market, because after “I am right” doesn’t work, they usually say:
It’s all whales manipulating
It’s the exchange’s fault
It’s the president who is wrong
Technical analysis doesn’t work
Trading is a casino and you can’t make money here
It’s all a scam
“I am right” can even lead to very sad consequences. This is a psychological trap not of the market, but of our own perception of ourselves and what a trade is.
What a trade is NOT
A trade is not you
A trade is not a tool for proving anything to the market
A trade is not a toy for when you’re bored
A trade is not an enemy
A trade is not something that will never happen again
A trade is not a bet of your whole deposit on black
A trade is not a wife/husband — no need to cling to it
When we trade based on the signal “I am right”, we trade “I want validation”, “I want to prove that I’m smart”, “I want approval, recognition, and applause”, “I want to feel control”. Control is an important component. You cannot control the market in order to always be right, but you can control yourself, your risks and your trade management — not from the position “I want to be right”, but from the position “I want to see the result, any result”.
Why “being right” is dangerous
You start holding losing trades.
Because admitting a loss = admitting your mistake.
And the ego hates that.
You sit through drawdowns.
Not because it’s part of the strategy, but because you want to prove to the market, to yourself or to the world:
“I was right from the beginning.”
You don’t take profit.
Because you’re waiting for the perfect point to prove:
“Look, I caught the exact top/bottom!”
As a result, the pullback eats most of the profit.
You lose flexibility.
And flexibility is the only thing that gives a trader survival.
Why does the desire to be right appear?
The desire to regain control when a trade goes against us — at such a moment we see nothing but the chart, because a burning desire appears to pull the trade back to our entry. So we wait, increasing the loss, instead of admitting that we are NOT right and taking the loss.
The fear of making a mistake, admitting that no one knows the future and that it is normal to make mistakes — treating mistakes as a curse, not as part of the learning path, a normal and natural part.
When we were shamed for mistakes, and now shame doesn’t allow us to admit that I am NOT right, and that this is normal. This goes deeply back to childhood — you need to dig into your patterns and programs.
Perfectionism, which, like corrosion, always eats through everything. The world is NOT perfect, everyone makes mistakes, and nothing and no one can do something without first learning how to be NOT right.
The desire to be noticed. I’m right, I guessed the market direction, I got approval; I didn’t guess — I didn’t get it. Self-esteem is what you need to start with in trading — learning to praise yourself, finding the source of validation inside.
The illusion of others being right. This is a real scourge of our social-media age — the perfect picture of profit screenshots, but usually we don’t publish blown accounts. Why? Because being NOT right and admitting it — that is the level of a pro and a transition to a higher stage of your own psycho-emotional state.
What actually causes the desire to be right?
Short answer:
✔️ Fear of being wrong
✔️ Fear of shame
✔️ Fear of losing control
✔️ Fear of being “not enough”
✔️ Dependence on external validation
✔️ Childhood traumas of “idealness” and “rightness”
✔️ Broken inner support: “I must not make mistakes”
✔️ Undifferentiated ego: mistake = I am bad
So how do you get rid of the desire to be right?
I think you can’t get rid of it, but you can notice it and transform it.
Practice #1: Mark the “ego moment”
As soon as thoughts appear:
“I know, it will reverse”
“It just can’t keep going like this…”
“I’ll get back to breakeven and close”
“I just couldn’t be wrong”
Practice #2: Micro-stops on the emotional level
Not only technical stop-losses.
Set emotional stops:
accelerated heartbeat
the feeling “I must wait”
fear of closing
the desire to prove
Practice #3: A phrase that cuts off the ego
When the fight for “rightness” begins, tell yourself:
“My task is to protect capital, not my pride.”
Also write down reminders and put them somewhere visible:
“I’m okay even when I’m wrong.”
“I am not the trade.”
“I’m saving the deposit, not the trade.”
“I can change my mind and that’s normal; no one knows the future.”
“I don’t need to be right to make money.”
“I’m okay. A trade is just a trade, there will always be another one.”
Do you fight for your rightness? Or are you okay being wrong?

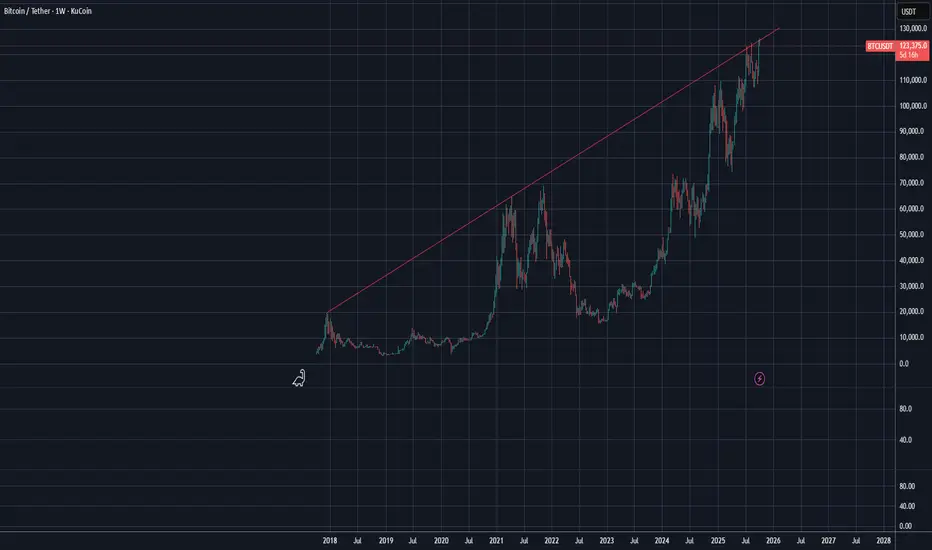
sUpeRCyCle BTC Is Replaying the 2021 Top — Same Structure, Same Narratives
Price action is almost identical to November 2021, and right on cue the old “supercycle” narrative has returned. This is my third cycle top, so I’m ignoring the noise and focusing only on levels and macro.
Key Levels
These three supports mirror the old 28k (2022) line in the sand.
Lose them → confirmed bear market.
Monthly (white): 78,430
Weekly (red): 76,322
Daily (yellow): 74,508
Expect volatility around these zones — BTC never moves straight down.
Short-Term View
I still expect a bounce toward the 100k region, but likely after we take one or more of these levels. This phase usually drags out over months, not days.
Macro Reality
People are getting bullish on QE, stimulus, and rate cuts, but that logic is backwards.
Governments don’t print money at all-time highs.
QE and stimulus only arrive when the real economy breaks — which means markets crash into the easing, not pump because of it.
Bottom Line
Price structure and macro look far closer to a cycle top than a supercycle.
Hold the key levels and we chop.
Lose them and the bear market is confirmed.
I’m trading the chart — not the narrative.

If the 83292 is not broken,the price will increase to the 91732Given the fluctuations of the last 24 hours, if the mentioned range is not broken, Bitcoin will rise to the 91,000 range.

The beginning of Bitcoin’s next drop could coincide with end QTveryone thinks the market pumps after QT policies end…
But look at early July — first the market dropped sharply. The same thing could get triggered in December and repeat the previous pattern.

Is the Bullrun Over? Time to Dive Down?Is the Bullrun Over? Time to Dive Down?
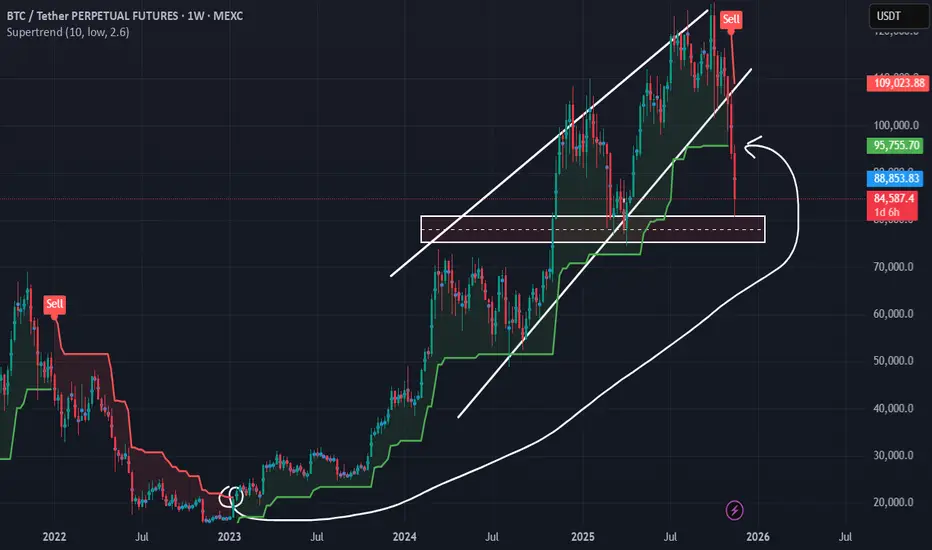
Weekly Supertrend Turns Bearish After ~1043 Days — What This Means for BTC
The crypto market is flashing serious warning signals, and one of the most important comes from the weekly Supertrend indicator. Using the parameters ATR Length = 10 and ATR Multiplier = 2.6 , the Supertrend has now flipped bearish again — and notably, this is happening after roughly 1043 days of staying on the bullish side.
On higher timeframes like the 'weekly chart', a Supertrend flip is not a short-term signal. It typically represents a **macro shift in market structure**, and such shifts don’t resolve quickly. When a weekly Supertrend turns bearish after such an extended bullish period, the market often enters a prolonged phase of consolidation or decline.
In other words:
This is not a dip — it’s a structural warning.
Price is likely to stay in weakness for a long time unless a major reversal invalidates the signal.
#The Critical Range: 75,100 – 80,750
I’ve drawn a key horizontal range between:
Lower bound: 75,100
Upper bound: 80,750
This is the zone BTC is likely to **test and re-test** while the weekly Supertrend stays bearish.
#Why this range matters:
* It served as a **liquidity pocket** and structural support.
* It aligns with price memory where strong bids previously entered.
* With weekly momentum now flipping negative, price will likely **grind into this zone** as buyers attempt to defend it.
Expect choppy, frustrating, sideways price action — ranging, wicking, and retesting — as the market decides whether the bull cycle can resume or not.
# If This Range Breaks… Things Could Turn Ugly
The real concern comes if BTC **breaks below 75,100** with conviction.
A breakdown from this range would mean:
* The weekly Supertrend remains firmly bearish.
* Market structure shifts from **distribution to full decline**.
* Long-term holders start derisking.
* Liquidity gaps below begin opening up.
### If 75,100 fails, BTC is not just correcting — it is entering a very, very extended downtrend
You could see:
* Multi-month decline
* Slow bleed into macro supports
* Possible cycle-top confirmation
This wouldn’t be a quick drop; it would be the start of a **long, grinding bearish phase** — similar to previous cycle tops where the market slowly unwound months of overextension.
# Conclusion
The weekly Supertrend (ATR 10, Multiplier 2.6) flipping bearish after ~1043 days is a **major macro signal**, not a noise event. BTC is likely to:
1. Stay weak for an extended period,
2. Range between 75,100 and 80,750,
3. Retest that zone multiple times, and
4. Potentially start a very long bearish phase if the range breaks to the downside.
This is the first genuine macro warning we’ve had in a long time — and the market is finally reacting to it.
Note: This analysis on BTC Market with Price Action and SuperTrend of mine is polished and made ready to publish by ChatGPT, but the key idea and analysis data was given manually
Asif Hassan Risan
23 November,2025
Long btcLong btc
E1:77
E2:73
Bitcoin Approaches Key Weekly Support
Higher Volume Loss Pushes Price Towards 77&73 Levels
Stay With Us

BTCUSDT.P - November 23, 2025Bitcoin remains in a pronounced daily downtrend with persistent lower highs and lower lows, reflecting strong bearish momentum. The price is now targeting major support zones near 78,250 and 60,300. There is currently no indication of reversal; a sustained move above support would be necessary to suggest any bullish recovery. Until then, momentum and trend bias remain decisively bearish.

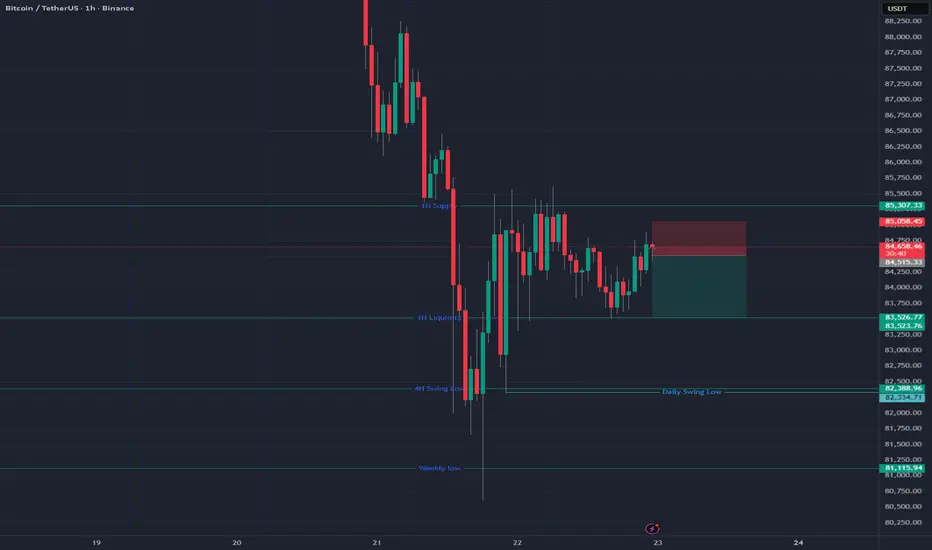
Staying with the higher-timeframe flow until proven otherwise.I’m short BTC from 84,515.33 following a clean reaction from a short-term supply zone that aligns with the broader higher-timeframe downtrend.
We had a buy-side sweep, price traded into premium, and the rejection was immediate — enough for me to take the setup.
Risk is defined above 85,058.45.
First target sits at 83,526.77, in line with the next liquidity draw.
Will continue managing this based on structure.
BTC spot plans Bitcoin – Higher Timeframe Structure Update
Back in August, I highlighted that BTC’s move to the upside wasn’t impulsive but corrective. That played out exactly as expected: Bitcoin completed Wave B (yellow) near 126K and then sold off sharply into Wave C.
Zooming out, BTC is still in a larger Wave 4. Historically, Wave 4s tend to form triangle structures (A-B-C-D-E) rather than simple ABC corrections. These patterns are usually long, sideways, and extremely frustrating for traders.
At this stage, I’m tracking two possible scenarios, but based on current price action, there’s roughly an 80% probability that BTC is developing a Wave 4 triangle.
Key takeaway:
The market is still corrective on the macro level, and patience is required while the triangle completes.

BTCUSDT - Daily
We can clearly see that Bitcoin’s bullish impulses have been losing strength over time. Each upward wave is forming with a smaller angle, showing a gradual reduction in momentum.
Such behavior often signals that the market is entering a mid-term or even long-term correction/consolidation phase, where price needs time to rest and regain energy before any potential continuation of the larger trend.
Bitcoin is testing the lower boundary of its ascending channel. If this support doesn’t hold, the probability of an extended sideways or corrective structure becomes higher.

BTC Price DropBTC Price Drop, what's your support area and what would be the next market move?
What are your thoughts?

btc idea We had a great run since Nov 2022 when wave 2 bottomed. Wave 3 delivered a massive rally, peaking near 109k.
Since then, I’ve been tracking wave 4:
Wave A bottomed ~75k
Wave B rallied us to the 124k rejection right at the 0.618 fib
This rally wasn’t impulsive but corrective (classic Wave B overshoot).
⚠️ If BTC loses 110k on 1D, the probability for a sharp Wave C massively increases → target 66-68k.
From there, Wave 5 could unfold with a brand new rally. 🚀

BTCUSDT Market Analysis UpdateHi everyone, I hope you are doing well and I have put my opinion in Bitcoin price on the chart for you. and hope this helps you! Simple, concise, useful
BTC is still trading within a clear bullish market structure, supported by strong HL formations and trendline confluence. At the moment, my main focus is on the Fair Value Gap (FVG) below current price. I expect BTC to revisit this imbalance before continuing the move upward.
The liquidity pool around 82,490 is also important. Personally, I don’t expect price to sweep that level immediately. However, if it does get taken, in my view it would likely serve as the final liquidity grab before resuming the broader uptrend. This makes 82,490 a key level to watch — either it remains untouched while we push higher, or if price sweeps it, the move could act as fuel for the next bullish leg.
From a higher timeframe perspective, the market remains bullish. The structure is intact, RSI is holding mid-range without major bearish divergence, and trendline support has not been broken. Volume also supports this idea — it’s decreasing and showing divergence, but this doesn’t signal a reversal, only a healthy consolidation while holding the bullish trend.
In summary:
Main target: fill the nearby FVG before continuation.
Key liquidity zone: 82,490 (less likely to be taken now, but if it happens, I consider it the last liquidity grab).
Bias: still bullish, expecting higher levels once short-term imbalances are resolved.
Weekly:
As long as BTC holds its HLs and respect the FVG zone, I continue to look for upside continuation — potentially well beyond current levels.
That’s my current view on BTC. Let me know your opinion below 👇
Best regards


Last chance for Bitcoin to go upHi traders,
Last week Bitcoin dropped and broke through the Weekly FVG. But it rejected from the small bullish Daily FVG.
So this is the last chance to go up again for (red) wave 5 (or a big correction up).
Let's see what the market does and react.
Trade idea: Wait for an impulsive move up, a small correction down on a lower timeframe and a change in orderflow to bullish to trade longs.
Price is too low to trade shorts.
This shared post is only my point of view on what could be the next move in this pair based on my technical analysis.
But I react and trade on what I see in the chart, not what I've predicted or expect.
Don't be emotional, just trade your plan!
Eduwave

BTC Daily Analysisbased on our previous analysis bitcon made an announced ATHs and drop down from that point.
it is near our important support levels. we expect BTC ranges between its support and resistance levels.
in weekly timeframe we can't see any signs of downward movement.
if any of these levels breaks with ichimoku confirmation, i will update the analysis.
