The Bell Curve: Understanding Normal Distribution in TradingMost traders have seen the “bell curve” at some point, but very few actually use it when they think about risk and returns.
If you really understand the normal distribution, you’re already thinking more like a risk manager than a gambler.
1. What is the normal distribution?
The normal distribution is a probability distribution that describes how values tend to cluster around an average.
If you plotted a huge number of outcomes (for example, daily returns or P&L per trade), the shape you’d get would often look like a symmetric bell :
- Most observations are close to the center.
- As you move away from the center in either direction, outcomes become less frequent.
- Extreme gains and losses are possible, but they’re relatively rare.
Mathematically, a normal distribution is usually written as N(μ, σ):
μ (mu) is the mean – the average outcome.
σ (sigma) is the standard deviation – a measure of how widely the outcomes are spread around that mean.
In trading terms:
If your returns roughly follow a normal distribution, you should expect many small wins and losses clustered near zero, and only occasional large moves in either direction.
2. Mean (μ): the “drift” of your system
The mean is the point at the center of the distribution. On a chart of returns, this is where the bell is highest.
If μ > 0, the bell is shifted slightly to the right → your system is profitable on average.
If μ < 0, it’s shifted to the left → your system slowly loses money over time.
For a trading strategy, μ is basically your edge. It doesn’t need to be huge. Even a small positive mean return, if it’s consistent and combined with disciplined risk management, can compound strongly over the long run.
3. Standard deviation (σ): volatility in one number
The standard deviation controls how wide or narrow the bell curve is.
- A small σ gives a tall, narrow bell → outcomes are tightly clustered around the mean.
- A large σ gives a short, wide bell → outcomes are more spread out, with bigger swings away from the mean.
Think of σ as a statistical way to describe volatility:
- For an asset: how much its price typically moves relative to its average change.
- For your strategy: how much your returns or daily P&L fluctuate.
Two systems can have the same mean return but very different σ:
- System A: μ = 0.2%, σ = 0.5% → relatively smooth ride.
- System B: μ = 0.2%, σ = 2% → same edge, but a wild equity curve and deeper drawdowns.
Same average, totally different emotional and risk profile.
4. The 68–95–99.7 rule
One of the most useful features of the normal distribution is how predictable it is. Roughly:
- About 68.2% of observations lie within ±1σ of the mean.
- About 95.4% lie within ±2σ.
- About 99.7% lie within ±3σ.
So if daily returns of an asset were approximately normal with:
- Mean μ = 0.1%
- Standard deviation σ = 1%
Then under that model you’d expect:
- Roughly 68% of days between –0.9% and +1.1%
- Roughly 95% of days between –1.9% and +2.1%
- Only about 0.3% of days beyond ±3%
Anything far outside that ±3σ range is, in theory, a very rare event. In practice, that’s often the kind of day everyone remembers.
5. Why this matters for traders
Even with all its limitations, the normal distribution is a powerful framework for thinking about risk:
Position sizing
If you know (or estimate) the standard deviation of your returns, you can form an idea of what “normal” daily or weekly swings look like, and size positions so those swings are survivable.
Stop-loss logic
Stops that sit right in the middle of the usual noise (within about ±1σ) will get hit constantly.
Stops closer to the ±2σ–3σ region are more aligned with “something unusual is happening, I want to be out.”
Expectation management
Most days and most trades will fall inside the “boring” part of the bell curve.
Understanding that prevents you from overtrading while you wait for the edges of the distribution – the bigger opportunities.
6. The catch: markets are not perfectly normal
Real markets often break the textbook assumptions:
- Returns tend to have fat tails → extreme moves happen more often than a normal distribution would predict.
- Distributions are often skewed → one side (usually the downside) has more frequent or more severe extreme events.
That means:
- A move that looks like a “5σ event” under a normal model might actually be something that happens every few years.
- Risk models based strictly on normal assumptions usually underestimate crash risk.
- Strategies like option selling can look very safe when you only think in terms of a normal distribution, but they are very sensitive to those fat tails.
So the normal distribution should be treated as a baseline model, not as reality itself.
7. Quick recap
The normal distribution is the classic bell curve that describes how values cluster around an average.
It’s parameterized by μ (mean) and σ (standard deviation).
Roughly 68% / 95% / 99.7% of observations lie within 1σ / 2σ / 3σ of the mean in a perfectly normal world.
Markets only approximate this; they usually show fat tails and skew, so extreme events are more common than the simple model suggests.
Even with those limitations, it’s a very useful tool for thinking about returns, drawdowns, and the range of outcomes you should be prepared for.
Trade ideas
BTCUSDT Long: Buyers Defend 91K Zone – Targeting 96K ExpansionHello, traders! The current BTCUSDT price action is developing within a strongly structured bullish environment after a prolonged decline driven by the Descending Channel. Earlier, the market broke down from the upper supply region and continued to move lower while respecting the descending channel boundaries. After reaching a pivot low near the demand zone around 91,000, buyers stepped in, initiating a reversal and shifting momentum to the upside. Following this, Bitcoin formed a clean Ascending Channel that confirmed growing bullish pressure. Price then entered a Range phase, indicating temporary equilibrium before the next impulsive move. After completing this consolidation, BTCUSDT created a clear Head and Shoulders reversal structure near demand, signaling a strong bullish reversal. Buyers took control and pushed price sharply upward, breaking through the range and reclaiming higher structure levels.
Currently, BTCUSDT is trading inside a new Ascending Channel, steadily climbing toward the 96,000 supply level, where sellers previously reacted. As long as price remains above the 91,000 demand zone and continues to respect the ascending channel structure, the bullish scenario remains valid. The next upside target is the 96,000 resistance area, aligned with the upper channel boundary.
My scenario is a continuation toward 96,000 as long as buyers maintain control of the channel. However, a strong rejection from this supply zone may trigger a corrective pullback back toward demand before buyers attempt another move upward. Manage your risk!

BITCOIN — THE MARKET IS APPROACHING ITS REAL DECISION POINTTraders,
We dumped. Now Bitcoin is grinding through a controlled recovery. The important question is not simply if we move higher. The real question is where the market will reveal its true intention. The chart is giving us a very clean map and the next major decision point is already forming.
1. The structure so far
Bitcoin sold off aggressively, found real buyers, and reclaimed the breakdown wick. That reclaim shows that the low was bought by spot demand rather than mechanical short covering.
Price is now pushing into a zone where the next expansion will be decided. The recovery itself is not the interesting part. The levels above and below are.
2. The major checkpoint above: 104k to 105k
This zone is extremely important. Two strong pieces of confluence meet here:
The 0.886 of the A to B retracement
The 1.618 extension of the impulse move you marked with the arrows
This creates a clean Potential Reversal Zone.
What this means:
If the market rejects 104k to 105k structurally, the next major destination becomes the lower imbalance cluster around 64k. That would be a true higher timeframe unwind because the entire path down is filled with thin volume and inefficient price action.
If Bitcoin breaks above 105k with flow support, then the next magnets open up immediately.
3. Targets above
If price accepts above the 104k to 105k PRZ:
First target area
Around 116k to 118k where we have a liquidity pocket and HTF inefficiencies.
Second target area
123k to 125k where a swing failure pattern is very likely. This is a weak high with resting liquidity and a natural magnet for price during bullish expansions.
At target two I expect the first serious reaction because of the liquidity sitting above the weak high.
4. Order flow confirms accumulation not distribution
Looking at the CVD grids:
Spot CVD is trending lower while price holds steady. This is a sign of absorption because someone is taking the other side of the selling.
Stablecoin margined CVD continues lower but without price following.
Coin margined CVD is sweeping lows with no breakdown in price.
This creates a hidden bullish divergence across the board.
Open interest also supports this view:
Stablecoin margined OI remains high which means traders did not exit during the dump.
Coin margined OI is slowly building which often appears before directional expansion.
This is not the profile of a market preparing for distribution. It is the profile of a market preparing for a move.
5. CME chart: AVWAP support from the last major swing
On CME, the AVWAP anchored from the previous major swing low to swing high is still holding as support. CME often leads during inflection zones. As long as this AVWAP holds, the market is positioned in a continuation PRZ rather than a breakdown PRZ.
If CME loses this AVWAP, the cascade scenario strengthens. As long as it holds, the bullish structure remains intact.
6. What happens if we break down instead
if Bitcoin fails to reclaim structure and breaks back down, the following levels become active:
83k to 84k
This is the shallow retrace zone and the first structural catch.
81k to 82k
This area contains the 1.113 extension and a previously unfilled FVG.
79k to 80k
This is the 1.272 level and a strong imbalance pocket.
72k to 73k
This contains the 1.414 extension and the next clean liquidity cluster.
64k
This is the 1.618 extension and the final major downside target. It aligns with the strong HTF imbalance that has never been fully tested.
A rejection from 104k to 105k can eventually lead price through these levels in sequence because the entire zone from 90k down to 70k contains thin volume. There is not much structural support built on the way up.
7. Real time confirmation tools
Watch these signals when we approach the 104k to 105k decision zone:
Spot CVD rising means continuation likelihood increases
Funding staying negative means shorts are still stuck
OI rising with price means momentum is building
CVD stalling or rolling over at 104k to 105k means rejection risk is high
CME AVWAP reclaim or failure will guide direction
If buyers hold flow above 105k, the path to 117k and then 124k is clean.
If buyers fail and we reject 105k with aggressive selling, the path down becomes active.
Final view
Bitcoin is approaching one of the most important technical levels on the chart.
We dumped on real flow.
We recovered on spot demand.
Now the market is converging toward the 104k to 105k PRZ where a true decision will be made.
Break above and the next magnets are 117k and 124k with a likely swing failure at the second target.
Reject and the lower zones activate with 64k as the eventual HTF destination.
This is the map. The levels are clear.
TLDR
BTC is recovering with spot support
104k to 105k is the major PRZ
Break above: targets at 116k to 118k and 123k to 125k
Reject here: downside levels at 83k, 82k, 80k, 73k and 64k
Order flow is showing hidden bullish divergence
CME AVWAP is holding which keeps the bullish narrative alive
The market leaves its footprints long before it shows its direction. Read the sands, follow the flow and stay prepared.
- ThetaNomad
----------------------------------------------
If you enjoy this style of analysis feel free to leave a like or comment. It lets me know you find value in these deeper structural and flow based breakdowns.
----------------------------------------------

Myt//@version=5
indicator("Free Edge-Algo Style", overlay=true)
// ===== الإعدادات =====
emaFastLen = input.int(50, "EMA Fast")
emaSlowLen = input.int(200, "EMA Slow")
rsiLen = input.int(14, "RSI Length")
rsiBuy = input.int(55, "RSI Buy Level")
rsiSell = input.int(45, "RSI Sell Level")
atrLen = input.int(10, "ATR Length")
factor = input.float(3.0, "SuperTrend Factor")
// ===== المؤشرات =====
emaFast = ta.ema(close, emaFastLen)
emaSlow = ta.ema(close, emaSlowLen)
rsiVal = ta.rsi(close, rsiLen)
// SuperTrend
= ta.supertrend(factor, atrLen)
// ===== شروط التداول =====
buySignal = dir == 1 and close > emaFast and emaFast > emaSlow and rsiVal > rsiBuy
sellSignal = dir == -1 and close < emaFast and emaFast < emaSlow and rsiVal < rsiSell
// ===== الرسم =====
plot(emaFast, color=color.orange, title="EMA Fast")
plot(emaSlow, color=color.blue, title="EMA Slow")
plot(st, color=dir == 1 ? color.green : color.red, linewidth=2, title="SuperTrend")
plotshape(buySignal, title="BUY", location=location.belowbar,
style=shape.labelup, text="BUY", color=color.green, textcolor=color.white)
plotshape(sellSignal, title="SELL", location=location.abovebar,
style=shape.labeldown, text="SELL", color=color.red, textcolor=color.white)
// ===== تنبيهات =====
alertcondition(buySignal, title="Buy Alert", message="Free Edge-Algo BUY Signal")
alertcondition(sellSignal, title="Sell Alert", message="Free Edge-Algo SELL Signal")

$BTC Will Reach 99K NEXT week ??
Please reffer the analysis , read the description carefully, and comment with your valuable thoughts 🔥
📌First of all, it should be said that CRYPTOCAP:BTC has not fully recovered yet. BTC is still in a bearish trend in the higher time frame ✅
📌The reason is that for BTC to enter a strong bullish movement, it must drop to a strong support zone ✅
📌My opinion on this analysis is that BTC has dropped to the red trendline, and then I expect a short-term price increase from there ✅
📌Then, if it is "rejected" by the Strong BEAR-OB in the 97k - 99k range, CRYPTOCAP:BTC will drop again 🚀
#BTC#BTC
#Bitcoin
#BTCUSD
#BTCUSDT
#Crypto
#Cryptocurrency
#TechnicalAnalysis
#PriceAction
#MarketStructure
#SupportAndResistance
#TrendAnalysis
#ChartPatterns
#NewYorkSession
#LondonSession
#WallStreet
#NYSE
#DayTrading
#Scalping
#SwingTrading
#Intraday
#RiskManagement

Consistency: The Real Market Hack!Every trader wants consistency.
But very few understand what consistency actually means.
Consistency is not:
❌ winning every trade
❌ predicting the market
❌ avoiding losses
❌ being perfect
Consistency is built long before you press the buy (or sell) button.
Here’s what consistent traders all have in common:
1️⃣ They Repeat the Same Process Every Day!
Consistency comes from repetition; not randomness.
The best traders don’t have a different plan for every chart.
They use the same routine, the same checklist, the same rules.
Clarity replaces guesswork.
2️⃣ They Trade Only When Their System Shows Up!
Consistency is not about taking more trades.
It’s about taking only the trades that match your edge.
No signal = no trade.
No confluence = no risk.
No clarity = no entry.
Most inconsistency comes from forcing trades that never belonged in the plan.
3️⃣ They Accept Losses Without Breaking Structure!
A consistent trader still loses, they just don’t fall apart when it happens.
❌They don’t double their risk.
❌ They don’t chase entries.
❌ They don’t change strategy mid-trade.
They take the loss the same way they take the win:
within the system.
4️⃣ They Focus on Long-Term Data, Not Single Trades!
You can’t judge a strategy by one day, one week, or even one month.
Consistency is measured across:
✔ dozens of trades
✔ multiple cycles
✔ all market conditions
Professionals think in probabilities.
Beginners think in outcomes.
The Real Secret?
Consistency is not an ability.
It’s a decision you make every day:
➡️ Follow your rules
➡️ Manage your risk
➡️ Trade your edge
➡️ Ignore the noise
When your habits become consistent, your results eventually follow.
⚠️ Disclaimer: This is not financial advice. Always do your own research and manage risk properly.
📚 Stick to your trading plan regarding entries, risk, and management.
Good luck! 🍀
All Strategies Are Good; If Managed Properly!
~Richard Nasr

5 Key Trading Tips for BeginnersWelcome back everyone to another post! In this article we will be explaining 5 key pointers (tips) for new individuals entering the trading space.
When it comes to trading first there is “ understanding ” before we begin the 5 keys steps. Let me assist you in understanding what will happen when you take on trading.
Trading is a challenge. Not a video game challenge, not a math test challenge – a * Challenge * One that will break you. Trading will break you mentally, physically, spiritually and financially. It is an eye-opening journey.
Trading will teach you a lot about yourself, and it will teach you a lot about discipline, patience and how you can analyze markets.
I saw a quote somewhere, it said trading: “ Trading is the hardest way, to make easy money ” and they are right.
You will be learning how to manage risk, control your emotions, understand your own decision-making patterns. These are all invaluable lessons for life, as well as trading.
Sounds great! But then there are the losses, what you lose to gain all this. Trading isn’t something that you can learn overnight – all those posts you see about a young 17-year-old “ cracking the code ” is rubbish. Why? Because they haven’t learnt life lessons.
You can make money fast, but you will lose it faster if you don’t know how to manage it.
Trading will drain every bit of energy out of you. You will feel like you’re falling behind, you will eventually collapse at every loss and become frustrated. The market will test you; the market doesn’t give a damn about you – you accept the risk when you take on trading and since you’re the one making the trades, it’s you VS you.
You’re testing yourself. You agree to test your patience, your confidence, your mindset. Doing so will make progress feel nonexistent or slow.
Every day, and every trade you will question yourself, wondering if “trading” is even for you. Sometimes it will feel like you’re going in circles. You will continue to make mistakes repeatedly. It will become exhausting but remember – only experience and your own strengths will allow you to succeed. Only those who can endure the grind without giving up will make it.
So, let’s start off the 5 key pointers that will prepare you.
1) Prioritize Risk Management Over Profits:
Most newbies focus first on “ making money ” rather than safeguarding capital. The reality is that surviving in the market is way more important than winning every trade you see or come across.
Key Points:
Determine risk per trade: A common rule is risking no more than 1-2% of your trading account on a single trade. This way even a string of losses will not wipe you out.
Always use stoploss: A defined maximum loss per trade enforces discipline and emotions to stay in check.
Position sizing: Your sizing should be proportional to what you’re willing to lose on each trade. Bigger trades amplify the losses, but they also amplify the profits.
Why it matters:
Without strong risk management, even a high win-rate strategy can fail. Protecting capital ensures you’re still in the game when opportunities arise.
2) Develop a trading plan and stick to it .
Random reactive trading is the best way to lose money. Build your plan overtime.
Key points:
Define your strategy: Building your strategy is the longest part, constant back testing and forward testing, refining and rebuilding. You’re not “switching” your strategy if you’re adding something small to it, you’re changing it if you eliminate the whole thing.
Identify your form of trades, short, mid, long term or swing trades.
Set clear rules: Don’t leave anything to chance, for example “I only enter trades if price closes above the 50ema and RSI is above 50”
Journalling trades: Ensure to journal all your trades, “How do I journal” Easy. Record the time, date, symbol, pair, what model/system you used, images, your entry, tp and exit, why and for how long you’ll have it open.
Why it matters:
Consistency is a key, it pairs with discipline, psychology and lingers with risk management. Traders who follow a disciplined system perform better than those to trade off an impulsive feeling. Other words “Gamble”
3) Master one market and one system first:
Beginners usually spread themselves too thin, trying forex, crypto, stocks and commodities all at once – Unfortunately for me I made this mistake at the start which made it very difficult! – Don’t do this. Stick to one market.
Key points:
Pick one market: Each market has its own rhythm, volatility, and liquidity. Teaching one thoroughly allows you to understand everything about it.
Focus on one system: Instead of trying every new system from you tubes or forums, master one approach and refine it onwards e.g. – you trade FVGs, Win rate is 50% once you add Fibonacci it might be e.g. 65%
Avoid information overload: Social media and trading forums are filled with conflicting advice, stick to your chosen approach and refine it. People say you need to have 12-hour trading days. If you do this, you will FAIL. You will grind yourself into the ground and face burnout making it very difficult to get back up again. Limit yourself to how much trading and trading study you do a day. Eg 10 back test trades, 3 real trades, 3 journaled trades, 1 hour of studying and researching the market.
Without strong risk management, even a high win-rate strategy can fail. Protecting capital ensures you’re still in the game when opportunities arise.
Why it matters
Depth beats breadth early on. Mastering a single market and system will allow you to build confidence and improve your edge.
4) Understand the Psychology of trading.
Trading isn’t just numbers: as mentioned in “understanding” it’s a test of emotional control, fear, greed and impatience.
Key points:
Emotions vs logic: ensure you recognize emotional reactions like FOMO (Fear of missing out) or revenge trading. Pause before reacting to a trade that will go against you.
Set realistic expectations : Markets move slowly. Sometimes for months, don’t expect huge gains overnight. Just like DCA focus on compounding. Compound your knowledge and skill set.
Mindset training: Techniques like medication and journaling as well as visualization can help reduce stress and maintain discipline.
Why it matters:
Even a diamond system can still fail if emotions drive your actions. Psychology often determines long term success, more than technical skill.
5) Prioritize learning. Then earning.
Beginners fall into the trap of trading being a “get rich quick” scheme. But the real investment is learning how the market works.
Key points:
Paper and demo trade first: Practice on demo accounts before you use real money – you will be surprised how many times you will fail. It’s better to fail with simulation money than your McDonalds weekly wage.
Review every trade: Analyze your losing trades, but also your winning trades. Find patterns and areas to improve.
Continuously educate yourself: Read books about the mind, about habits, watch market analysis but critically, apply what you learn and don’t just collect information and not use it.
Why it matters:
Earnings are just the byproduct trading. The faster you learn and adapt, the sooner your profits will appear. Treat early losses as tuition. Not failure.
Thank you all so much for reading.
I hope this benefits all those who are starting off their trading journey. If you have any questions, let me know in the comments below!

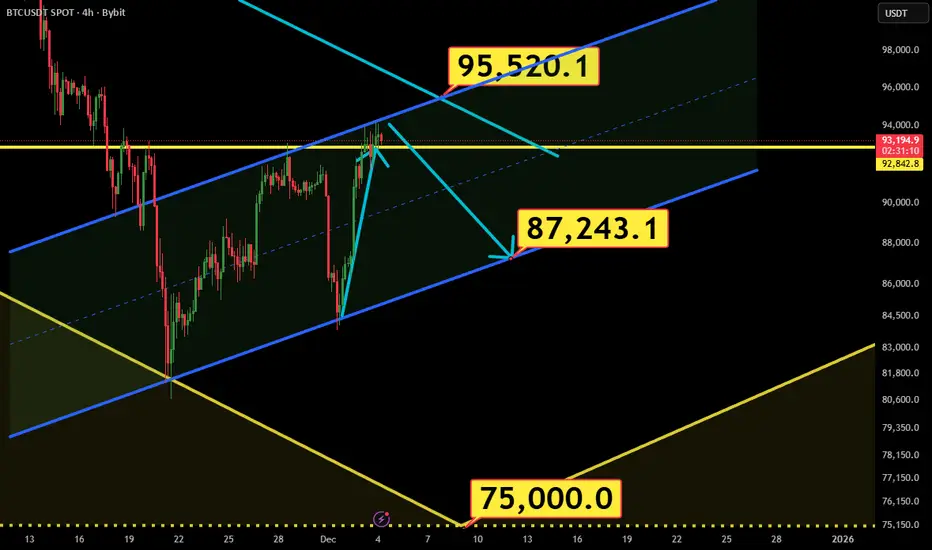
Not ready yet!If Bitcoin fails to secure a 12-hour close above 95,000, a corrective move toward 87,000 and even 75,000 remains on the table. However, one way or another, the market structure is ultimately poised to break upward toward 108,000.
TradeCityPro | Bitcoin Daily Analysis #242👋 Welcome to TradeCityPro!
Let’s move on to the Bitcoin analysis. Today is Saturday, and after yesterday’s drop, the market is ranging and resting.
⌛️ 1-Hour Timeframe
Yesterday, we saw clear signs of correction and bearish momentum in Bitcoin, and with a sell-off candle, the price dropped to the 89,082 level.
🔭 After reaching this zone, the correction has paused, and Bitcoin is now moving sideways near 89,082.
💥 On the RSI oscillator, we had a descending trendline that RSI respected very well.
✨ Now that this trendline has been broken, RSI is testing the 42.25 resistance level.
⚡️ If RSI breaks above this level, we will have the first signal of bullish momentum returning to Bitcoin.
🎲 If we get that confirmation from RSI, we can then look for a long trigger on the Bitcoin chart itself.
🧩 Once BTC breaks the short-term structure it forms by then, we can open a long position.
🎯 However, since today is Saturday, I personally prefer to wait and avoid opening any trades until the new week starts.
💡 Still, I’ll stay behind the chart, and if the bullish scenario plays out, I will open a long position.
📊 For a short position, we can enter on a break of 89,082, but honestly, many altcoins paired with BTC have much better short triggers right now.
❌ Disclaimer ❌
Trading futures is highly risky and dangerous. If you're not an expert, these triggers may not be suitable for you. You should first learn risk and capital management. You can also use the educational content from this channel.
Finally, these triggers reflect my personal opinions on price action, and the market may move completely against this analysis. So, do your own research before opening any position.

Bitcoin (BTC): Seeing Bullish Signs | Need To Re-Claim 100 EMAThe 100 EMA has been tested multiple times on BTC, yet buyers did not manage to fully secure this area. What we see is a continuation of attempts to break this zone completely and secure it, and as buyers are showing volume, we are looking for it to happen.
Setup looks decent; the zone of liquidity is our stop zone, where the major target is the 200 EMA as of now!
Swallow Academy

$BTC/USDT ANALYSISOn the 2-hour chart, BINANCE:BTCUSD is still trading inside a wide consolidation range, but the overall structure shows a slow upward trend supported by the rising diagonal trendline below the price. Every time BTC has dipped toward that ascending line, buyers have stepped in and pushed it back up, which means the market is still respecting bullish pressure from the bottom. On the upside, the main problem remains the heavy supply zone around 93,500 to 94,500, where price has repeatedly rejected and failed to break through. Each attempt into that zone has triggered selling and pulled the market back down, showing that sellers are still defending this level strongly. At the moment, price is sitting near the mid-range, recovering after a sharp drop, but it has not shown any clean breakout or breakdown yet. As long as the ascending support trendline holds, the market stays in a slow bullish structure, but unless BTC breaks above the 94,500 zone with strength, the chart will continue to move sideways between support and resistance.

BTC Weekly Analysis – Major Bearish Setup Forming?#BTC has broken below the key trendline and continues to hold in a bearish structure. On the weekly timeframe, the price action is showing a potential Head & Shoulders formation, and what makes this pattern even more significant is the strong bearish divergence appearing on the head of the structure.
This combination of trendline break + bearish market structure + divergence strengthens the probability of a larger downside move.
However, patience is key.
Before taking any short position, I will wait for:
Completion of the right shoulder
A clear break below the neckline
A clean retest of the neckline to confirm bearish continuation
Only then will I look for a short entry with strict risk management and clear invalidation levels.
If this setup plays out, #BTC could deliver a high-probability move on the weekly chart. Watching this closely.
If you find this analysis helpful, hit LIKE and drop your thoughts in the comments. Follow for more advanced #BTC setups, market structure breakdowns, and confluence-based trading ideas!
#BTC #Bitcoin #Crypto #TradingView #CryptoAnalysis #HeadAndShoulders #BearishDivergence #PriceAction #TrendlineBreak #WeeklyTimeframe #CryptoTrader #RiskManagement #BTCAnalysis #CryptoSetup

$BTC/USDT ANALYSISBitcoin on the 8-hour chart is consolidating within an ascending triangle formation, showing clear higher-low structure support near the rising trendline. The price is currently trading below both the 50-period moving average and the Ichimoku Cloud, which are acting as strong dynamic resistance levels. The highlighted red zone around 92,000–93,500 USDT represents a heavy supply area where previous rejections occurred.
As long as Bitcoin holds above the ascending trendline support near 86,000–86,500 USDT, the structure remains intact, suggesting buyers are still defending this zone. A clear breakout above the 50 MA and the 92,000 USDT resistance region would confirm a bullish continuation toward 95,000 USDT and beyond. However, failure to hold the rising support trendline could trigger a short-term correction toward 84,000 USDT before any recovery attempt.

BTC/USDT – Bullish Breakout Setup
Bitcoin currently trades near ~$90,100–$92,500 (spot range observed across exchanges) with buyers defending the ~$89,000–$90,000 zone.
Bitget
Bullish Thesis: Price has held above a critical near-term support zone and is forming a higher-low structure. A clean reclaim and sustained trade above $94,000 opens the door for a powerful continuation toward major psychological and structural targets as institutional interest and strategic accumulation remain visible in the market.
Key Levels
🟩 Support (Bullish Base):
• $89,000–$90,000 — strong local support zone where buyers have stepped in repeatedly.
• $87,000 — secondary support (deep pullback support).
🚀 Targets (Bullish Continuation):
• TP1: $94,000 — near-term resistance breakout zone.
FXStreet
• TP2: $100,000 — major psychological level & medium-term target.
FXStreet
• TP3: $112,000 — extended breakout target if momentum accelerates.
The Block
❌ Invalidation Level:
• $86,500 — decisive invalidation below the lower support zone; bearish structure would break.
Trade Plan:
• Look for a pullback into support zone ($89k–$90k) with bullish rejection volume.
• Prefer entries on a bounce or consolidation above $92k.
• Add partial positions on breakout above $94k with increasing volume.
Summary:
BTC is showing signs of bullish resilience near key support and a breakout above $94k could expedite upside toward $100k+, with a conservative invalidation below $86.5k.

TradeCityPro | Bitcoin Daily Analysis #241👋 Welcome to TradeCity Pro!
Let’s move on to today’s Bitcoin analysis. The market is currently in a downward correction phase.
⏳ 1-Hour Timeframe
Yesterday, Bitcoin corrected down to 91,974, and as I mentioned, the bullish momentum the market had was gone.
🔔 Now the correction has become deeper, and the price has fallen to 90,421.
✔️ The last candle we saw shows strong seller dominance, and with the high selling volume, it could very well be the beginning of a new downward move.
💥 The RSI oscillator, after resetting yesterday, has now dropped all the way to the 30 level, with the possibility of breaking below it and entering the oversold zone.
💫 If that happens, given the strong selling pressure and powerful red candles, the probability of a drop toward lower levels will increase significantly.
🧩 One area the price hasn’t reacted to properly is 89,082.
🎲 This level used to be very important for Bitcoin, but recently the price hasn’t respected it much.
⭐ If the price again fails to react to this level on the next move down, we can conclude that this support has weakened.
⚖️ However, in my opinion, if buyers are going to step in, this level is not a bad candidate for a reaction.
🔭 If Bitcoin gets supported at 89,082 and moves upward, it will form a higher low compared to 85,220, which increases the probability of a bullish structure forming.
☘️ But if 89,082 breaks, the downward move toward 85,220 will begin, and that could even signal the start of the next major bearish wave on the daily timeframe.
❌ Disclaimer ❌
Trading futures is highly risky and dangerous. If you're not an expert, these triggers may not be suitable for you. You should first learn risk and capital management. You can also use the educational content from this channel.
Finally, these triggers reflect my personal opinions on price action, and the market may move completely against this analysis. So, do your own research before opening any position.

BTC at Crossroads: Consolidation Before the Next Leg Up?BTC at Crossroads: Consolidation Before the Next Leg Up?
After Bitcoin came out of the consolidation, the price is reluctant to rise further. The market remains uncertain about the future moves considering that the FED is expected to cut rates at the upcoming meeting.
Perhaps the US PPI data today will start the move considering that the market should speculate again regarding the FOMC meeting.
On the other hand, BTC is well positioned for an optimistic move. It may correct in this area before moving higher. This is a normal scenario.
It is also possible that the price will fall within the pattern even more considering that the markets are still volatile and unclear before we see the optimistic move resume again.
Main targets
98900
106300
114500
You may find more details in the chart!
Thank you and Good Luck!
❤️PS: Please support with a like or comment if you find this analysis useful for your trading day❤️

BTCUSDT.P - December 13, 2025Price has reversed sharply from the prior consolidation high and is now pressing into a previously tested support band around 89,200–89,500, where the new long entry is placed. The broader structure shows a volatile range, but as long as this support holds, a corrective rebound toward 91,500–92,000 and the upper profit zone near 92,100–92,700 remains likely. A clean breakdown below 89,200 with strong downside momentum would invalidate the long setup and shift focus to the next support area around 88,000.


BTC updates📌 Bitcoin Technical Analysis
🔻 Support Levels:
• 90,850 – First key support; holding above this level keeps short-term bullish structure intact.
• 88,650 – Major support; a breakdown could increase selling pressure.
• 85,907 – Strong support zone; losing this level would significantly weaken the bullish trend.
🔺 Short-Term Resistance:
• 93,539 – Immediate resistance; a breakout above this level may open the way for higher targets.

correct for 3 weeks straight! LETS GOTime after time, I am calling the market weeks ahead of time
This is what it looks like to master the art of Gann
Before this forecast, I called the market 5 weeks ahead of time with unmatched accuracy...
And here we are again, Gann methods being correct for 3 weeks straight! LETS GO!!

Surviving this market for 10 years taught me thisI’ve been trading this market for over 10 years.
In the beginning, all I cared about was how much I could make.
That’s what most people focus on.
What I learned the hard way is this:
If the account doesn’t survive, nothing else matters.
No funds means no next trade.
No next trade means no edge, no learning, no comeback.
There were long periods where I wasn’t making money.
But I was protecting my ability to stay in the game.
That mattered more than being right.
This chart isn’t about profits.
It’s about still being here.

If 89220 is not touched,a scenario of a rise to 108k is possibleThere are two supports at the 89220 point that should be used in lower declines. Touching this value indicates further declines and failure to reach this price again confirms the upward process.

$BTC/USDT ANALYSISBitcoin is moving inside a symmetrical triangle on the 8-hour chart and the price is sitting near the middle of the range, trading below the 50MA which is acting as a resistance zone on top. Bulls are defending the lower trendline while sellers are active near the upper trendline, creating a squeeze where volatility is slowly reducing. If price holds above support, it may continue to move sideways inside the triangle, but a strong candle above the 50MA and triangle top would show strength, while a drop toward the ascending support would show weakness. Right now market is neutral and waiting for a clear break from this pattern, so upcoming moves around these trendlines will decide the next direction.
