$BTC - Market UpdateIntraday’s been pretty messy this week, a lot of pump & dump moves,
Well technically, we’re still sitting at a premium, but it looks a bit saturated now, and and 90k support won't probably hold. I was hoping we’d sweep those marginal highs around 95–96k, but yearly open is acting as trouble zone, a retest of 86k makes more sense now.
We could see a technical bounce around 86k, either we reclaim and break 92k, or we roll over toward the 82k (base support) .
Happy weekend everyone!
Trade ideas

BTC: Start BuyingAfter a rally, BTC has entered another consolidation phase, presenting fresh buying opportunities. You can start buying now, with the target range at 94K–96K.
BTC Trading Strategy for Today:
BTCUSDT buy@89000-90000
TP:94000-96000
All signals have been 100% accurate for two consecutive weeks. I’ll keep delivering precise signals — act fast to get yours now.

It’s Not Your Strategy. It’s Your Mindset.Most people lose money in markets not because they don’t know how to trade,
but because their mindset can’t hold up.
--
Before we start investing, most of us walk into the market with a huge sense of excitement.
The dream that a small amount of money could turn into something life-changing.
A few early wins that make you think, “I can do this.”
And that quiet fantasy that maybe… this is the thing that finally flips your life around.
But reality is colder than most people expect.
At first, everyone looks for the “answer.”
They study charts, hunt for indicators, learn strategies—anything that feels like a shortcut to certainty.
Yet after some time, when you look at the account… the reason people collapse usually becomes one thing:
It’s not that the strategy failed.
It’s that the mindset broke first.
--
Now, the market looks simple on the surface: it goes up or it goes down.
And because of that, early on, it’s totally possible to have a streak where you “get the direction right” a few times just by luck.
When those experiences stack up, people start thinking:
“Trading is easy.”
“I just need this one indicator.”
Of course, there are phases where certain indicators work beautifully.
But the moment you believe the chart has a single “correct answer,” the real problem begins.
The reason a few lucky wins can feel like “proof” is tied to psychology.
Psychology calls this Reward Reinforcement .
In simple terms: when you get rewarded by coincidence, your brain stores it as “the right answer.”
For example, imagine you use an indicator and—by chance—you win three trades in a row.
Your brain immediately starts telling you:
“This indicator works. I’ve found the edge.”
But the market doesn’t hand out answer sheets.
Markets move in probabilities, and even the same setup can produce a different outcome each time.
Yet for beginners, a few early wins can make a probability game feel like a “skill” game.
And that illusion becomes the starting point for almost every mistake that follows.
--
Before you begin trading seriously, take a moment to look at the table above.
Do you see those loss rates for retail traders and day traders?
There are markets and products where, out of 100 people who trade, 80+ end up losing money.
I’m not showing this to scare you.
I’m showing it because it’s reality you need to know before you start.
※ The samples/periods/products differ, but the conclusion is the same:
short-term retail trading—especially with leverage—ends in losses for the majority.
--
Let me ask you one simple question.
When you take a loss, what’s the very first thought that shows up in your head?
“It's fine—I’ll just make it back quickly. Let me trade off my feel.”
“Why did I lose? Did I follow my rules? Let me review this calmly.”
Which one should you choose?
People who choose #2 tend to survive.
People who choose #1 slowly get pushed out of the market.
--
Now let’s say Bitcoin hits RSI oversold, and it looks like “it can’t go much lower.”
Yes—Bitcoin often shows a short bounce when RSI reaches oversold.
But what happened overall?
We went through a move that dropped roughly -35% from the high.
So can we honestly say: “RSI oversold = guaranteed rebound” is a good strategy?
Probably not.
Even after oversold readings, price still broke lower five different times .
And no matter how well you try to manage risk, there’s a high chance your mindset breaks first in that process.
--
Because beginners usually follow a pattern like this:
“Oversold = it should bounce” → first entry
A small bounce → “I was right” → confidence goes up
Breaks the low again → panic between stopping out or averaging down
Re-enter → breaks the low again
What remains isn’t just “loss.”
What remains is shaken judgment.
In markets, loss is dangerous—
but shaken judgment is even worse.
Once your judgment is shaken, the next trade stops being a probability game and becomes an emotion game.
--
Here’s the one conclusion you should take from this:
The problem isn’t RSI.
The problem is the beginner mindset that tries to find “the answer” with one indicator.
RSI is a tool—nothing more.
But most people use it like an answer key.
“Oversold means it must bounce.”
“It shouldn’t drop from here.”
“This time is different.”
The moment those thoughts enter your head, you stop trading analysis and start trading certainty .
And trading certainty is exactly what breaks your mindset the moment a stop loss hits.
--
Once your mindset cracks, the chart stops being a place to find truth—
and becomes a place to find excuses.
Beginners keep changing indicators for a simple reason:
not because the indicator is bad, but because they don’t want to face the loss.
Changing indicators creates the feeling of “I found the cause.”
And that feeling creates: “Next time will be fine.”
That feeling pushes you back into another entry.
But one thing never changes:
There are no rules.
So the same mistakes repeat.
1) Do you want to be right once?
2) Or do you want your account to stay alive?
Even if you’re right sometimes, you still need to survive long enough to catch the next opportunity.
Please don’t forget that.
--
What beginners must think about first
Even with a 60% win rate, a max losing streak of 5 trades can happen.
Even with a 70% win rate, a max losing streak of 4 trades can happen.
So what happens if every time you stop out, your account drops -20% or -30%?
The answer is simple:
A few consecutive stop-outs can make your account unable to survive.
For example, even a trader with a 70% win rate can still experience around a 4-loss streak over 100 trades.
If your stop loss is -20%, then 4 consecutive losses isn’t “just -80%.”
four times means: 0.8×0.8×0.8×0.8 ≈ 0.41
So you’re left with roughly 41% of your original capital.
That’s not a “dip.” That’s losing more than half.
If your stop loss is -30%, it’s even worse.
You’re left with roughly 24% of your original capital.
Here’s the scary point:
This doesn’t happen because your win rate is low.
It happens because losing streaks are natural in a probability game—even with a high win rate.
That’s why you shouldn’t bet big based on “this one is definitely right.”
You should assume losing streaks will happen and minimize the damage of a single stop-out.
A simple, realistic approach is to keep your risk per trade around 3% of your total capital.
If you risk -3% per loss, then even a 5-loss streak is around a -14% drawdown.
That may still shake you—but it usually doesn’t create enough pressure to blow up the account with revenge trades.
On the other hand, if you risk 10% per trade, then after 5 consecutive losses you’re left with only about 59% of your capital.
At that point, people don’t “analyze the chart.”
They start forcing the market to make sense because they’re desperate to recover.
In the end, most beginners fail for a simple reason:
Not because the signal was wrong,
but because they started with sizing that can’t survive consecutive losses.
--
So here are the three points beginners must lock in first:
A. Set stop-loss rules statistically—not emotionally
Stop losses shouldn’t be based on “I feel like it.”
They must be set so you can survive even when losing streaks hit.
B. Before you enter, think “invalidation,” not “certainty”
Not “This must bounce because the indicator says so,”
but “If this level breaks, my idea is wrong.”
C. Build a structure that can handle consecutive losses
Markets rarely move in a clean straight line.
They shake, trap, shake again… and then move.
So you must design for streaks , not a single loss.
--
One last piece of advice:
The goal of trading isn’t to make one huge win.
It’s to build a structure that doesn’t blow up.
I understand the desire for life-changing money.
But the numbers are already there: even with a high win rate, losing streaks are inevitable.
Again— even someone with a 70% win rate can very realistically see a 4-loss streak in 100 trades.
If your stop is -20% or -30% each time… recovery becomes extremely difficult.
--
Trading should be treated like a business.
If you’re a business owner, you don’t “go all-in” in a way that one mistake can kill the entire company.
A business owner thinks like this:
“Can we survive if revenue dips this month?”
“Can we handle fixed costs if customers drop?”
“Can we recover even in the worst case?”
Trading is the same.
What matters isn’t being right on one trade—
it’s building an account that stays alive even when you’re wrong multiple times in a row.
But beginners do the exact opposite:
When they win, they size up.
When they lose, they size up even more.
Why?
Because they want to make money fast.
And when they lose, they want to get it back fast.
Remember: from that moment, trading stops being analysis and becomes emotion.
And emotional traders are the market’s favorite opponent.
Set your goal as survival first—not profits.
Keep your risk small but consistent.
Enter based on invalidation, not certainty.
Build a system that doesn’t break under losing streaks.
Even if you only do those three things, you can avoid the trap that destroys most beginners: revenge trading.
The people who win long-term aren’t the ones who predict charts best—
they’re the ones who build a structure that doesn’t die.
Starting today, stop chasing “the answer,”
and start trading your rules.
That’s the moment the chart stops being a tool that shakes you—
and becomes a probability business you can actually run.
Thank you for reading.
--
If this post helped you even a little, feel free to leave a Boost (🚀) and a short comment (💬).
It helps me understand what’s genuinely useful, and it gives me strong motivation to keep posting better education and analysis.
And if you’d like, hit Follow so you don’t miss the next post.

BTC - Short Update - Same Story, Flash Crash Ahead Bitcoin is respecting the same patterns as my previous analysis on this topic.
Flash crash is incoming any time now.
Be mindful of 2 wave path I laid out here.
Happy trading
- DD

BTC market snapshot Long signals:
Convergences across a large number of altcoins on higher timeframes
Retests of lows and historical oversold conditions on altcoins
Price compression into falling wedges with declining volume
Sentiment: “We’re all going to die. Japan is selling and raising rates”
Social media flooded with screenshots of short scenarios and expectations of a continued downtrend
Statements like “crypto is a scam” are increasing
Historically low amount of Bitcoin on exchanges
Aggressive buying by large players in both ETH and BTC
Funds preparing and developing the adoption of Ethereum and other top altcoins into the financial system
NASDAQ is considering a transition to infrastructure that supports tokenized assets
Ethereum upgrades aimed at allowing larger capital inflows
It feels scary to buy right now
Uncertainty and lack of clarity in open interest
Due to low liquidity, anything can happen in the short term. However, as long as we remain above 80k, I treat this as a long formation with a long-term target

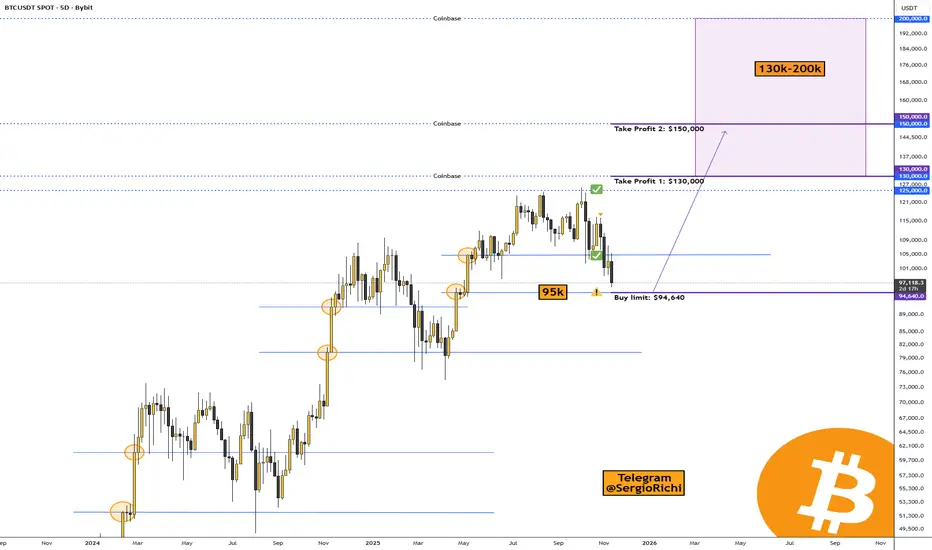
Bitcoin is approaching a key level at $94,640CRYPTOCAP:BTC #Bitcoin — Bitcoin is approaching a key level at $94,640.
The correction in the crypto market continues, and it's now starting in the US stock market.
Bitcoin is nearing an important level on the 5-day timeframe—specifically $94,640.
That's where market makers and big players have placed limit buy orders, and I think we'll see some major trader liquidations there too. For those who trade Bitcoin exclusively, I've marked a buy level.
• Buy limit: $94,640.
• Take Profit 1: $130,000
• Take Profit 2: $150,000
The range for wrapping up Bitcoin's cycle is pretty wide, since there are large orders set up there for taking profits. It's tough to pinpoint exactly where the price peak will be—we can only go by the data we can see.
• Coinbase: $130,000, $150,000, and possibly $200,000.
• Binance: $130,000, $150,000, and likewise, it's unlikely but possible to climb to $200,000.
Based on Elliott waves, we're finishing the 5th upward wave, and I figure the peak will hit in 2026, followed by a straight drop.
Indicator for Bitcoin miners:
The cycle indicator on Bitcoin shows the peak hasn't been reached yet:
Samuel Benner's Cycle and the 2026 Peak
The "200-year farmer chart," often referred to as Samuel Benner's Cycle Chart, is a historical economic forecasting tool created in 1875 by Ohio farmer and self-taught economist Samuel Benner.
It's credited with a "90% success rate" in broad sentiment prediction, and modern applications extend to stocks, crypto, and even solar cycles correlating with recessions.
It's best used as a sentiment gauge, not a precise timer.
Implications for 2026
The chart marks 2026 as a "B" year—a cycle peak in "Good Times," signaling high prices and a time to sell before transitioning to panic and hard times from 2026-2032.
This suggests a potential bull run peak, followed by downturn risks amid global debt, inflation, and geopolitics. As of late 2025, we're in a growth phase approaching this apex, per the model's extensions.
Dear friends, it looks like 2026 will mark the end of the growth cycle for Bitcoin and altcoins, so we'll need to find exit points, bail out of the crypto market, stock up on supplies for 3-5 years, and get busy building bunkers 😀🔥.
M formation BTCBitcoin is confirming M formation and will go to 36k-37k to pick up all liquidity...there is as well support from 200EMA

Quick Bitcoin Update (4H)The corrective phase of Bitcoin is an expanding triangle/diametric/symmetrical , with wave C completed and now we are inside wave D. This is a bullish D wave.
There is still time remaining for wave D to complete.
We have marked a green box below the price; if the price reaches this area, we can look for long/buy positions.
Look for long/buy positions in the red box, as there are many sell orders placed there.
For risk management, please don't forget stop loss and capital management
When we reach the first target, save some profit and then change the stop to entry
Comment if you have any questions
Thank You

BTC/USDT Setup Confirmed – Capital Flow Points to Upside!🚀 BITCOIN (BTC/USDT) Capital Flow Blueprint: Smart Pullback + Liquidity Grab Strategy
📊 Setup Overview
Asset: BTC/USDT | Strategy: Swing Trade | Bias: Bullish with Pullback Confirmation
🎯 Trading Plan Thesis
Bullish structure confirmed with Volume-Weighted Moving Average (VWMA) Pullback + Liquidity Zone Grab. Bitcoin continues to accumulate at demand zones while respecting higher timeframe resistance. This layered entry strategy captures value during temporary pullbacks before the next impulse.
Current Market Context: BTC trading near $109,768 (as of November 1, 2025)
📍 Entry Strategy: Multi-Tier Limit Orders (Layering Method)
Think of this as smart accumulation zones rather than one aggressive entry:
Layer 1: $106,000-107,000 (Deep pullback target)
Layer 2: $107,500-108,000 (Mid-level support)
Layer 3: $108,500-109,000 (Current support zone)
Ratio: Scale position size across layers (30%-40%-30% allocation suggested). This approach reduces timing risk and averages your entry price during volatility.
🛑 Stop Loss: Risk Management First
SL Level: $105,000
Rationale: Sits below the 4-hour swing low, providing buffer for wick rejection while maintaining favorable risk-reward ratio
⚠️ Risk Disclaimer: Stop loss placement is YOUR decision based on your account size and risk tolerance. Never risk more than 2% of your trading capital per trade.
📈 Take Profit: Multi-Exit Strategy
Target: $119,000
Confirmation: ATR (Average True Range) acting as resistance + Overbought RSI confluence + Previous resistance break
Exit Plan:
Partial 1 (50%): $115,000 (Take some profits early)
Partial 2 (30%): $117,000 (Lock in most gains)
Final (20%): $119,000 (Let runners chase the moon 🌙)
⚠️ Risk Disclaimer: Profit targets are based on technical analysis. Market conditions change. Take profits at levels that suit YOUR strategy and risk profile.
🔗 Correlated Pairs to Monitor (Market Ecosystem Check)
Direct Correlation Pairs:
ETH/USD ($3,865): Major altcoin bellwether. Watch 1-4 hour RSI divergence
BNB/USD (~615): Binance ecosystem health indicator
SOL/USD (~245): Alt season strength confirmation
Inverse Watch:
USDT Dominance: If BTC dominance drops >59%, profit-taking likely incoming
VIX Index: Higher volatility = more chop (avoid during spikes)
💡 Key Technical Points
✅ Volume Profile: Sellers exhausted at $105K-106K zone
✅ Order Flow: Institutional absorption at weekly support
✅ Micro Resistance: $112,000-113,500 (breakout confirmation needed)
✅ Macroeconomic: Fed sentiment + Bitcoin ETF flows = liquidity tailwind
⚡ Pro Tips for Better Execution
Timeframe: Confirm entry on 4-hour chart before scaling on 1-hour bounces
Volume Filter: Only take Layer 1/2 if volume > 20-day average
News Calendar: Avoid entries 2 hours before major economic data
Trail Stop: Move stop to breakeven once price hits Layer 3 + $1,000
🎁 Community Love
✨ "If you find value in my analysis, a 👍 and 🚀 boost is much appreciated — it helps me share more setups with the community!"
#Bitcoin #BTC #CryptoTrading #SwingTrade #TechnicalAnalysis #LiquidityGrab #VWMA #CryptoChart #TradingStrategy #CryptoSignals #LayeringStrategy #BTCUSD #CryptoAnalysis #TraderLife #AlgoTrading

BTC - Up After Some Manipulation?Alright traders, let’s talk about today’s NY session drama.
We already saw some liquidity taken early in NY,
so this setup might work…
or might completely ignore us.
Classic BTC. 😅
The idea is simple:
I’m watching for an entry on the second reaction,
which could nicely form a double bottom.
If that structure holds,
BTC could push up and test the previous day high.
From there?
Yeah… we can easily rotate back down into the range,
because why make things simple on a Friday. 😄
This is one of those:
“it could happen”
and also
“it could absolutely not happen”
type of trades.
And very important:
👉 If we take the previous day high BEFORE my entry is triggered,
this trade is cancelled. No chase, no FOMO.
Friday rules apply.
Manipulation rules apply.
BTC rules apply (unfortunately).
⸻
👉 Quick NY session trade
👉 Double bottom idea
👉 Friday volatility mode ON
Good luck traders — and may BTC choose logic over chaos today 😄📉📈


BTC recovers ahead of interest rate announcementBTC Daily Chart – Short Analysis
Bitcoin is still trading inside a bearish structure, staying below key moving averages and the descending trendline.
Main resistance: $100,000 – $102,000
This zone aligns with the 0.5 Fibonacci level and previous support turned resistance → high probability of rejection.
Current move: Price is bouncing, but no bullish confirmation as long as it stays under $102k.
Expected scenario:
BTC may retest the $100k–$102k zone, fail to break it, and continue downward.
Downside target: $83,700 – $84,000
This level matches liquidity and trendline confluence.
Conclusion:
Trend remains bearish unless BTC breaks and closes above $102k.

BTC/USDT: Bulls Defend 89K as Price Eyes 96K ResistanceBTCUSDT is holding firm above its ascending trendline after defending the 89,000 support zone, preserving the broader bullish structure. The recent dip swept short-term liquidity before buyers re-entered, signaling a corrective move rather than a full reversal.
As long as price stays above 89,000, BTC has room to climb toward the 96,000 resistance zone near the weekly high. Continued higher lows and trendline respect favor upside, with consolidation phases adding strength to the bullish case.
➡️ Primary scenario: higher lows hold → continuation toward 96,000 resistance area.
❗️ Risk scenario: a break below 89,000 would invalidate the bullish setup and shift focus toward deeper support zones.

BTC: $105K on the HorizonI’m assuming we’re seeing a reversal Head and Shoulders forming on BTC, with a potential retest of 106k. In that case, there’s a strong chance of seeing a new all-time high. I opened a few scout positions and still believe the bulls are in control. A retest of the local low (around the 80k zone) is possible, but I’m staying in long positions for now. The price action from here will be telling: if we can move up right away, the probability of a new high increases sharply.
Stepping away from the hourly charts — now we wait.

BITCOIN Bitcoin currently faces a major resistance at the 98,750 level, a zone that has repeatedly limited upward momentum. As long as the U.S. Dollar Index fails to decline and geopolitical risks remain elevated, Bitcoin is unlikely to show strong bullish continuation. Despite the lack of immediate strength, the market still provides attractive opportunities.
The 80,000 and 70,000 support regions are fundamentally valuable zones, especially if institutional buyers — such as BlackRock through ETF allocations — accumulate positions.

Relative analysis of Bitcoin vs. Gold and Total CryptoOn the BINANCE:BTCUSDT / TVC:GOLD ratio chart, price attempted to re-enter the primary channel after the initial breakout, aiming to push back toward the channel’s upper boundary. However, despite (105) days of upward attempts, the ratio consistently struggled with the dynamic resistance area.
After the breakdown, price extended toward the lower boundary of the extended channel, where it showed a strong and precise reaction.
From here, the structure suggests a potential bullish corrective move toward the resistance zone, supported by:
bullish divergence between price and MACD,
clear weekly rejection candles,
and price interaction at the channel’s lower boundary.
This scenario is further reinforced by the Crypto Market Cap (excluding Bitcoin) CRYPTOCAP:TOTAL2 vs. Gold TVC:GOLD ratio. This chart has also reached the bottom of its (180-week) channel, formed a weekly bullish divergence, and has now returned back inside the channel.
As shown on the chart, the TOTAL crypto channel exhibits cleaner and more consistent reactions compared to the Bitcoin channel.
If our key level is broken, the bullish scenario becomes invalid, and price is likely to move toward the support zones. This analysis will be updated accordingly.
BINANCE:BTCUSDT
TVC:GOLD
CRYPTOCAP:TOTAL2

TradeCityPro | Bitcoin Daily Analysis #242👋 Welcome to TradeCityPro!
Let’s move on to the Bitcoin analysis. Today is Saturday, and after yesterday’s drop, the market is ranging and resting.
⌛️ 1-Hour Timeframe
Yesterday, we saw clear signs of correction and bearish momentum in Bitcoin, and with a sell-off candle, the price dropped to the 89,082 level.
🔭 After reaching this zone, the correction has paused, and Bitcoin is now moving sideways near 89,082.
💥 On the RSI oscillator, we had a descending trendline that RSI respected very well.
✨ Now that this trendline has been broken, RSI is testing the 42.25 resistance level.
⚡️ If RSI breaks above this level, we will have the first signal of bullish momentum returning to Bitcoin.
🎲 If we get that confirmation from RSI, we can then look for a long trigger on the Bitcoin chart itself.
🧩 Once BTC breaks the short-term structure it forms by then, we can open a long position.
🎯 However, since today is Saturday, I personally prefer to wait and avoid opening any trades until the new week starts.
💡 Still, I’ll stay behind the chart, and if the bullish scenario plays out, I will open a long position.
📊 For a short position, we can enter on a break of 89,082, but honestly, many altcoins paired with BTC have much better short triggers right now.
❌ Disclaimer ❌
Trading futures is highly risky and dangerous. If you're not an expert, these triggers may not be suitable for you. You should first learn risk and capital management. You can also use the educational content from this channel.
Finally, these triggers reflect my personal opinions on price action, and the market may move completely against this analysis. So, do your own research before opening any position.

The One Pattern Every Trader Misses!Most traders focus on flags, wedges, double tops, fibs…
But there’s a pattern far more powerful, and almost no one talks about it:
-- The Behavior Pattern. --
📈It’s not drawn on your chart. You can’t code it into an indicator.
But it determines your success more than any formation.
Here’s the pattern professionals watch, and beginners ignore:
1️⃣ Impulsive Behavior
When price moves fast, traders move even faster.
FOMO kicks in. Chasing begins. Risk is forgotten.
Professional interpretation:
➡️ If emotions are impulsive, structure won’t be respected.
Avoid trading in emotional markets unless you already have a plan.
2️⃣ Hesitation Behavior
Price reaches your level. Your alert triggers.
Everything lines up… and you still don’t enter.
Why?
Because hesitation is a sign your risk is unclear.
Professional interpretation:
➡️ If hesitation appears, your plan isn’t ready.
The chart is never the problem, the plan is.
3️⃣ Revenge Behavior
One loss turns into five.
You stop trading the chart and start trading your frustration.
Professional interpretation:
➡️ If frustration is present, you’re trading without structure.
Step away. Market will be here tomorrow.
Why This Matters ⁉️
The market doesn’t punish bad trades. It punishes bad behavior.
Your biggest losing streaks didn’t come from your strategy.
They came from emotional patterns you didn’t recognize in real time.
Once you learn to see these behavior patterns, your charts become clearer, your decisions simpler, and your risk finally makes sense.
🧠Final Thought
Chart patterns tell you where the market might go.
Behavior patterns tell you whether you’ll survive long enough to get there.
Master both; and you’ll trade with the clarity most people never reach.
⚠️ Disclaimer: This is not financial advice. Always do your own research and manage risk properly.
📚 Stick to your trading plan regarding entries, risk, and management.
Good luck! 🍀
All Strategies Are Good; If Managed Properly!
~Richard Nasr
Funds Are Coming Back – Will BTC Surge?Hello traders, wishing you a great day! Let’s take a look at BTCUSDT together.
If we had to name one asset that is recovering after a storm and starting to attract capital again, Bitcoin is definitely the leading candidate right now. Expectations that the Fed will soon cut interest rates are bringing risk appetite back , the USD is cooling down, and part of the capital flow is returning to crypto – therefore BTC has a solid chance to recover after the sharp drop at the end of November.
On the 12H chart, BTC remains inside a downward channel , but is moving steadily above the short-term support around 85,700, which is marked as Immediate support . The current pullback is mainly a pause to regain momentum after the first rebound, without breaking the latest lows , and is showing signs of forming a higher low.
If price continues to hold above 85,700 and forms an accumulation pattern as projected, the resistance zone 93,900 near the upper boundary of the channel and the Ichimoku cloud will be the next natural target.
Given that macro news is gradually supporting risk assets and technical signals show weakening selling pressure, I personally prefer the scenario where BTC continues to recover toward 93–94k , rather than breaking support immediately.

BTC at the upper boundary: mixed signalsThis analysis is based on the Initiative Analysis (IA) method.
Hello traders and investors!
On the 4-hour timeframe, an absorption pattern has formed at the upper boundary of the range. At the same time, a buyer zone begins immediately below, where a buyer reaction may appear.
On the daily timeframe, the structure remains within the same sideways range. The touch of the upper boundary came on a volume spike, and key volume was accumulated in the upper part of the range — which is a positive sign.
However, this daily candle has two details that raise questions:
First: the highest volume was accumulated around 90,400, not at the top of the candle.
Second: despite the volume spike, it was still lower than the volume during the previous touch of the upper boundary, when the buyer showed initiative.
Therefore, if considering a short here, I would do so only after a break below 89,500 and confirmation that the seller is defending this level.
For now, the stance is neutral: observing how the structure develops on the 1-hour and 4-hour timeframes.
Wishing you profitable trades!


TradeCityPro | Bitcoin Daily Analysis #241👋 Welcome to TradeCity Pro!
Let’s move on to today’s Bitcoin analysis. The market is currently in a downward correction phase.
⏳ 1-Hour Timeframe
Yesterday, Bitcoin corrected down to 91,974, and as I mentioned, the bullish momentum the market had was gone.
🔔 Now the correction has become deeper, and the price has fallen to 90,421.
✔️ The last candle we saw shows strong seller dominance, and with the high selling volume, it could very well be the beginning of a new downward move.
💥 The RSI oscillator, after resetting yesterday, has now dropped all the way to the 30 level, with the possibility of breaking below it and entering the oversold zone.
💫 If that happens, given the strong selling pressure and powerful red candles, the probability of a drop toward lower levels will increase significantly.
🧩 One area the price hasn’t reacted to properly is 89,082.
🎲 This level used to be very important for Bitcoin, but recently the price hasn’t respected it much.
⭐ If the price again fails to react to this level on the next move down, we can conclude that this support has weakened.
⚖️ However, in my opinion, if buyers are going to step in, this level is not a bad candidate for a reaction.
🔭 If Bitcoin gets supported at 89,082 and moves upward, it will form a higher low compared to 85,220, which increases the probability of a bullish structure forming.
☘️ But if 89,082 breaks, the downward move toward 85,220 will begin, and that could even signal the start of the next major bearish wave on the daily timeframe.
❌ Disclaimer ❌
Trading futures is highly risky and dangerous. If you're not an expert, these triggers may not be suitable for you. You should first learn risk and capital management. You can also use the educational content from this channel.
Finally, these triggers reflect my personal opinions on price action, and the market may move completely against this analysis. So, do your own research before opening any position.

#BTC#Bitcoin Technical Analysis:
In my opinion, #Bitcoin will have an upward movement towards the indicated resistance areas (red).
Red areas: Static resistance
Red lines: Dynamic resistance
