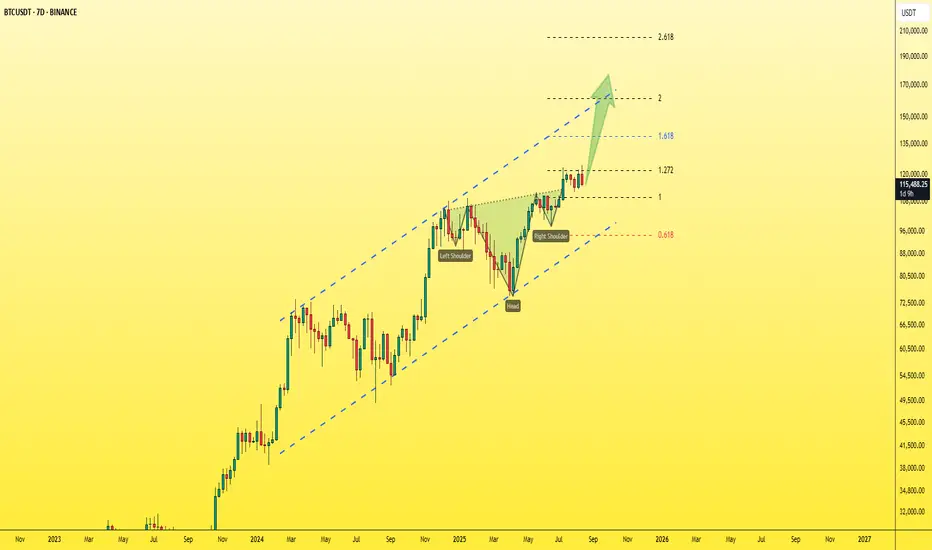
Bitcoin - Clean chart that outlines the next leg up seamlessly!The Bitcoin chart is crystal clear, simple, and very bullish.
We’ve talked about it over and over, and we’ve always said that 120K is a confirmed target — and now that it’s been hit, I’m telling you the next stop is 150K.
We’ve got a reverse Head & Shoulders pattern, the neckline has been broken,
About BITCOIN / TETHER USD
Bitcoin, the first and most popular cryptocurrency, is known for its price volatility driven by institutional demand, regulations, and global events, while Tether (USDT) is widely used as a stable trading pair to avoid converting back to fiat. Together, Bitcoin and Tether play a central role in crypto markets, with Tether’s stability supporting Bitcoin trading and influencing investor behavior.
Related pairs
BTCUSDTHello Traders! 👋
What are your thoughts on BITCOIN?
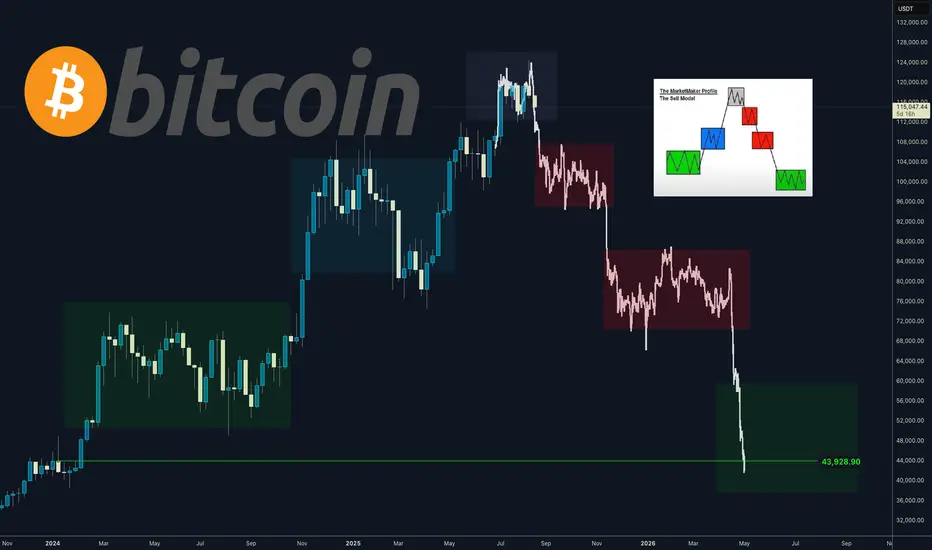
After setting a new high, Bitcoin failed to hold above the broken resistance zone and was rejected, falling back below the previously breached level.
The ascending trendline has also been broken, and price is currently attempting a pullback to t

BTC - Following Crash PlanBTC has been following my analysis of predicting a potential crash here.
We can use DXY to anticipate when a significant liquidity grab / flash crash will occur.
Since DXY is retesting a major breakdown on the weekly - monthly, it would be wise to watch for volatility today on Bitcoins price, no

Indicator Design 101Markets are noisy. Indicators exist to help filter through that noise and translate raw data into something usable. But here’s the truth: a good indicator isn’t always just about the math, it’s about how the data is designed, displayed, and interpreted.
Not all traders stare at charts because they

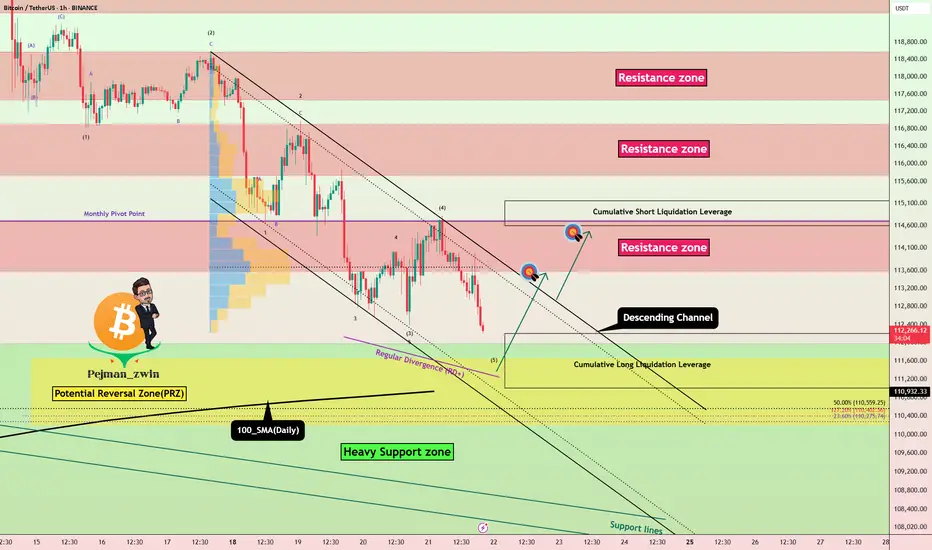
Bitcoin on the Edge! Will $114K Hold or Break?Bitcoin ( BINANCE:BTCUSDT ) started to decline from the Potential Reversal Zone(PRZ) as I expected in the previous idea .
Bitcoin currently appears to have managed to break the Support zone($116,900-$115,730) and is currently trading near the Support zone($114,720-$113,570) , 50_EMA(Daily)

Bitcoin - Huge drop will continue! Then a new ATH (buy here)Bitcoin and mainly altcoins have been pumping in the recent weeks, so the important question is - will this trend continue, or is it over? My Elliott Wave analysis on Bitcoin suggests that we should see a correction to 105,000 USDT before another push to the upside. Why? I see a completed Impulse wa

Bitcoin Long Setup: PRZ + Heavy Supports in Action!Bitcoin ( BINANCE:BTCUSDT ), as I expected in the previous idea , fell to at least $112,640 and is completing the second target (Full Target) .
Bitcoin is approaching the Heavy Support zone($111,980-$105,820) and 100_SMA(Daily) , Potential Reversal Zone(PRZ) , and Cumulative Long Liquida
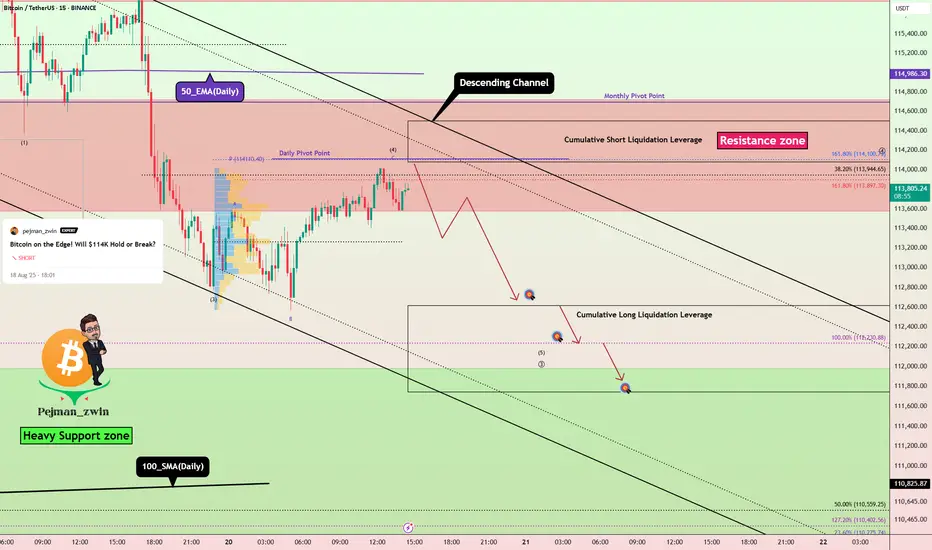
Bitcoin Short Setup _ Short-termBitcoin ( BINANCE:BTCUSDT ) has managed to break the Support zone($114,720-$113,570)/Now=Resistance zone and 50_EMA(Daily) , as I expected in the previous idea . And now it seems that Bitcoin is completing a pullback .
Also, on the 1-hour time frame , if you look closely, Bitcoin seems to
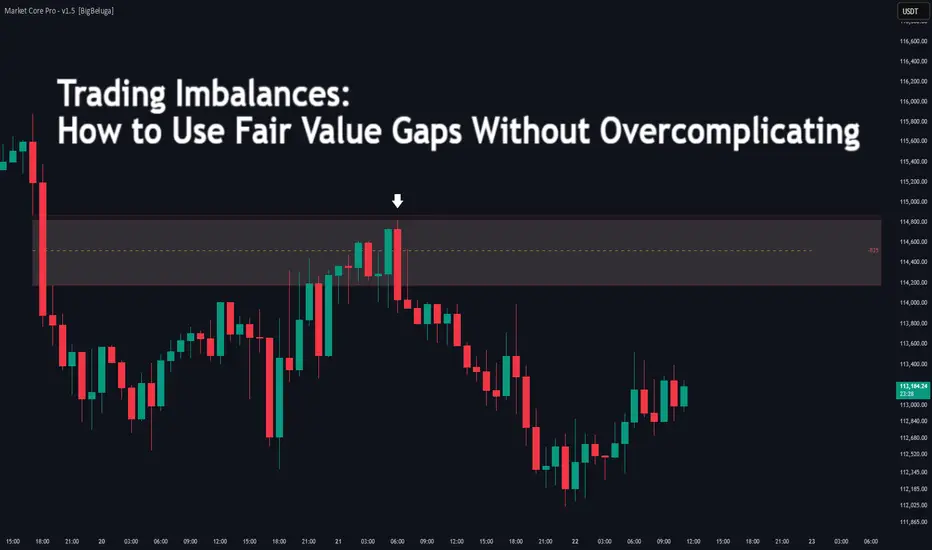
Trading Imbalances: How to Use Fair Value GapsDifficulty: 🐳🐳🐋🐋🐋 (Novice+)
This article is designed for traders who want to understand Fair Value Gaps (FVGs) in a simple, practical way — without drowning in complex Smart Money Concepts terminology.
🔵 INTRODUCTION
If you’ve studied Smart Money Concepts (SMC), you’ve likely come across Fair
Is it Bitcoin top ? I would not be surprised if yes.Everyone is bullish , we can see historical leverage longs.
Everyone expecting bull run to continue until the end of the year.
(me also)
Influencers predicting hundreds of thousands even milion targets..
Treasury companies says they are buying. (But really?)
You know the rules.
I f eve
See all ideas
Summarizing what the indicators are suggesting.
Oscillators
Neutral
SellBuy
Strong sellStrong buy
Strong sellSellNeutralBuyStrong buy
Oscillators
Neutral
SellBuy
Strong sellStrong buy
Strong sellSellNeutralBuyStrong buy
Summary
Neutral
SellBuy
Strong sellStrong buy
Strong sellSellNeutralBuyStrong buy
Summary
Neutral
SellBuy
Strong sellStrong buy
Strong sellSellNeutralBuyStrong buy
Summary
Neutral
SellBuy
Strong sellStrong buy
Strong sellSellNeutralBuyStrong buy
Moving Averages
Neutral
SellBuy
Strong sellStrong buy
Strong sellSellNeutralBuyStrong buy
Moving Averages
Neutral
SellBuy
Strong sellStrong buy
Strong sellSellNeutralBuyStrong buy
Displays a symbol's price movements over previous years to identify recurring trends.
Frequently Asked Questions
The current price of BITCOIN / TETHER USD (BTC) is 114,685.77 USDT — it has fallen −0.53% in the past 24 hours. Try placing this info into the context by checking out what coins are also gaining and losing at the moment and seeing BTC price chart.
BITCOIN / TETHER USD price has fallen by −2.18% over the last week, its month performance shows a −2.98% decrease, and as for the last year, BITCOIN / TETHER USD has increased by 79.10%. See more dynamics on BTC price chart.
Keep track of coins' changes with our Crypto Coins Heatmap.
Keep track of coins' changes with our Crypto Coins Heatmap.
BITCOIN / TETHER USD (BTC) reached its highest price on Aug 14, 2025 — it amounted to 124,466.55 USDT. Find more insights on the BTC price chart.
See the list of crypto gainers and choose what best fits your strategy.
See the list of crypto gainers and choose what best fits your strategy.
BITCOIN / TETHER USD (BTC) reached the lowest price of 15,479.02 USDT on Nov 21, 2022. View more BITCOIN / TETHER USD dynamics on the price chart.
See the list of crypto losers to find unexpected opportunities.
See the list of crypto losers to find unexpected opportunities.
The safest choice when buying BTC is to go to a well-known crypto exchange. Some of the popular names are Binance, Coinbase, Kraken. But you'll have to find a reliable broker and create an account first. You can trade BTC right from TradingView charts — just choose a broker and connect to your account.
Crypto markets are famous for their volatility, so one should study all the available stats before adding crypto assets to their portfolio. Very often it's technical analysis that comes in handy. We prepared technical ratings for BITCOIN / TETHER USD (BTC): today its technical analysis shows the sell signal, and according to the 1 week rating BTC shows the buy signal. And you'd better dig deeper and study 1 month rating too — it's buy. Find inspiration in BITCOIN / TETHER USD trading ideas and keep track of what's moving crypto markets with our crypto news feed.
BITCOIN / TETHER USD (BTC) is just as reliable as any other crypto asset — this corner of the world market is highly volatile. Today, for instance, BITCOIN / TETHER USD is estimated as 0.88% volatile. The only thing it means is that you must prepare and examine all available information before making a decision. And if you're not sure about BITCOIN / TETHER USD, you can find more inspiration in our curated watchlists.
You can discuss BITCOIN / TETHER USD (BTC) with other users in our public chats, Minds or in the comments to Ideas.