Bitcoin - Clean chart that outlines the next leg up seamlessly!The Bitcoin chart is crystal clear, simple, and very bullish.
We’ve talked about it over and over, and we’ve always said that 120K is a confirmed target — and now that it’s been hit, I’m telling you the next stop is 150K.
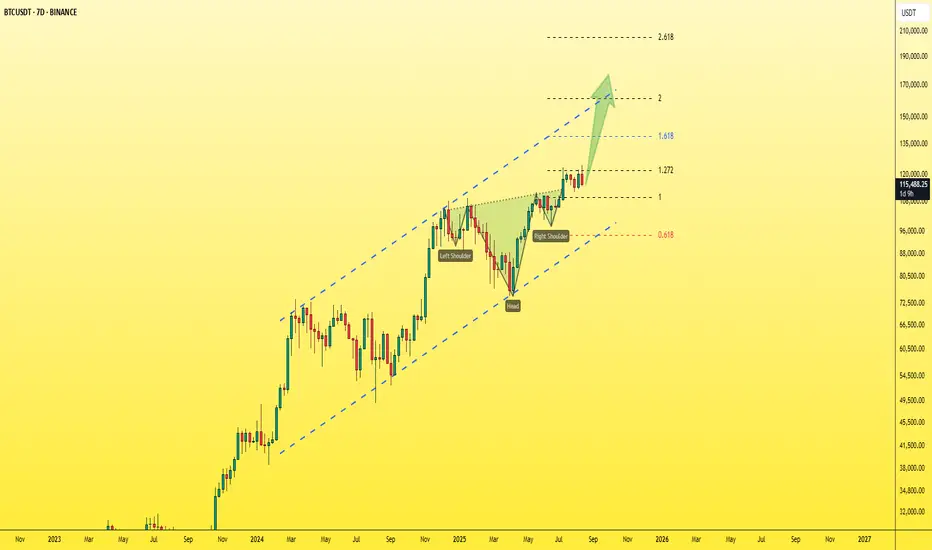
We’ve got a reverse Head & Shoulders pattern, the neckline has been broken, and price is now retesting it.
BTC also broke its previous ATH at 109,500 and is on its way to retest it right now.
All of this on the weekly chart are strong bullish signals that will at least push price to the upper side of the Ascending Channel that we’ve been tracking. Plus, the projection target of the reversal H&S perfectly aligns with this outlook — no coincidence here.
👉 150K is the next station. 🚀
Best regards:
Ceciliones🎯
BTCUSDT trade ideas
BTCUSDTHello Traders! 👋
What are your thoughts on BITCOIN?
After setting a new high, Bitcoin failed to hold above the broken resistance zone and was rejected, falling back below the previously breached level.
The ascending trendline has also been broken, and price is currently attempting a pullback to the broken structure. As long as BTC stays below the resistance zone, we expect a move lower toward the next key support levels.
Bigger picture outlook remains bullish on higher timeframes, but in the short term, a deeper correction is likely.
Invalidation: A strong breakout and daily close above the resistance zone would negate the bearish short-term scenario and resume the broader uptrend.
Don’t forget to like and share your thoughts in the comments! ❤️

BTC - Following Crash PlanBTC has been following my analysis of predicting a potential crash here.
We can use DXY to anticipate when a significant liquidity grab / flash crash will occur.
Since DXY is retesting a major breakdown on the weekly - monthly, it would be wise to watch for volatility today on Bitcoins price, noting these liquidity regions if we are about to enter a bull run ranging out 3-5 years.
Targets and potential corrective patterns marked on this chart.
Happy trading.

Bitcoin on the Edge! Will $114K Hold or Break?Bitcoin ( BINANCE:BTCUSDT ) started to decline from the Potential Reversal Zone(PRZ) as I expected in the previous idea .
Bitcoin currently appears to have managed to break the Support zone($116,900-$115,730) and is currently trading near the Support zone($114,720-$113,570) , 50_EMA(Daily) , Monthly Pivot Point , and Cumulative Long Liquidation Leverage($114,300-$113,841) .
In terms of Elliott Wave theory , it appears that Bitcoin is completing microwave 4 of the main wave 3 (probably), and we should expect a re-attack on the Support zone($114,720-$113,570) in the coming hours .
I expect Bitcoin to attack the Support zone($114,720-$113,570) at least once more after completing the pullback to the Support zone($116,900-$115,730) from Cumulative Short Liquidation Leverage($116,411-$115,760) and if it breaks , we should expect a drop to the Heavy Support zone($111,980-$105,820) .
Cumulative Short Liquidation Leverage: $120,115-$118,751
Note: Stop Loss(SL): $117,320
Please respect each other's ideas and express them politely if you agree or disagree.
Bitcoin Analyze (BTCUSDT), 1-hour time frame.
Be sure to follow the updated ideas.
Do not forget to put a Stop loss for your positions (For every position you want to open).
Please follow your strategy and updates; this is just my Idea, and I will gladly see your ideas in this post.
Please do not forget the ✅' like '✅ button 🙏😊 & Share it with your friends; thanks, and Trade safe.

Indicator Design 101Markets are noisy. Indicators exist to help filter through that noise and translate raw data into something usable. But here’s the truth: a good indicator isn’t always just about the math, it’s about how the data is designed, displayed, and interpreted.
Not all traders stare at charts because they love equations, they want clarity, guidance, and insight. Naturally there are those of us who take fascination in this however there are a large majority who find comfort in familiarity. Research from fields like data visualization, cognitive psychology, and decision making consistently shows that the way information is conveyed matters more than the complexity of the calculation behind it.
Design First: Turning Data Into Decisions
1. Cognitive Load and Chart Overwhelm
Cognitive science tells us that humans have a limited working memory (Miller, 1956; Cowan, 2001). When an indicator throws 10 different colors, lines, and plots onto a chart, it overwhelms that memory. Traders end up reacting to noise instead of clarity.
Bad Example: An oscillator with six lines showing similar data in different ways and a rainbow gradient that forces you to pause and decode every signal with no actionable events.
Good Example: A clean system that breaks this noise into actionable events via signals or distinct coloring.
2. Anchors and Intuition
Indicators like RSI and Bollinger Bands work because they give traders anchors. RSI is bounded between 0–100, with clear “overbought/oversold” zones. Bollinger Bands expand and contract in ways that are visually intuitive.
If your indicator requires constant parameter tuning or subjective guesswork, it violates usability theory. Studies on decision making (Kahneman & Tversky, 1979) show that humans rely on heuristics anchored reference points that simplify complex environments. A good indicator provides those anchors.
3. Complexity Isn’t Always Better
It’s tempting to think that stacking more formulas = more edge. But more complexity often means more noise. Traders don’t need an indicator to tell them everything; they often need it to sharpen focus.
Complex Math + Poor Design = a black box that few can use.
Simple Math + Elegant Design = a tool that traders return to daily.
The lesson: brilliance lies in usability, not obscurity.
4. Simple vs. Simplistic Signals
Once design is in place, we can talk about signals. Arrows, green/red flips, and “buy/sell” labels look appealing, but they’re rarely the full story. The advantages are they are easy to understand, digestible for beginners.
The cons; they strip away context. A green arrow doesn’t tell you trend strength, volatility, or probability it just pretends to.
Research on trading behavior (Barberis et al., 1998; Odean, 1999) shows that oversimplification leads to overconfidence and poor decision-making. Good indicators don’t eliminate judgment, they should aim to enhance it.
5. Repainting: Transparency Over Fear
Now let’s tackle repainting one of the most interesting areas. It’s extremely commonplace to see a comment section filled under an indicator with questions on repaints.
Repainting CAN shift past signals with new data, making indicators look flawless in hindsight. Traders understandably feel cheated.
However, many useful tools are repainted by necessity. ZigZag, fractals, swing detectors, and forecasting models must adjust to confirm patterns. That’s not deception—it’s the nature of adaptive models. The real issue isn’t repainting itself, it's hidden repainting. If a tool pretends to give real-time buy/sell calls but constantly moves them, it destroys trust.
The fix is simple: be transparent. If a tool repaints, label it clearly, and position it as a contextual tool (to map structure, reduce noise, or highlight potential setups) rather than a standalone trading system.
6. The Balance of a Good Indicator
We believe a good indicator balances three dimensions:
Design & Conveyance reduring cognative load and using visual hierachy with anchor points
Signal Theory where avoiding oversimplistic arrows without context is damaging
Transparency in Mechanics being clear about WHY something is occuring
At its core, a good indicator doesn’t aim to “predict the future.” It aims to make the present more interpretable. The goal is not to impress traders with complexity or spoon feed them with simplistic arrows, it's to design a tool that integrates seamlessly into decision making, guiding the eye and focusing attention where it matters most.
Complexity without clarity is noise. Simplicity without context is misleading.
A good indicator lives in the middle: transparent, usable, and thoughtfully designed.
This is are of course our humble views.
- Alex Friend / ChartPrime
Sources:
Miller, G. A. (1956). The Magical Number Seven, Plus or Minus Two: Some Limits on Our Capacity for Processing Information. Psychological Review.
Kahneman, D., & Tversky, A. (1979). Prospect Theory: An Analysis of Decision under Risk. Econometrica.
Barberis, N., Shleifer, A., & Vishny, R. (1998). A model of investor sentiment. Journal of Financial Economics.

Bitcoin - Huge drop will continue! Then a new ATH (buy here)Bitcoin and mainly altcoins have been pumping in the recent weeks, so the important question is - will this trend continue, or is it over? My Elliott Wave analysis on Bitcoin suggests that we should see a correction to 105,000 USDT before another push to the upside. Why? I see a completed Impulse wave 12345 inside the rising wedge pattern, so this is a pretty bearish combo, to be honest. What's more, September is the worst-performing month for Bitcoin statistically, so that's also a problem. You probably don't want to be speculating on price increases during this period. I recommend buying in October and riding the bullish cycle until December 2025.
Where should we buy BTC? When we take the Fibonacci retracement tool on the whole 12345 impulse wave, we have 105,386 - a strong Fibonacci 0.382 support. In confluence with the previous price action, there is a FVG (Fair Value GAP) between 103,399 and 104,622 on the daily candles. That's a pretty high-probability setup for buying BTC here, so thank me later!
What about alt season? We have seen a pretty strong uptrend on altcoins, but they also need to breathe, so expect a pullback as well. Of course, some altcoins will start pumping pretty much because we are in the alt season, but let's say the major altcoins in the TOP20.
Write a comment with your altcoin + hit the like button, and I will make an analysis for you in response. Trading is not hard if you have a good coach! This is not a trade setup, as there is no stop-loss or profit target. I share my trades privately. Thank you, and I wish you successful trades!

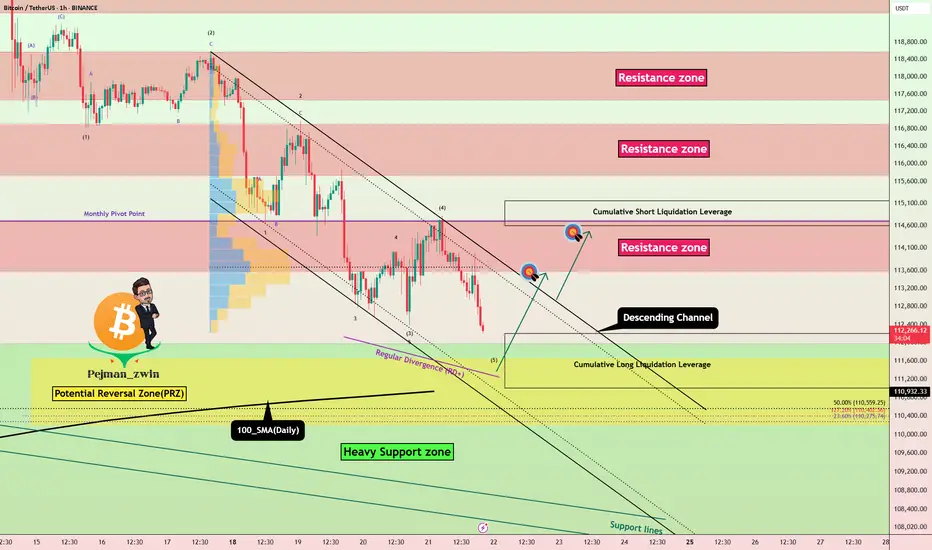
Bitcoin Long Setup: PRZ + Heavy Supports in Action!Bitcoin ( BINANCE:BTCUSDT ), as I expected in the previous idea , fell to at least $112,640 and is completing the second target (Full Target) .
Bitcoin is approaching the Heavy Support zone($111,980-$105,820) and 100_SMA(Daily) , Potential Reversal Zone(PRZ) , and Cumulative Long Liquidation Leverage($112,200-$111,000) , generally , heavy supports and resistances are NOT broken with the first attack , so I am publishing this analysis with the label ''LONG'' .
In terms of Elliott Wave theory , Bitcoin is completing a main wave 5 , as the main wave 3 was an extended wave .
Also, we can see the Regular Divergence(RD+) between Consecutive Valleys .
I expect Bitcoin to start rising from the Potential Reversal Zone(PRZ) and Cumulative Long Liquidation Leverage($112,200-$111,000) and increase to at least $113,617 .
Second Target: $114,391
Cumulative Short Liquidation Leverage: $115,157-$114,599
Note: Stop Loss(SL): $110,100
Please respect each other's ideas and express them politely if you agree or disagree.
Bitcoin Analyze (BTCUSDT), 1-hour time frame.
Be sure to follow the updated ideas.
Do not forget to put a Stop loss for your positions (For every position you want to open).
Please follow your strategy and updates; this is just my Idea, and I will gladly see your ideas in this post.
Please do not forget the ✅' like '✅ button 🙏😊 & Share it with your friends; thanks, and Trade safe.
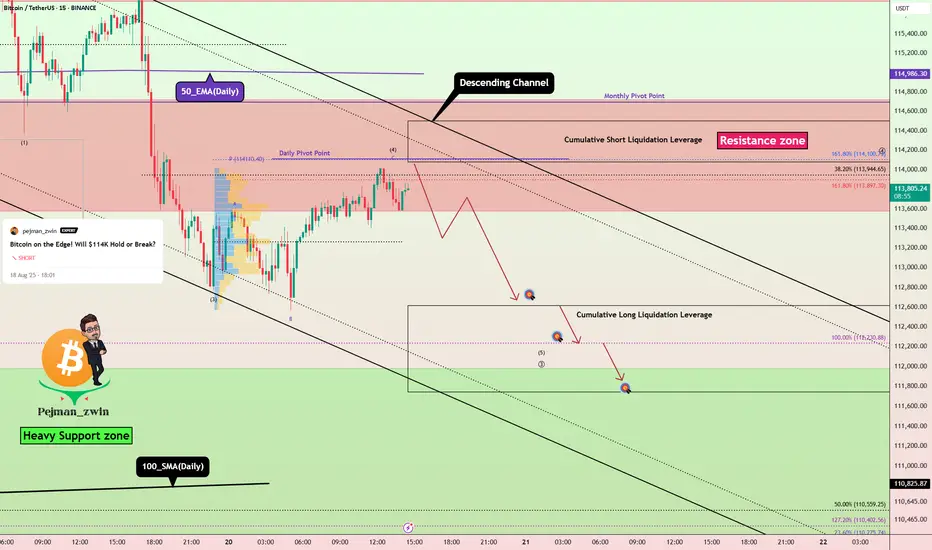
Bitcoin Short Setup _ Short-termBitcoin ( BINANCE:BTCUSDT ) has managed to break the Support zone($114,720-$113,570)/Now=Resistance zone and 50_EMA(Daily) , as I expected in the previous idea . And now it seems that Bitcoin is completing a pullback .
Also, on the 1-hour time frame , if you look closely, Bitcoin seems to be moving inside a descending channel .
In terms of Elliott wave theory , Bitcoin seems to be completing microwave 4 of the main wave 3 , so that microwave 4 could have an Expanding Flat structure(ABC/3-3-5) .
I expect Bitcoin to drop to at least $112,640 after completing the pullback ( microwave 4 of the main wave 3 ).
Second Target: $112,323
Cumulative Short Liquidation Leverage: $116,755-$115,778
Cumulative Short Liquidation Leverage: $114,500-$114,077
Cumulative Long Liquidation Leverage: $112,615-$111,743
Note: From today until Friday, important indexes will be released from the US, which can create excitement in financial markets, especially crypto, and even change the market trend when released.
Note: Most likely, after Bitcoin touches the Heavy Support zone($111,980-$105,820) and 100_SMA(Daily), we should wait for Bitcoin to bounce back (you might be able to look for a long position trigger in that zone).
Note: Stop Loss(SL): $114,823
Please respect each other's ideas and express them politely if you agree or disagree.
Bitcoin Analyze (BTCUSDT), 15-minute time frame.
Be sure to follow the updated ideas.
Do not forget to put a Stop loss for your positions (For every position you want to open).
Please follow your strategy and updates; this is just my Idea, and I will gladly see your ideas in this post.
Please do not forget the ✅' like '✅ button 🙏😊 & Share it with your friends; thanks, and Trade safe.
Is it Bitcoin top ? I would not be surprised if yes.Everyone is bullish , we can see historical leverage longs.
Everyone expecting bull run to continue until the end of the year.
(me also)
Influencers predicting hundreds of thousands even milion targets..
Treasury companies says they are buying. (But really?)
You know the rules.
I f everyone is expecting something the opposite will happen.
This is just a MMXM schematics and it doenst mean it will play out.
II don't sell my spot position (ever), but I also keep my short with target open for case this plays out.
I wish this doesn't play out , but market doesnt care about wishes, so rather expect unexpected
David Perk aka Dave FX Hunter
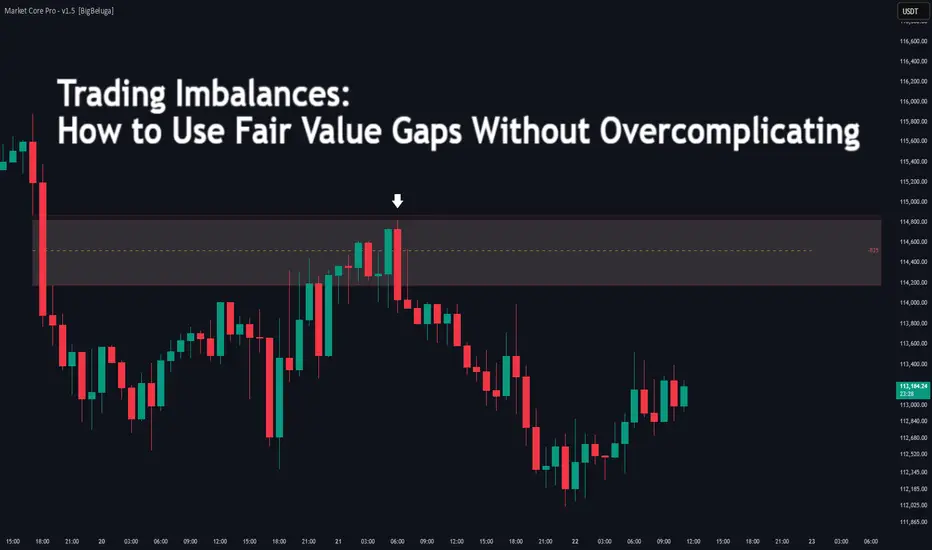
Trading Imbalances: How to Use Fair Value GapsDifficulty: 🐳🐳🐋🐋🐋 (Novice+)
This article is designed for traders who want to understand Fair Value Gaps (FVGs) in a simple, practical way — without drowning in complex Smart Money Concepts terminology.
🔵 INTRODUCTION
If you’ve studied Smart Money Concepts (SMC), you’ve likely come across Fair Value Gaps (FVGs). For many, the concept feels overcomplicated. In reality, an FVG is just an imbalance in price — a spot where the market moved so fast that it didn’t fully trade both sides.
🔑When price leaves a gap behind, it often comes back later to “rebalance.” This gives traders powerful zones for entries, exits, and target setting.
🔵 WHAT IS A FAIR VALUE GAP?
A Fair Value Gap is formed over three candles :
Candle 1: The first move (anchor).
Candle 2: The big impulsive candle (the imbalance).
Candle 3: The follow-up candle.
The gap exists when the high of Candle 1 is below the low of Candle 3 (in a bullish case). This leaves an “untraded zone” inside Candle 2.
Think of it as a skipped step. Price rushed through so quickly, there wasn’t enough time to trade at fair value.
🔵 WHY DOES PRICE RETURN TO FVGs?
Markets seek balance. When an imbalance forms, algorithms and institutional flows often revisit the gap to collect liquidity and rebalance orders.
This doesn’t mean every FVG gets filled instantly — some remain open for days or even weeks. But many serve as magnets for price.
🔑Key point: An FVG is not a magic level. It’s a clue about where inefficiency sits.
🔵 HOW TO TRADE FVGS SIMPLY
1️⃣ Mark the Zone
Identify the three-candle imbalance. Highlight the gap inside Candle 2.
2️⃣ Wait for Return
Don’t chase the impulsive candle. Instead, wait for price to retrace into the FVG zone.
3️⃣ Trade the Reaction
Bullish FVG → wait for price to dip into the zone and show bullish reaction
Bearish FVG → wait for price to retest zone and reject downward
Stops are usually placed beyond the gap, targets set toward the next liquidity pool or swing level.
🔵 EXAMPLE SCENARIO
A strong bullish candle leaves an imbalance.
Price continues higher, but a day later revisits the gap.
At bullish rejection candles form with increasing volume.
Entry taken, stop below gap, target at next swing high.
🔵 TIPS FOR ADVANCED TRADERS
Higher timeframe FVGs are stronger and attract price longer.
Not every gap fills — filter with trend direction.
Combine with OBs (Order Blocks) or liquidity zones for more precision.
Ignore small random gaps in low-volume markets.
🔵 CONCLUSION
Fair Value Gaps don’t need to be mysterious. They’re simply imbalances in the auction process. By waiting for price to return and react, traders can build structured entries with defined risk.
🔑Instead of overcomplicating SMC concepts, think of FVGs as footprints of urgency — and opportunities for balance.
Do you already trade FVGs, or is this your first time hearing about them? Share your setups below!
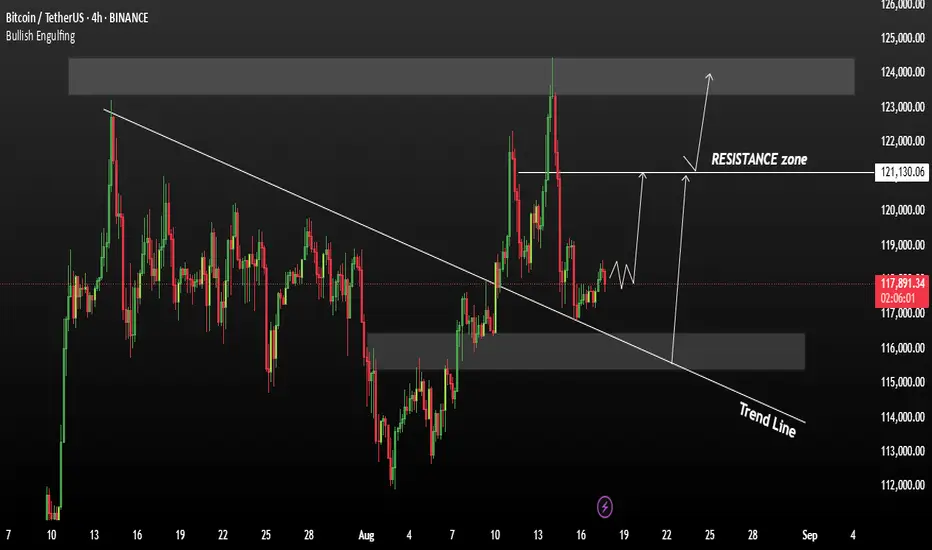
BITCOIN → Market potential change. Chance for growth to 125K...BINANCE:BTCUSDT , after a false breakdown of support, which we had been preparing for in my last idea, with the support of dovish hints from Powell, soared from 112K to 117K. What's next???
After Powell's speech and the shift in the fundamental background to positive, BTC broke the local bearish structure, forming a rally to 117K. The market exhausted its potential and, against the backdrop of the approaching weekend and a decline in liquidity, entered a correction phase. However, the relatively positive fundamental background should be taken into account when making further decisions. Lower interest rates could support the market...
Technically, after retesting the 112K zone and forming a false breakdown, Bitcoin changed market sentiment. The capture of liquidity and the breakdown of the local downward structure changes the technical situation in favor of buyers. Potential areas of interest could be 117.8, 120.27, and 125K
Resistance levels: 117K, 117.86K, 120.27K
Support levels: 114.6K, 111.9K
If, during the correction, the bulls manage to keep the price above the upper limit of the local trading range, i.e. above the downward channel and above the 114.600 zone, then interest in buying may increase. The market has the potential to test the resistance of the global trading range...
Best regards, R. Linda!

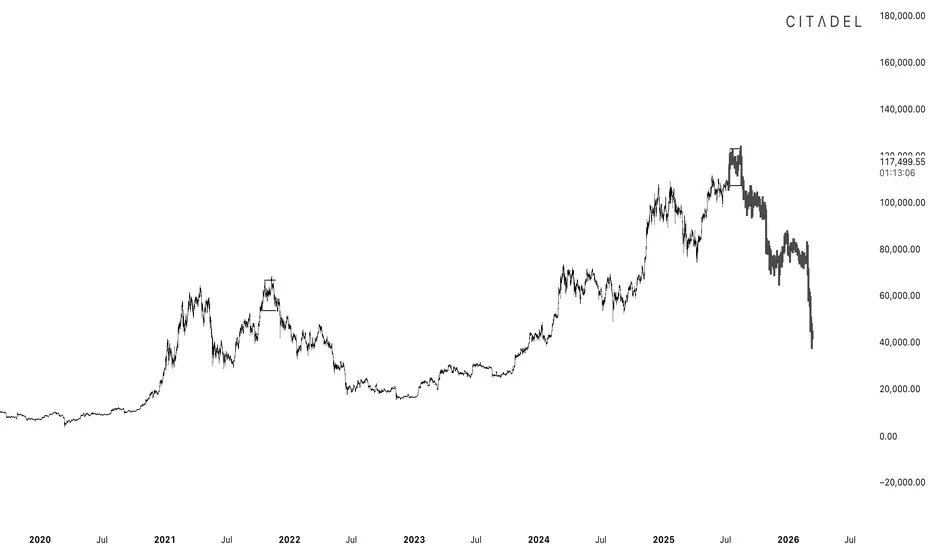
turtle soup completed. see you all at 40k next yearTS above CRH is completed on the monthly. still many who think this cycle will top the same as the last but imo the top is getting front runned by big cats. no alt szn and all alt pumps should be faded going forward
BTC near 114K$ strong daily supportAfter huge amount of correction on lower timeframes which make market and chart Red and bearish now it is time for some Short-term buy and long like what we set below Last Fib support and it will get active if we see some stop loss hunting near that support zone on chart also target is 3 times more than Stop so we may earn good profit with more possibility of stop hit but i think this set up will work because market now is providing good buy opportunities.
DISCLAIMER: ((trade based on your own decision))
<<press like👍 if you enjoy💚

Bitcoin Bullish & $137,000 in August 2025 —Top Altcoins ChoiceOk, many not August 2025 but the rise starts this same month...
What I am trying to say is that Bitcoin is bullish now and will continue growing immediately. By late August Bitcoin will be green and the entire altcoins market is already turning green. The retrace is what you are seeing now. The retrace is no big deal because there was a jump before the move was deployed.
Bitcoin moved to $125,000 and then dropped. This happens to strengthens support. Notice how $112,000 remains unchallenged. If Bitcoin produced a drop without moving to 125,000 that would be a different story.
Bitcoin is bullish because prices are not trading at $110,000 or lower. The fact that the action is happening above $112,000 confirms a very strong bullish bias on all timeframes and based on all charting systems. The Bitcoin bull!
Simplicity. Above $112,000 we win. Above $100,000 bullish long-term.
Above $110,000 bullish mid-term.
The amount of noise we have so far reveals plenty. Bearish volume was high but not high enough. Ethereum was hit but not strong enough. The smaller altcoins are showing no signs of lower lows. This will be a stop that will only last a few more days.
What about the altcoins? —Top Altcoins Choice
With the market shaking I want to know what is going to happen with my holdings, each trading pair is different. Has the chart been compromised?
Share a comment with your favorite trading pair and I will do an analysis for you.
Your support is highly appreciated.
👉 If you enjoy the content follow.
The bull market is not over.
Bitcoin will continue rising.
The altcoins will continue rising.
We know we are bullish based on hundreds of charts.
The best is yet to come.
Namaste.

BTCUSDT (bitcoin) towards the $115kHello guys!
1-BTC broke the ascending channel
Bitcoin was moving inside an ascending channel, creating higher highs and higher lows.
Recently, it broke below the lower trendline of this channel, signaling weakness and a potential shift in momentum from bullish to bearish.
2-Engulfed the last low
After breaking the channel, BTC formed a strong bearish candle that engulfed the previous swing low.
This indicates that sellers are now in control, confirming bearish pressure in the market.
3-Current bias: Bearish with possible short entries
Despite the bearish sentiment, BTC may retest previous supply zones before continuing lower.
Two possible short entry scenarios are highlighted:
Scenario 1: Near 118,600 USDT
Scenario 2: Around 119,700 USDT
Both levels align with potential retracement areas where sellers could step back in.
4-Target
The downside target is around 115,800 USDT.
This zone coincides with previous demand/support, making it a logical area where price might find buyers again.

BTC Momentum Reject Bearish move to upside]BTC is showing signs of consolidation after recent growth and correction phases on the lower timeframes The market currently appears bearish, with red candles dominating the charts However, there may be a short-term buying opportunity forming.
Price recently rejected from a support level, indicating potential buying interest An attempt to break through support was denied, and the price reversed If BTC manages to hold and push above the current level 114K, we could see upside momentum It looks like you're sharing a technical analysis view on Bitcoin (BTC), but the message is a bit unclear due to grammar and structure. Let me help clean it up and rephrase your analysis so it's clearer and more actionable:
You May find more details in the chart
Trade wisely best of Luck.
Ps; Support with like and comments for better analysis,

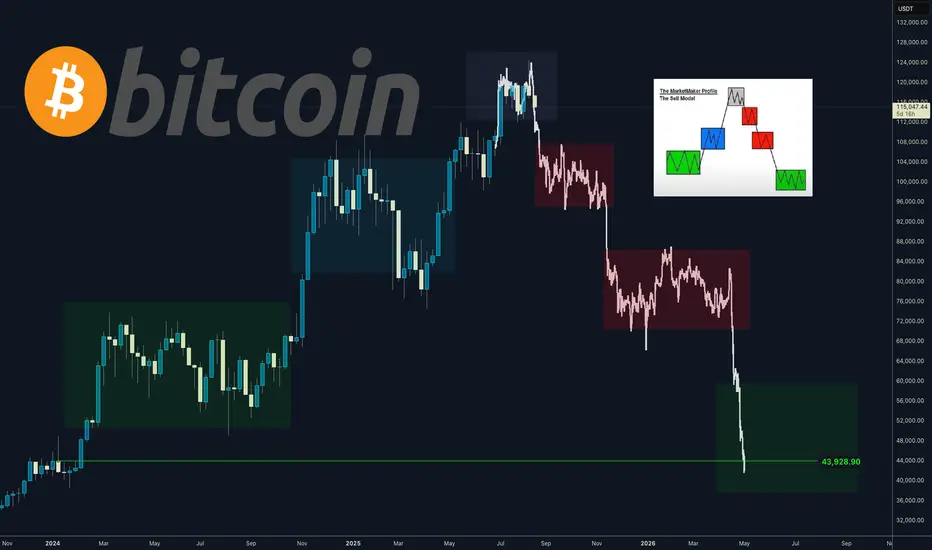
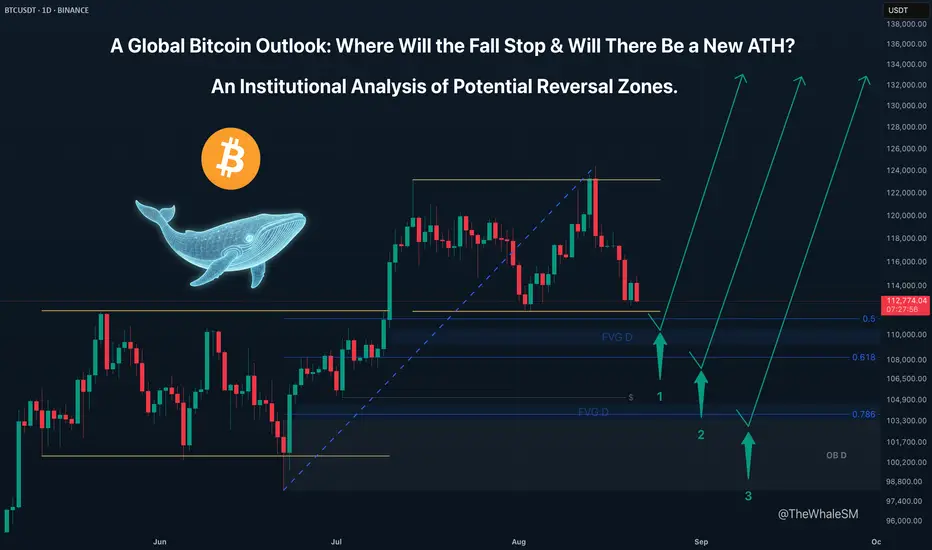
Bitcoin's Tumble: How Deep Does the Rabbit Hole Go?This isn't just a correction; it's a journey down the rabbit hole. The recent "fake" ATH was a calculated move by the whales to engineer a deep pullback. This analysis maps out the key levels in this rabbit hole where Alice—and Bitcoin—might finally find the bottom and begin the climb to a new Wonderland.
After updating its ATH on August 14th, Bitcoin did not continue its global uptrend. It was merely a liquidity sweep of the previous ATH, which confirmed the formation of a large range on the weekly and daily structures. In essence, this new ATH was a deviation above the range, after which the asset began a sharp markdown, collecting all the internal liquidity.
Most likely, the recent ATH was not the final one in this global bull cycle for Bitcoin because a proper, definitive high that would look like the start of a bear cycle was not established. Instead, it was achieved through a manipulation aimed at engineering a correction for the instrument down to key institutional levels.
Three Potential Long Scenarios
General Entry Conditions for All Scenarios:
Since these are levels from a global structure, a valid entry requires a clear reversal reaction and price finding acceptance above the respective Fib level . Confirmation of this may require waiting for 1-2 daily candles to close if the 1-4H candles do not immediately confirm the reversal.
SCENARIO 1 (Primary): The 50% Weekly Fib Level
This is the first corrective level from which a reversal is possible. A key confluence here is that reaching this level would be accompanied by a sweep of the external liquidity from the lower boundary of the range, as well as the mitigation of the upper boundary of the previous range, which could provide the necessary fuel for the next major impulse up. An added plus would be the price reaching the daily FVG that lies just below this level.
SCENARIO 2 (Deeper Correction): The 61.8% Weekly Fib Level
A break of the 50% level would mean that there wasn't enough liquidity and a deeper correction is needed. The next logical target would be the 61.8% level.
SCENARIO 3 (Final Defense): The 78.6% Weekly Fib Level
This is the last line of defense for the bullish structure. A reaction here would offer the most discounted entry to join the potential continuation of the bull run.
If the final retracement level is broken, the price will most likely attack the June 22nd low at 98200 . If the price finds acceptance below this level with daily/weekly candles, it would signal the end of the global bull cycle and the beginning of a bear market, but this is a distant and less probable perspective for now. I find it more probable that one of the three long scenarios will play out, and the price of Bitcoin will set a new, legitimate ATH.
Since the price is still inside the new large range—albeit near its lower boundary—reaching the first 50% global correction level may take some time and will likely happen next week. Whether this level can withstand the assault will determine if Bitcoin's fall continues, and just how deep Alice's rabbit hole truly is.
~~~~~~~~~~~~~~~~~~~~~~~~~~~~~~~~~~~~~~~~~~~~~~~~~~~~~~~~~~~~~~~~~
The principles and conditions for forming the manipulation zones I show in this trade idea are detailed in my educational publication, which was chosen by TradingView for the "Editor's Picks" category and received a huge amount of positive feedback from this insightful trading community. To better understand the logic I've used here and the general principles of price movement in most markets from the perspective of institutional capital, I highly recommend checking out this guide if you haven't already. 👇
P.S. This is not a prediction of the exact price direction. It is a description of high-probability setups that become valid only if specific conditions are met when the price reaches the marked POI. If the conditions are not met, the setups are invalid. No setup has a 100% success rate, so if you decide to use this trade idea, always apply a stop-loss and proper risk management. Trade smart.
~~~~~~~~~~~~~~~~~~~~~~~~~~~~~~~~~~~~~~~~~~~~~~~~~~~~~~~~~~~~~~~~~
If you found this analysis helpful, support it with a Boost! 🚀
Have a question or your own view on this idea? Share it in the comments. 💬
► Follow me on TradingView for timely updates on THIS idea (entry, targets & live trade management) and not to miss my next detailed breakdown.
~~~~~~~~~~~~~~~~~~~~~~~~~~~~~~~~~~~~~~~~~~~~~~~~~~~~~~~~~~~~~~~~~
Bitcoin Cycles: History Repeating Itself?Bitcoin has always moved in cycles — a strong impulsive rally 📈 (1), followed by a healthy correction 🔻 (2), then a breakout above the previous high 🔓 (3).
Looking at the chart, the current price action is following this same rhythm once again. After the last correction, BTC bounced strongly, retested previous highs, and is now consolidating before its next potential move.
If this pattern continues to repeat, the next leg could take Bitcoin toward the $140,000 target 🎯 — aligning perfectly with the upper bound of the long-term channel.
👉 The past doesn’t guarantee the future, but BTC’s structure suggests the market might just be writing the same story again.
💬 What’s your bias here? Are you bullish or waiting for a deeper pullback?
📚 Always follow your trading plan regarding entry, risk management, and trade management.
Good luck!
All Strategies Are Good; If Managed Properly!
~Richard Nasr

Deep Dive Into Keltner Channel 🗓The Keltner Channel is a volatility-based technical indicator that helps traders identify market trends, breakout opportunities, and potential reversal zones. Built using an Exponential Moving Average (EMA) and the Average True Range (ATR), it adapts dynamically to price movement and provides a smoother alternative to Bollinger Bands.
📚 Introduction
The Keltner Channel is a versatile volatility-based trading indicator that helps traders identify trend direction, spot potential breakout opportunities, and determine overbought or oversold conditions.
Unlike Bollinger Bands, which use standard deviation, the Keltner Channel is built around the Average True Range (ATR), making it less reactive to sudden price spikes and better at adapting to steady market trends.
At its core, the channel consists of three lines:
Middle Line – an Exponential Moving Average (EMA) of the price
Upper Band – EMA plus a multiple of ATR
Lower Band – EMA minus the same multiple of ATR
When price stays close to the upper band, it indicates strong bullish momentum.
When price hugs the lower band, bearish pressure dominates.
Periods of narrow channel width often precede breakouts, while wide channels may signal trend exhaustion.
📚 Calculation
The Keltner Channel is typically calculated as follows:
Middle Line = EMA(n) , where n is the chosen period length (commonly 20)
Upper Band = EMA(n) + ATR(m) * Multiplier , where m is chosen period length for ATR
Lower Band = EMA(n) - ATR(m) * Multiplier , where m is chosen period length for ATR
EMA smooths price data while giving more weight to recent values. ATR measures volatility by accounting for true price ranges, including gaps. Multiplier (often 2) determines how far the bands are from the EMA.
📚 How to Use Keltner Channel in Trading Strategies
⚡️Keltner Channel Breakout Strategy
The Keltner Channel breakout strategy is built on the idea that the channel defines a normal range of price movement. The middle line reflects the average trend, while the upper and lower bands expand with volatility. Most of the time, price stays inside this range, so a close outside the channel signals unusual strength. A breakout above the upper band shows that buyers are strong enough to push price beyond what is typical, while a breakout below the lower band shows the same for sellers. This behavior suggests momentum is likely to continue, making it a potential point to join the trend.
Long Setup:
Price candle shall be closed above 200-period EMA
Candle closes above the Kelner's Upper Band, indicating strong bullish breakout
Put your trailing stop-loss at the Middle Band, close trade only when candle closes below it
Short Setup:
Price candle shall be closed below 200-period EMA
Candle closes below the Kelner's Lower Band, indicating strong bearish breakdown
Put your trailing stop-loss at the Middle Band, close trade only when candle closes above it
📈Long Trading Strategy Example
1. Price candle shall be closed above 200-period EMA. In our example we have BITMART:BTCUSDT.P 4h time frame.
2. Open long trade when price candle closed above the Keltner's Upper Band.
3. Close trade when price candle closes below the Middle Band
In our case we have 2:1 risk to reward trade if we compare initial stop loss and exit price.
📉Short trading strategy example
1. Price candle shall be closed below 200-period EMA. In our example we have BITMART:ETHUSDT.P 4h time frame.
2. Open short trade when price candle closed below the Ketlner's Lower Band.
3. Close trade when price candle closes above the Middle Band
In this case we have not a good trade. After closing short price continues dropping but then suddenly pumped and destroyed all gained profit. We think it's also important to show such trades it will make you more prepared for real market when you start trade using this strategy.
🧪 Important: as you could see stop-loss on the candle close above/below Middle Band can't be the best decision in every case. It will help you to avoid the false trade close, but usually significantly cut your profit. As always we highly recommend to make your out backtest using different trade exit approaches. You can try 3:1 RR or close exactly at the Middle Band and compare the results with provided close only approach.
⚡️Pullback to the Middle Line
The pullback-to-the-middle-line strategy focuses on the EMA at the center of the Keltner Channel, which acts as dynamic support in uptrends and resistance in downtrends. In trending markets, price often retraces to this middle line before continuing in the direction of the prevailing move.
When the EMA is sloping upward, traders look for buying opportunities when price returns to the middle line, expecting the trend to resume. In a downtrend, the EMA slopes downward, and touches of the middle line can be used as selling points.
Exits are usually made at the opposite channel band, since price tends to extend from the EMA toward one of the outer boundaries. This gives the setup a favorable risk-to-reward profile: stops are placed near the middle line or the most recent swing, while profit targets are naturally defined by the channel structure. The key is to apply the strategy only in clear, directional markets, as pullbacks lose reliability in sideways or choppy conditions.
Long Setup:
Middle Band's slope shall be upward indicating the short-term uptrend.
Open long trade when price pulled back to the Middle Band.
Put stop-loss below the Lower Band.
Take profit at the Upper Band.
Short Setup:
Middle Band's slope shall be downward indicating the short-term downtrend.
Open short trade when price pulled back to the Middle Band.
Put stop-loss above the Upper Band.
Take profit at the Lower Band.
📈Long Trading Strategy Example
1. Middle Band's slope shall be positive. We use BITMART:BTCUSDT.P 4h time frame.
2. Open long trade when the price pulled back to Middle Band.
3. Put initial stop loss at the Lower Band.
4. Take profit at the Upper Band.
📉Short trading strategy example
1. Middle Band's slope shall be negative. We use BITMART:BTCUSDT.P 4h time frame.
2. Open short trade when the price pulled back to Middle Band.
3. Put initial stop loss at the Upper Band.
4. Take profit at the Lower Band.
🧪 Important: this strategy provides high frequent fast trades with poor risk to reward. Typically it equals approximately 1:1, but this setup has the high probability to play out well. Moreover, this strategy can be used in conjunction with the strategy from point 1 described above. Conditions don't contradict to each other and can allow you to earn money on two different market conditions.
⚡️Mean Reversion Strategy
The mean reversion strategy with the Keltner Channel is based on the assumption that price tends to return toward its average after moving too far away. The outer bands of the channel serve as dynamic thresholds that help identify when the market is stretched.
When price closes near or beyond the upper band, it suggests temporary overextension to the upside, creating an opportunity to anticipate a move back toward the EMA. Conversely, when price touches or moves below the lower band, traders look for a rebound toward the middle line.
The trade idea is to enter counter to the extreme move, with exits placed around the central EMA. Stop losses are typically set just outside the channel to protect against strong breakouts. This approach works best in sideways or range-bound markets, where prices oscillate around a fair value, but it tends to underperform in strong trends.
Long Setup:
Price candle shall be closed above 200-period EMA.
Open long when price touches the Lower Band.
Put initial stop-loss according to your money management system.
Close trade the Upper Band.
Short Setup:
Price candle shall be closed below 200-period EMA.
Open short when price touches the Upper Band.
Put initial stop-loss according to your money management system.
Close trade the Lower Band.
📈Long Trading Strategy Example
1. Price candle shall be closed above 200-period EMA. In our example we have BITMART:BTCUSDT.P 4h time frame.
2. Open long at the Lower Band
3. Put stop-loss. In our case we use 2%, you can use stop-loss based on your asset/time frame volatility and money-management.
4. Take profit at the Upper Band.
📉Short trading strategy example
1. Price candle shall be closed below 200-period EMA. In our example we have BITMART:ETHUSDT.P 4h time frame.
2. Open short at the Upper Band
3. Put stop-loss. In our case we use 3%, you can use stop-loss based on your asset/time frame volatility and money-management.
4. Take profit at the Lower Band.
📚 Conclusion
The Keltner Channel is a versatile tool that adapts to different market conditions and trading styles. Whether applied as a breakout system to capture momentum, as a pullback framework to ride established trends, or as a mean reversion setup in ranging markets, it provides traders with a structured way to interpret price action. Like any strategy, its effectiveness depends on matching the approach to the prevailing market environment and applying consistent risk management. By understanding the underlying logic of each method and practicing disciplined execution, traders can make the Keltner Channel a valuable part of their technical toolkit.

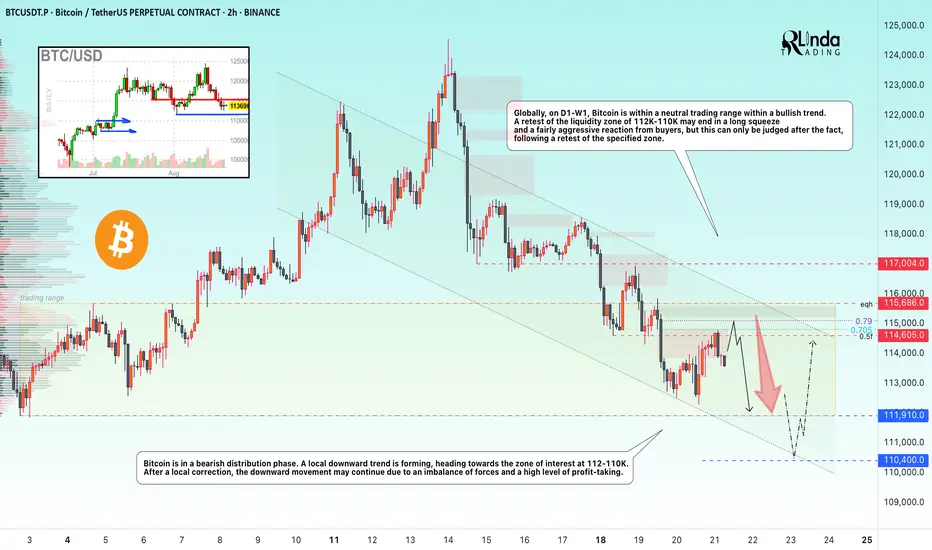
BITCOIN → Retest 112K - 110K before growthBINANCE:BTCUSDT.P is stuck within the trading range of 112K - 123K. The false breakout of the ATH ended with a reversal of the local trend and a bearish distribution phase, which may target the liquidity zone at 112 - 110K.
The market remains bullish, with no fundamental changes for the cryptocurrency market and the situation remaining positive. Technically, we are seeing a countertrend correction within the bullish trend. Bitcoin is in a distribution phase. A local downward trend is forming, directed towards the zone of interest 112 - 110K. After a local upward correction, the downward movement may continue due to an imbalance of forces and a high level of profit-taking.
Globally, on D1-W1, Bitcoin is within a neutral trading range within a bullish trend. A retest of the liquidity zone of 112K-110K may end with a long squeeze and a fairly aggressive reaction from buyers, but this can only be judged after the fact, following a retest of the specified zone.
Resistance levels: 114.600, 115680, 117000
Support levels: 111910, 110400
The downward movement is purposefully heading towards the zone of interest. Earlier, in early August, the market tested the specified level (previous ATH), but technically did not reach the liquidity zones. There is a fairly high chance of a retest of 112 - 110K before the market attempts to grow.
Best regards, R. Linda!
Multiple altcoins · The 2025 bull market is onBIOUSDT:
Here we have three weeks closing green and the highest volume ever as Bitcoin retraces. No altcoin can grow this strongly if Bitcoin is now in a bear market. No altcoin would start a bullish wave if Bitcoin is entering correction mode. The only time the altcoins grow is when Bitcoin is rising or sideways within a bull market, at other times the altcoins drop. Seeing bullish altcoins confirms a bullish Bitcoin.
BTCUSDT:
Bitcoin has been red seven days, since 14-August. Is this the start of a major correction or a period of consolidation before higher? Consolidation before higher. The proof are the altcoins.
Here Bitcoin is still trading above EMA89. Last time this level worked as support.
Bitcoin can easily move sideways within a wide range, $100,000 to $120,000, and still support major bullish action across the entire market.
Bitcoin can also consolidate between $110,000 and $120,000. $112,000 is still holding as support. Above this price, Bitcoin is bullish even short-term.
ZECUSDT:
20-August is a higher low vs 7-April and then it goes bullish, a strong breakout with two full green candles. This candles are coupled with high volume, the highest since April.
The move broke EMA89 and EMA55 as resistance. MA200 was also conquered and immediately confirmed as support.
Two strong green days while Bitcoin is moving down. It reveals what is coming for Bitcoin.
HTUSDT:
HuobiToken (HT) goes up more than 280% since 20-August. The same 20-Aug. we just saw with Zcash. Is this the latest higher low date? Let's continue.
SKLUSDT:
Here we have the highest (buy) volume week ever last week as SKLUSDT broke above EMA55. This is happening after a new all-time low. Think about it.
The market bottoms and from the bottom we have the strongest buying ever and this is also coupled with the break of a long-term resistance level. We can easily say Skale Network hit bottom and is ready to grow. While Bitcoin retraces, here we have another very strong bullish breakout, this only happens within a bull market.
Toncoin:
Clearly, a long-term rising trend. TONUSDT is trading above all the short-term moving averages; EMA8/13/21 weekly, the bulls are in.
There are many pairs like this, hundreds literally.
Remember we also saw the big ones: Cardano, Chainlink, XRP, Solana and Ethereum. Look at where Binance Coin is at right now and don't forget Tron, it is all going up.
The smaller projects are yet to catch up, yet to move; the entire market is yet to grow, but here we have proof enough that shows the 2025 bull market is on.
Namaste.

Bitcoin False Breakout after TopsideBitcoin appears to be in a bullish consolidation phase following its breakout to a new all-time high. After reaching a strong resistance zone around 115K, the market showed a clear rejection on the sell side, indicating a pause or pullback before the next potential move higher.
The broader trend remains bullish, with price action still trading above key moving averages and maintaining higher lows on the 4H chart. Price is currently consolidating near the previous ATH level, potentially forming a bullish continuation pattern (e.g., a bull flag or pennant). This is a healthy sign of accumulation before a possible leg higher.
The area around 115K is acting as a decent support zone, previously a resistance level that has now flipped. If the consolidation resolves to the upside, we could see a continuation move toward.
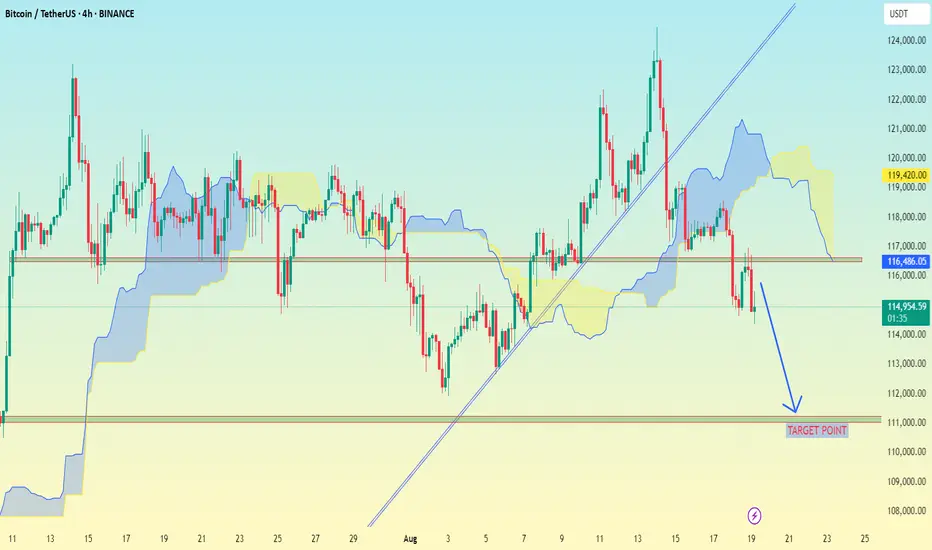
BTC/USDT (Bitcoin/USDT) 4H chart Pattern.BTC/USDT (Bitcoin/USDT) 4H chart Ichimoku Cloud and trendlines drawn.
From my chart:
Current BTC/USDT price: ~114,977 USDT
Key support zone: around 116,000 USDT (already broken downward)
Next marked support / target zone: 111,000 USDT (highlighted as “TARGET POINT”)
📉 Based on my setup, my short-term bearish target is ~111,000 USDT if the breakdown holds.