BTCUSDT (Daily)✅ BTC/USDT — 1D (Spot) | Aug 22, 2025 — Professional Technical Analysis
🔎 Chart Context
• Pair: BTC/USDT
• Timeframe: Daily
• Current price: ~113,983
• The chart shows BTC in a retracement phase after rejecting from the 123,260 high, with projected upside target 131,438.
📊 Key Observations
1. Market Structure
• BTC created a higher high at 123,260 earlier this month.
• The correction is testing key daily demand zones.
• Structure remains bullish on daily timeframe as long as price holds 111,900 – 110,600 block.
2. Support & Demand Zones
• 111,999 – 111,915: Immediate demand zone, currently being tested.
• 110,600 – 110,400: Deeper liquidity shelf, acting as a strong structural support.
• 103,269 – 100,403: Long-term support zone (last defense before bullish invalidation).
3. Resistance & Supply Zones
• 118,000 – 120,000: Minor supply zone from breakdown.
• 123,260: Recent high & liquidity cluster.
• 131,438: Key upside target (marked on chart), representing the next liquidity pool.
4. Liquidity & Fair Value Gaps
• Current retracement is designed to rebalance liquidity gaps left by July’s rally.
• Liquidity sits below 111,900; once swept, a bullish continuation into 131,000+ becomes likely.
📈 Bullish Scenario (Higher Probability)
• BTC holds above 111,900–110,600 demand block.
• Path:
• Accumulation → reclaim 118,000–120,000 → break 123,260 high.
• Target: 131,438 (major liquidity zone).
• This aligns with the chart projection, suggesting a sweep into demand before a new impulse.
📉 Bearish Scenario (Lower Probability)
• BTC fails to hold 111,900–110,600 block.
• Breakdown path:
• Retest from below capped at 115,000–116,000.
• Move toward 103,269–100,400 support.
• A daily close below 100,000 would shift structure bearish and invalidate bullish continuation.
⚡ Trading Plan
Long Setup (Preferred with trend):
• Entry: 111,900–110,600 demand zone.
• TP1: 118,000
• TP2: 123,260
• TP3: 131,438
• Stop: Below 110,000
Short Setup (Countertrend, Risky):
• Entry: Failure bounce into 118,000–120,000.
• TP: 111,900 → 103,000
• Stop: Above 123,500
✅ Conclusion
BTC/USDT Daily remains structurally bullish, with the current pullback retesting 111,900–110,600 demand. As long as this zone holds, the probability favors continuation toward 131,438 after reclaiming 123,260. A breakdown below 110,000 would signal deeper correction into 103,000–100,000.
BTCUSDT trade ideas

BTC Long? ~ Strict NO ~ Wait for 108.5kI wonder who is so damn bullish on this COOOOOIINN right. now hahahhaha

bitcoinbtc usdt daily analyse
time frame 4 hours
risk rewards ratio > 5 woooow
target 123.000 $
btc is in the down side of my critical red box
here is good area to pump
LS is very tight to decrease my probably damage
so I open a long position to win


BTC USDTHello fellow traders. I think Bitcoin hit an all-time high and many traders booked their profits. And the weekly resistance at 125,000 is important.

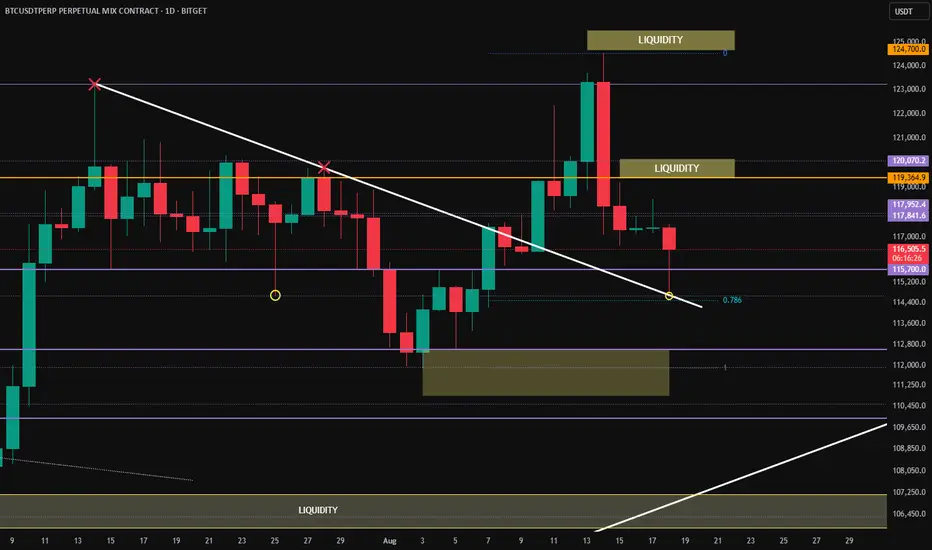
BTC - reversal in sight?Seeing:
A bounce off the downtrend
A bounce from the wick on 25th Jul
A touch off the .786
Conclusion:
If the daily/weekly candle can flip green this would be a bullish setup for Bitcoin.
Where next?
There is a liquidity zone @ 120K so this would be the next immediate target
Next zone up would be 125K
Bitcoin Top?Could Bitcoin be anticipating the market top that was only expected around November? The setup is very similar to the previous cycle.

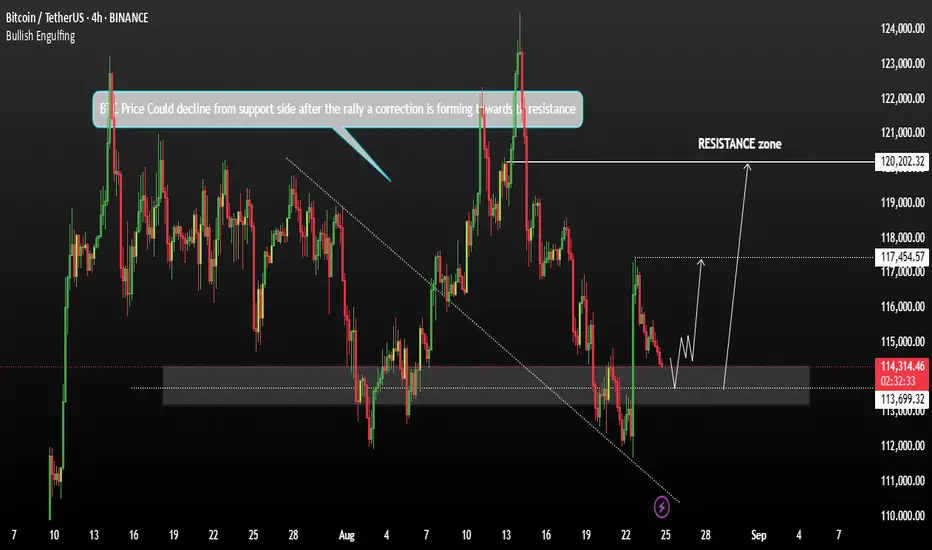
BTC Bullish Range setting on the Top Stage BTCUSDT Bitcoin (BTC) managed to break out of its local bearish structure, triggering a strong rally. Following Jerome Powell’s recent speech and a shift toward a more positive macroeconomic backdrop,
As mentioned in our previous analysis, BTC surged to the 117 zone (assumed level or range), but with the approach of the weekend and declining market liquidity, the asset has entered a corrective phase.
Technical Analysis:
BTC is currently correcting after the rally, and price action suggests that the correction is forming toward the previous resistance, which may now act as support If bulls manage to defend the 114 zone (now acting as support), it could reaffirm market confidence and indicate sustained buying interest Holding above this level would likely keep BTC within a bullish range, possibly setting the stage for a continuation move after the weekend. Our next Goal would be 120K
You may find more details in the chart.
Trade wisely best of Luck.
Ps; Support with like and comments for better analysis Thanks.
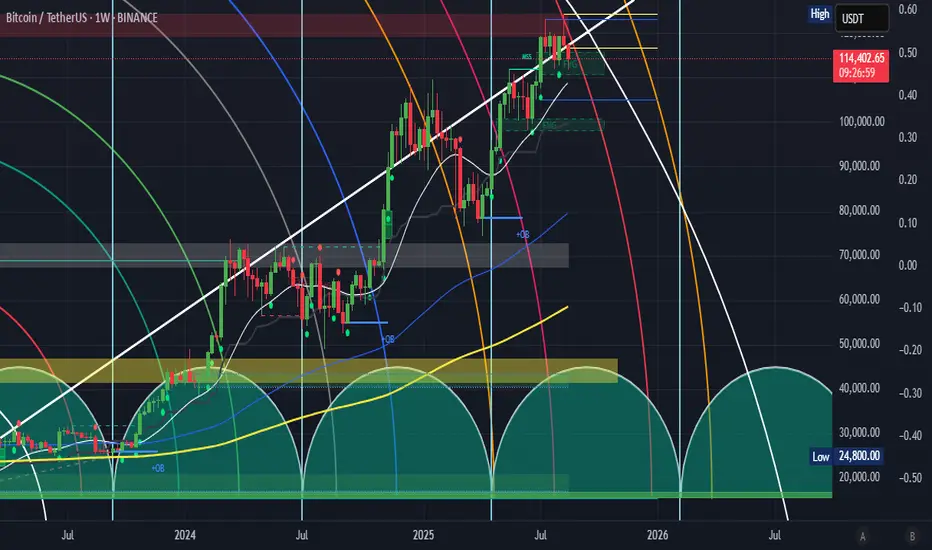
Bitcoin 4 Year CycleFibonacci Time Zones are a technical analysis tool, depicted as vertical lines on a chart, used by traders to identify potential market reversals based on intervals derived from the Fibonacci sequence. To use them, traders pick a significant high or low point, then plot vertical lines at time intervals corresponding to Fibonacci numbers (1, 2, 3, 5, 8, etc.), with the expectation that major price movements or trend changes may occur at these lines.
How to Use Fibonacci Time Zones
1. Identify a Trend: Find a clear trend, either an uptrend or a downtrend, on your chosen financial asset's price chart.
2. Mark a Starting Point: Select a significant swing high or swing low within that trend as your starting point.
3. Plot the Time Zones: On your chart, draw a series of vertical lines extending to the right from your starting point.
4. Interpret the Zones: The intervals between these lines represent periods based on the Fibonacci sequence (1, 2, 3, 5, 8, 13, etc.). The goal is to look for potential price reversals, significant movements, or trend changes near these vertical lines.
Key Considerations
Focus on Time: Unlike Fibonacci retracement levels, which focus on price levels, Fibonacci Time Zones are solely focused on the timing of potential market changes.
Ignore Early Zones: The initial zones can be clustered very close together, so traders often suggest ignoring the first few zones and focusing on later, more spread-out zones.
Combine with Other Indicators: To confirm signals, you can use Fibonacci Time Zones in conjunction with other technical indicators for entry and exit points.
#Bitcoin Bearish Setup: $BTC is facing heavy resistance at 120k#Bitcoin Sunday Update Bearish Setup:
CRYPTOCAP:BTC is facing heavy resistance at the long-term trendline (around 115K–120K). Volume is dropping, a double top has formed, and retail entries are clustered above 110K–120K, creating a strong trap.
🔸 Support 93K–95K:
This aligns with the CME gap, weekly EMA50 retest, and liquidity pool. Market makers likely drive price into this zone to flush weak hands before the next leg higher.
🔸 Upside Target: 135K–150K (after correction)
Once the correction plays out and retail gets washed out, BTC is expected to resume its bullish cycle and push into new highs.
🔸 Risk Level at 124K:
A clean weekly close above 124K with strong spot demand would invalidate the short-term bearish thesis.
🔸 Outlook:
Short area remains 110K–124K. Best strategy is gradual profit-taking on spot and step-by-step short positioning until the correction into 90–95K plays out. Reload lower for the next bullish leg.

BTC-----Sell around 113000, target 112000 areaAugust 22nd BTC Contract Technical Analysis:
Today, the large-scale daily chart closed with a small negative candlestick pattern, with consecutive negative candlesticks and single positive candlesticks. The price is below the moving average, and the accompanying indicator is forming a death cross. The overall downward trend is very clear. The trading trend is characterized by a correction followed by a pullback. Therefore, as long as you master the rhythm, entry time, and entry points, profits will be within your grasp. Remember not to be aggressive, hold onto positions, and maintain risk control; this is key to long-term survival in this market. The short-term hourly chart shows yesterday's intraday decline, which continued in the European session. US stocks opened higher, but then fell under pressure, reaching a high near 114,000. Today, support rebounded and corrected in the Asian morning. Therefore, it is advisable to wait and see for the price to complete the correction before entering the market to place a sell order. Defend against yesterday's US high. Pay attention to the strength of the decline in the European session and any breakouts.
Today's BTC Short-Term Contract Trading Strategy:
Sell on pullbacks to 113,000, with a stop loss at 114,050 and a target of 112,000. Maintain a short-term position.

BTC – big weekBTC is also sitting at a very obvious important level, from chart pov.
We can only map some important levels, and see how price reacts.
Ideally for bulls, the lows here get defended and we push back into 120k. There is a clean imbalance that would act as a magnet for price, after which we can keep on consolidating in this range and eventually break up.
A sweep of the equal lows is possible, but I'd really like a very strong reaction out of that.
If we fall back into the range, there isn't really a clean volume distribution to mark a poc from (many almost equal high volume nodes, both on perp and spot pairs). In any case, if the range doesn't give a swift reaction, it looks very like that we'll trade back into the 90k zone. Below that, are worries for if it gets to that.
Shorts for me are either on a strong flow during breakdown of the lows here, or a fast short squeeze into 117k, then distribution and stalling.

migrating Databases means = new AI prediction. I'm working on itIn when starting coding you start with a recommendations then hope they work out,
Then you gain experience and learn that there are better fits for the project.
I am in the process of migrating cloud database providers which is taking way too much time, and yes it's super boring mind numbing work.
So to jump to the point, I cannot put out a new AI prediction until I fix all the pieces of the 4D puzzle first


BTC_TRADING IDEA 08/01/25So we had a nice retracement. I’m now patiently waiting in a discount zone, aiming for a MTF LQ.
I have plenty of reasons to wait here:
– FVG
– OB
– OTE
If it doesn’t play out, I’ll look for another PD Array.
Let’s see!

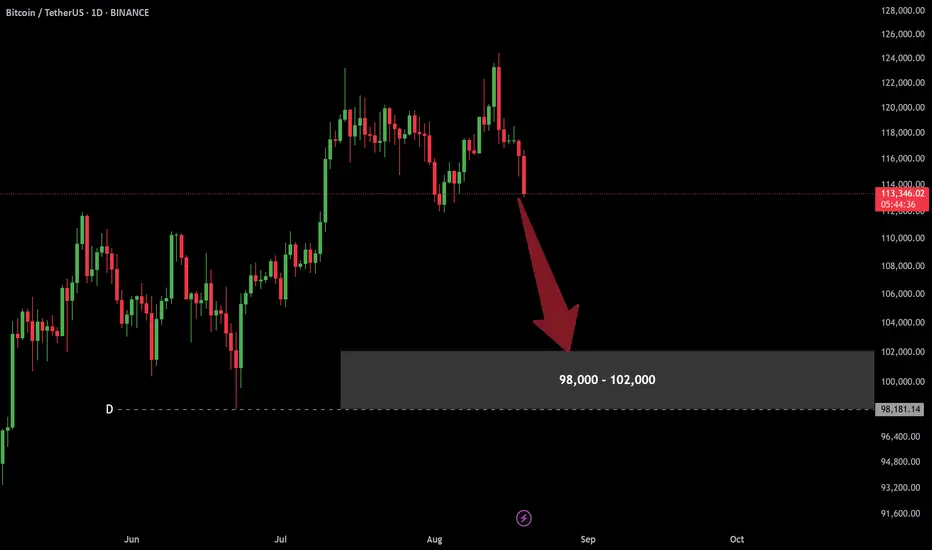
BitCoin First Stop For a Good BUYI believe there is a good demand area in 98,000 - 102,000 in long term.
But this is a question:Can bitcoin drop to 100 K ?
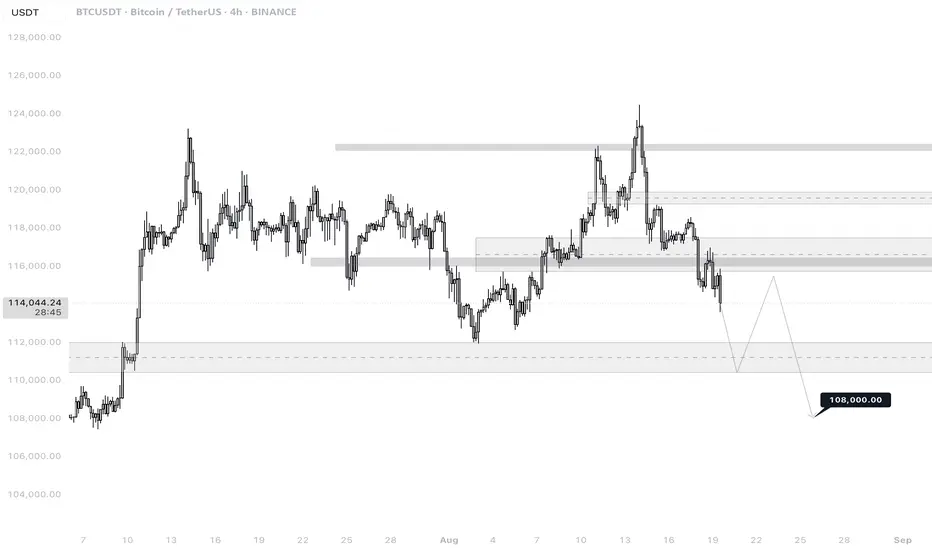
BTCUSDT 4H
🔎 Chart Context
• Pair: BTC/USDT
• Exchange: Binance
• Timeframe: 4H (240M)
• Date: 19 August 2025
This chart is mapped using liquidity zones, supply/demand levels, and structural market shifts to project BTC’s likely next move.
📊 Key Observations
1. Current Price Action
• BTC is trading around 114,050, following a sharp decline from the 124,000–125,000 resistance zone.
• The structure shifted bearish after rejection from the upper supply block.
• Current momentum is pushing toward deeper demand levels.
2. Support & Demand Zones
• 112,000–111,000: Nearest significant demand zone; previously acted as strong support after July accumulation.
• 108,000: Major liquidity target marked on the chart — a strong confluence area where large stop orders and institutional bids are likely to be placed.
3. Resistance Zones
• 118,000–119,000: Nearest overhead supply zone; likely to act as resistance on any short-term bounce.
• 124,000–125,000: Major resistance block that caused the latest rejection.
4. Liquidity Behavior
• BTC has already swept liquidity at 116,000–115,000 zone, triggering further downside.
• Liquidity magnets now sit lower, especially at 108,000, which is the projection target.
• Expect volatility as price interacts with the 111,000–112,000 demand block.
5. Projected Path
• Base case scenario (drawn on chart):
• Drop into 111,000–112,000 demand zone.
• Relief bounce toward 116,000–118,000 (supply retest).
• Continuation lower into 108,000 liquidity sweep.
📈 Bullish Case (Lower Probability, Countertrend)
• If BTC holds 112,000–111,000 demand zone strongly and invalidates supply at 118,000–119,000:
• First target: 120,000.
• Second target: 124,000–125,000 retest.
• Requires strong volume and supportive macro flows (e.g., USD weakness, strong equities).
📉 Bearish Case (Higher Probability)
• Structure favors downside continuation.
• Path:
• Retest of 116,000–118,000 supply zone (failed rally).
• Breakdown continuation to 108,000 liquidity target.
• This scenario aligns with broader DXY/EURUSD outlook where USD remains weak short-term but BTC could still flush liquidity before next bullish cycle.
⚡ Trading Plan
• Short Bias (Preferred Play):
• Entry: Relief rallies into 116,000–118,000.
• TP1: 112,000
• TP2: 108,000
• Stop: Above 120,000
• Long Setup (Risky, Countertrend):
• Entry: 111,000–112,000 demand zone.
• TP: 118,000
• Stop: Below 108,000
Bitcoin is correcting ┆ HolderStatKUCOIN:BTCUSDT on the 6h chart defended the 114,000 support with a double bottom, signaling bullish momentum. Consolidation patterns remain intact, with targets set at 120,000–124,000 if support continues to hold.

Bitcoin Go 133kAfter breaking the trend line and pulling back, it is ready to launch towards Fibonacci 1.618.
130209
130990
133000

BTC 1H Analysis – Key Triggers Ahead | Day 14💀 Hey , how's it going ? Come over here — Satoshi got something for you !
⏰ We’re analyzing BTC on the 1-hour timeframe timeframe , we can see that Bitcoin is building a range above the $117,000 support level while trading with reduced volume.
👀 After breaking through the $118,000 zone (which acted as the midline of the range), Bitcoin has formed a consolidation just above $117,000. At the moment, it is ranging with a slight upward bias in the short term.
🕯 Trading volume and the number of transactions have decreased due to the weekend/holidays.
⚙️ On the RSI, the key resistance zone is 65.63. A breakout above this level could increase the probability of moving into overbought territory. On the other hand, losing the support zone around 37.82 could trigger selling pressure and push RSI into oversold territory.
🔔 Our alarm zones are set at $119,000 and $117,000. Breaking either of these levels could provide a trading signal. Monitoring price action around these zones will give clearer entries.
💵 Looking at USDT.D , we can see a 1-hour box range structure. It recently broke down from the bottom of the box. Now, the question is whether this decline will continue or if it will return inside the range.
🖥 Summary: Bitcoin is currently consolidating in a range with a slightly upward slope. However, due to the weekend, trading volume has dropped significantly, so any breakout needs confirmation with stronger liquidity.
❤️ Disclaimer : This analysis is purely based on my personal opinion and I only trade if the stated triggers are activated .

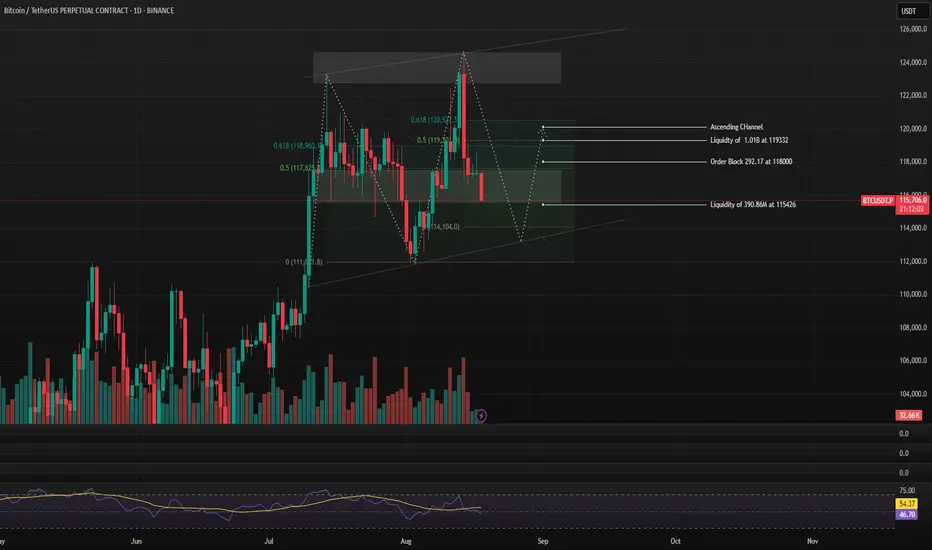
Bearish Reversal After Ascending Channel Liquidity GrabMarket Outlook in Daily Time Frame
The chart displays a clear ascending channel, which was broken after a liquidity sweep above the upper boundary. Price tapped into a higher timeframe supply zone, followed by a strong bearish rejection — suggesting smart money distribution.
Key Points
- Ascending Channel: Structure broke after price swept buy-side liquidity.
- Supply Zone: Rejection from confluence of supply + 0.618 Fib level at 120,527.
- Order Block: Price may revisit the 118000 OB before continuing lower.
- Liquidity Targets:
- Buy-side at 119,332 (swept)
- Sell-side at 115,426 (potential draw)
Outlook
Price is likely to continue downward toward the 115,426 liquidity pool, unless a short-term retracement occurs to mitigate the 118000 OB. This setup aligns with typical smart money distribution and liquidity engineering.
bitcoin cycle and overhanding to bullshello every one! lets check out the whole cart of Btc and we could see a clear Eliot count no.4 is in finishing time frame after that we are expecting wave 5 which means bulls will take over the market .please rate my analysis guide me experts. just for education

BTC Short : 95K FIRSTStill in the ascending channel post breakout of the inverse H&S formation. Looks like price is oversold at the upper resistance of the channel.
With current market sentiment at greed I'm expecting a reversal from here. First stop 95K before we resume back up.
