BTC/USDT.P – Intraday Plan (15m, Ichimoku) by RiscoraPrevious idea played out. The last candle showed strong volume and a wick to the upside, signaling some liquidity has been taken.
From here, I expect either a minor high above that wick or a correction down to the 0.618 area, then continuation of the bullish move towards the yellow liquidity block.
If price breaks below recent lows, the 106,300 level has proven itself as solid support—buyers have stepped in there twice with strong volume, so I’m not expecting it to give way easily.
Overall, I anticipate another push up to collect liquidity above and will reassess once price reaches the upper range.
Watching price action closely for confirmation.
#BTC #Crypto #Trading #Ichimoku #Riscora
BTCUSDT trade ideas

Sharing the advanced Bollinger Bands strategyHere are the Bollinger Band trading tips: *
📌 If you break above the upper band and then drop back down through it, confirm a short signal!
📌 If you drop below the lower band and then move back up through it, confirm a long signal!
📌 If you continue to drop below the middle band, add to your short position; if you break above the middle band, add to your long position!
Pretty straightforward, right? This means you won’t be waiting for the middle band to signal before acting; you’ll be ahead of the game, capturing market turning points!
Let’s break it down with some examples:
1. When Bitcoin breaks above the upper Bollinger Band, it looks strong, but quickly drops back below:
➡️ That’s a “bull trap”—time to go short!
2. If Bitcoin crashes below the lower band and then pops back up:
➡️ Bears are running out of steam—time to go long and grab that rebound!
3. If the price keeps moving above the middle band:
➡️ Add to your long or short positions to ride the trend without being greedy or hesitant.
Why is this method powerful?
It combines “edge recognition + trend confirmation” for double protection:
1. Edge Recognition—spot the turning point and act early.
2. Trend Confirmation—wait for the middle band breakout and then confidently add positions!
You won’t be reacting after the fact; you’ll be ahead of the curve, increasing your positions in the trend’s middle and locking in profits at the end. This is the rhythm of professional traders and the core logic of systematic profits!
Who is this method for?
- You want precise entry and exit points.
- You’re tired of “chasing highs and cutting losses.”
- You want a clear, executable trading system.
- You want to go from “I see the chart but don’t act” to “I see the signal and take action.”
Follow for more. Make sure to like this if you found it useful.

Why BTC hasn’t moved up recentlyBTC has been bobbing above and below this bearish triple crossover the past few months. What we see as consolidation is rather price getting stuck around these resistance levels.
The only reason why this would be occurring in my view, is due to the market makers having intention to allow this drop to play out.
The resistance is located at around 107,000 to 107,400 - watch this zone closely for a hold below / rejection and fast drop.
Scenario 1 marked with solid red line.
Scenario 2 marked with dotted red line.
Little update for y’all. Happy weekend trading.

How to Tell BITCOIN is BULLISH using MOVING AVERAGES OnlyBTC is trading sideways and it sparks a lot of debate whether or not we are at the beginning of a new bearish cycle, or if there is still a push upwards waiting to happen.
Here's how you can use the Moving Averages to determine whether or not BTC is bullish.
Don't miss this update on my stance on the market and why I think ALT Season is waiting:
______________________
BINANCE:BTCUSDT

Next Volatility Period: Around July 2nd
Hello, traders.
If you "Follow", you can always get the latest information quickly.
Have a nice day today.
-------------------------------------
(BTCUSDT 1D chart)
The key is whether it can rise above 108316.90 and find support.
When OBV rises above the High Line, we need to check if the PVT-MACD oscillator switches to above the 0 point.
However, since the StochRSI indicator is currently showing signs of entering the overbought zone, I think there is a high possibility of resistance.
We need to check for support in the 108316.90-111696.21 zone, which is the high point boundary zone.
- If OBV fails to rise above the High Line,
- If the PVT-MACD oscillator fails to remain above the 0 point,
- If the StochRSI indicator falls from the overbought zone and switches to a state where K<D,
It is highly likely that it will eventually encounter resistance in the high point boundary zone and fall.
Therefore, what we need to do is to check for support near 108361.90-108353.0.
If it rises after that, we need to check for support near 111696.21.
Entering a new purchase in the high point boundary section is a very risky transaction.
Therefore, a short and quick response is required when making a purchase.
The basic trading strategy is to buy near the HA-Low indicator and sell near the HA-High indicator.
Do not forget this.
However, since the HA-Low or HA-High indicators are intermediate values, they may move in the opposite direction.
In other words, there is a possibility that the HA-Low indicator will receive resistance and fall, showing a stepwise downtrend, and the HA-High indicator will receive support and rise, showing a stepwise uptrend.
Therefore, you must check whether there is support in the low point boundary section of the DOM(-60) ~ HA-Low section or the high point boundary section of the HA-High ~ DOM(60) section.
To do this, you must trade in a split transaction method.
-
The next volatility period is expected to start around July 2 (July 1-3).
The reason why we calculate the volatility period is because it can be a turning point of the trend.
Therefore, making a new trade during the volatility period means that there is a high possibility of being caught in a fake.
-
Thank you for reading to the end.
I hope you have a successful trade.
--------------------------------------------------
- Here is an explanation of the big picture.
(3-year bull market, 1-year bear market pattern)
I will explain the details again when the bear market starts.
------------------------------------------------------

Bitcoin sell short 83000After breaking the long-term trend line and pullback, ready for a sharp move and correction to 83,000
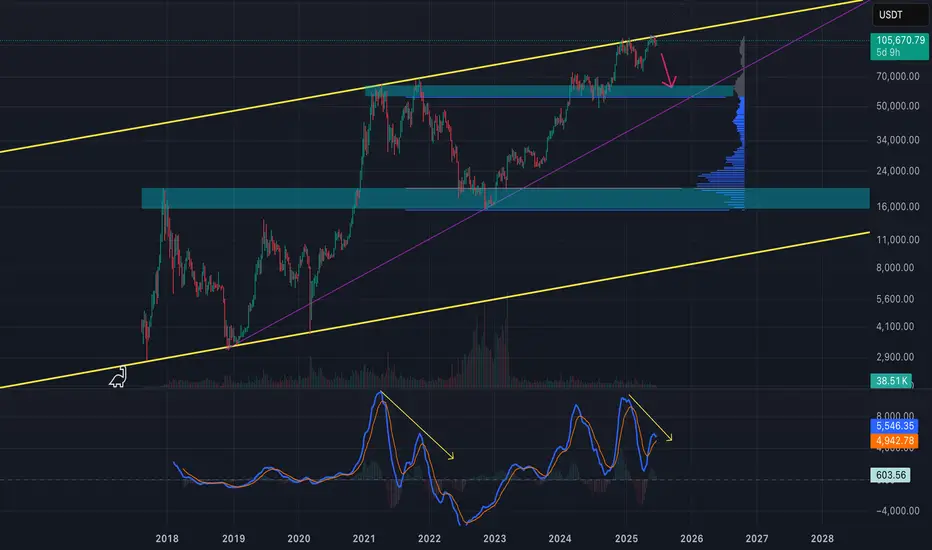
Bitcoin Technical Analysis | The Most Important Channel 📊 Bitcoin Technical Analysis | The Most Important Channel You’ll Ever See!
This might be the most critical BTC chart you come across. I've mapped out the key ascending channel that has defined Bitcoin’s long-term trend over the past few years. The upper boundary, lower boundary, and especially the midline have repeatedly acted as dynamic support and resistance levels.
Right now, BTC is trading near the channel top, with strong bullish momentum. While the buying pressure remains high and a breakout is possible, watch out for potential rejections or fakeouts around this area.
All major support and resistance levels are clearly marked in this chart. Make sure to draw this channel on your own chart and use it as a powerful tool in your trading decisions.
🧠 Follow for more high-probability setups, smart technical insights, and real-time updates!

BTCUSDT: Bounce Incoming?BTCUSDT Technical analysis update
-March 2024 resistance is now expected to act as a strong support level.
-The price has touched the 0.618 Fibonacci retracement level, suggesting a potential reversal from this zone.
-The 200 EMA on the 2-day chart is positioned as a strong dynamic support, reinforcing the bullish case.
We can expect a bounce from the $72-75k level.

Bitcoin at Risk: Will Geopolitical Tensions Push BTC Below $90K?By analyzing the #Bitcoin chart on the weekly timeframe, we can see that the price continued its correction amid rising tensions and conflict between Iran and Israel, dropping to as low as $98,000. Currently, Bitcoin is trading around $101,000, and if these tensions escalate further — especially if Iran decides to close the Strait of Hormuz — it could significantly impact global markets, and Bitcoin would not be an exception.
If BTC fails to hold above $100,000 by the end of the week, a continuation of the drop toward $90,000 is possible.
Please support me with your likes and comments to motivate me to share more analysis with you and share your opinion about the possible trend of this chart with me !
Best Regards , Arman Shaban

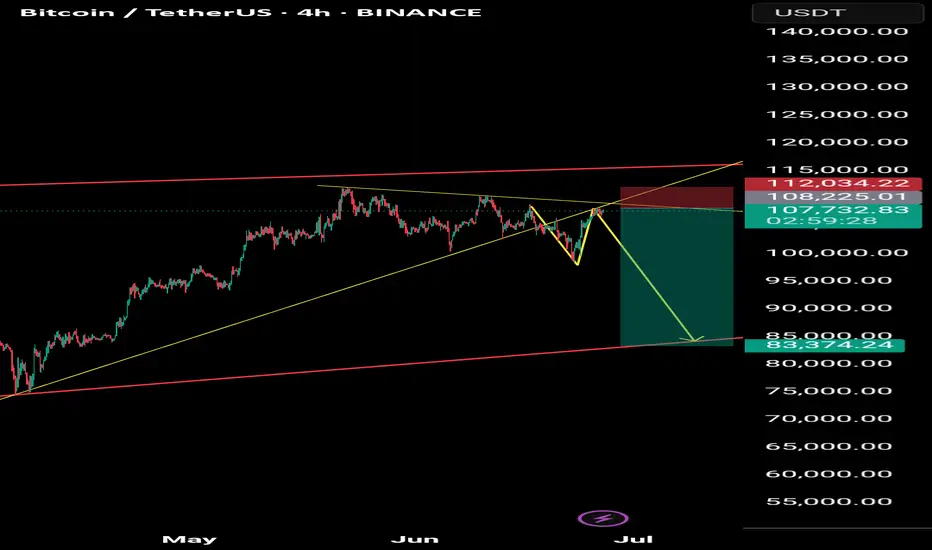
BTC: One More Leg Down?
I believe the impulse BINANCE:BTCUSDT BITSTAMP:BTCUSD BINANCE:BTCUSDT.P from April to May has been completed, and we are currently in a correction phase, which is likely to continue for some time.
In the base case, I’m considering a simple zigzag pattern:
Wave A – impulsive move down
Wave B – forming a symmetrical triangle
Wave C – expected next
🎯 Target zone: 97,500, where we have a confluence of weekly FVG, 20-week MA, and vWAP.

110k soon , best time to buy altcoins Btc still didnt complete main wave 5 , btc for last time touch 98k but this time price will attack 110k and then we will have NATH.

Lingrid | BTCUSDT potential Bullish Momentum after Fake BreakoutBINANCE:BTCUSDT just reclaimed the support area after a deep liquidity grab below 100,000, rebounding sharply toward the mid-range. Price is still trapped below the descending resistance trendline, but the recent fake break and reversal signal a bullish shift in momentum. If bulls hold above 100K, a breakout toward 105,000 looks increasingly probable.
📈 Key Levels
Buy zone: 99,000–100,500
Sell trigger: break below 99,000
Target: 105,000
Buy trigger: strong breakout above the descending blue trendline
💡 Risks
Retesting resistance at 105,000 may trigger a pullback
Descending structure still intact until breakout confirms
Sharp volatility spikes could invalidate short-term setups
If this idea resonates with you or you have your own opinion, traders, hit the comments. I’m excited to read your thoughts!

BTC - Getting 2021 Double Top/Bearish VibesLooking at the weekly chart for BTC, I'm seeing similar price action from when we double topped in 2021. We hit the top of the channel, corrected, and then had a slightly higher high before going down hard. Again we hit the top of the channel, had a strong correction, only to hit it again for a slightly higher high. But the signs of market weakness are showing in the indicators and price action. Not to mention war is looming between Israel and Iran. I'm taking a defensive posture here. I think if the bears take control, we could hit the $60k liquidity area that we missed on the last correction. We can reassess the market better at the time based on the price action and current events.
BTC - Key Level Being TestedRight now BTC is fighting a pivotal level in its current trend. After falling slightly below the $100k level price has seen a strong uptick after a 4H reversal doji was created at the bottom of the trend.
Now price is at the $105k level which has shown lots of volume with flips between support and resistance. What we are watching for now is our red "Upper Resistance Trendline". The level is currently around $109k.
If we see a rejection of that level then it would show the bears are still in control and the momentum to the downside will continue. If we can close candles above the red trendline we could see a swift move back to our white trendline and a break of that could see a strong surge to new all time highs.
If we see the current uptrend start to fade and price close below our 0.236 fib that could be an early indication of lower levels needing to be tested. If we do start to fall rapidly the most important level to hold to keep the macro uptrend intact is the 0.618 fib level. Currently this level is around $88k and if that level would be flipped into new support it would be the best level to create a macro higher low.

BTC & USDT.D => Bullish Correction Incoming?Hello TradingView Family / Fellow Traders. This is Richard, also known as theSignalyst.
Both BTC and USDT.D are sitting around key rejection zones.
💰 BTC is hovering near the $100,000 level — a major previous low and a psychological round number.
📊 Meanwhile, USDT.D is testing the 5% resistance — a supply zone and another critical round number.
As long as $100,000 holds as support on BTC and 5.1% holds as resistance on USDT.D, we could expect a bullish correction across the crypto market.
What do you think? Will these levels hold or break? 🤔
📚 Always follow your trading plan regarding entry, risk management, and trade management.
Good luck!
All Strategies Are Good; If Managed Properly!
~Rich

Bitcoin Daily Bearish: If 100K Breaks, 80KBitcoin being bearish is only true if the $100,000 support level breaks. If it breaks expect the market to dive down, deep and fast and reach around $82,500 or $88,888. But this is only if the support breaks. If support holds, as it is doing so far, then you can expect higher prices in the coming weeks. If support breaks, the flush is likely to be super fast and strong which means that you will still get higher prices in the coming weeks, so the conditions remain the same mid- to long-term, only the short-term is now in question. The bears are putting pressure on the market and many LONGs have been liquidated already.
It will be nice to see how it all develops, but it shouldn't take more than two weeks. We are likely in the clear in a matter of days (2-3 days). Do not be afraid if the market shakes, Bitcoin is going up; Crypto will grow, regardless of the short-term.
Namaste.

BTCUSDTHello Traders! 👋
What are your thoughts on BITCOIN?
Bitcoin has once again failed to break above its previous high and entered a corrective phase. The price is now moving within a channel and is approaching the lower boundary of that channel.
The correction is expected to continue toward the support zone and the bottom of the channel, where we may see buying interest and a bullish reaction.
If Bitcoin breaks above the channel resistance and key supply zone, it could trigger a strong upward move and lead to new all-time highs.
Key Note:
Price action near the channel support and demand zone will be crucial. A successful rebound from this area may signal the start of the next bullish leg.
Will Bitcoin hold the channel and bounce higher, or is a deeper correction ahead? Share your thoughts below! 🤔👇
Don’t forget to like and share your thoughts in the comments! ❤️

BTC ITS A TRAP Bitcoin is currently facing significant resistance at key technical levels and may be positioning for a potential sharp decline heading into Thursday, particularly as markets close and geopolitical tensions in the Middle East threaten to escalate.
Two key technical confluences support this thesis:
1. Bullish Gartley Harmonic Pattern: This setup is developing with highly precise ratio alignments, targeting a convergence at the Point of Control (POC) alongside multiple anchored VWAP levels. While the pattern typically involves a sharp decline, it often precedes a powerful reversal once liquidity is swept from the lows, making this a potentially attractive risk-reward inflection zone.
2. Failed Auction Structure: Price action has demonstrated an inability to sustain a breakout above the established fair value range, instead reverting back within the bounds of a parallel channel. This failed breakout—confirmed by a rejection at the upper end of the volume profile—suggests heightened probability of a move back toward fair value, marked in blue, which coincides with the POC and represents the market's most accepted / traded price.
We’ll observe how the setup develops from here.

Bitcoin Short-Term Recovery Confirmed Bulls Win!Ranging markets/sideways markets is when traders lose the most money. Always keep this in mind.
» Short-term signals are pointing to a recovery right away.
» Bitcoin's drop wicked below the 13-June low but the RSI produced a higher low and thus we have a bullish divergence.
» Bitcoin's current drop went lower yet the chart reveals lower volume now compared to 13-June. This reveals weakness on the bear camp. This means a recovery will happen next, right away.
These are just a few signals but taken together with the altcoins analysis that I showed you and the bigger picture; Ha ha! The bulls win again.
Namaste.

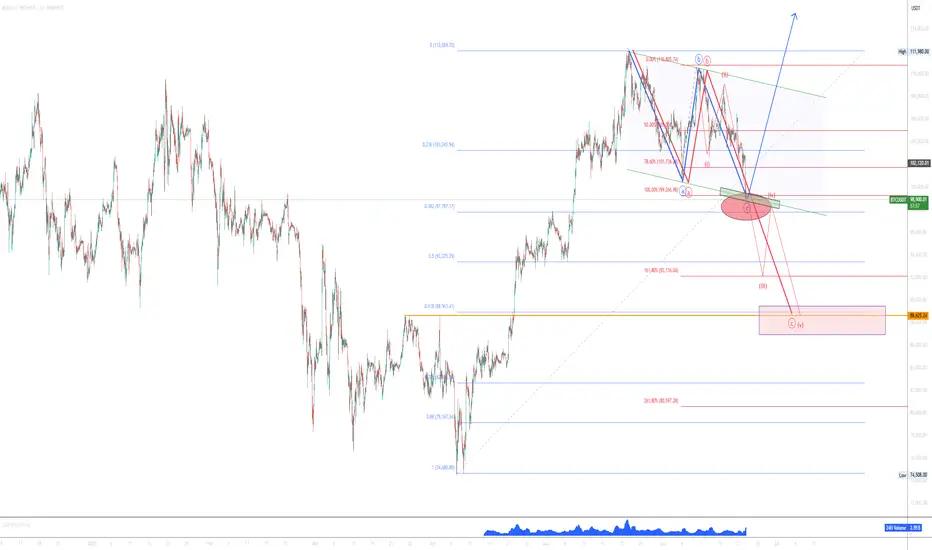
Red or Blue?Hi there!
Price is at crucial level, and we have two high probability scenarios.
We have parallel channel and Fibonacci extension 100% now and Clear Blue ABC. Some rejection can happen from here to the upside or this is it and trend continuation can start!
Red scenario is deeper ABC to the cluster level of previous HH and Fibonacci 61.8 level little under Fibonnaci extension 161.8!
Good luck traders
Bitcoin Weekly, Not Good But... Opportunities AboundI cannot say about the weekly timeframe the same I said for the daily, the situation here is different. The chart looks bad. The weekly close changes nothing.
If Bitcoin moves and closes weekly above $106,000, this can be good news, but any trading below this level has bearish potential. It can be a period of bullish consolidation but the bearish potential cannot be ignored. So, I will keep it short. Bitcoin remains in doubt on the weekly timeframe.
Bullish above $100,000. Bearish below $100,000.
It has been six weeks with Bitcoin moving with basically no change.
Last week's action did produce some loses for some traders, but for us the market remains the same. We focus on the altcoins, ignore Bitcoin for now, there is no growth and the action is still happening near resistance; at short-term support but overall, closer to a top than a bottom. It is risky to say the least. Many altcoins are trading at bottom prices and growing strong. We go for the low risk vs high potential for reward chart setups. We don't mind the market shaking, evolving or reacting to some geopolitical event, we do care about making the right choices... Focus on the altcoins for now, and for long...
Hold on. I shall give you more information.
Bearish action is indeed present but still weak.
Bearish volume is very low.
The fact that more than 1B worth of leveraged positions were liquidated calls for a pause. Each and every time this amount of money is taken out of peoples hands and transferred to the exchanges, the market changes direction. Regardless of the signals, the bigger picture or the long-term. This is a huge transfer, the whales are getting richer, retail is getting rekt.
So, the market is likely to shake some more. This is only because Bitcoin is trading way too high and hasn't produced any significant retrace after considerable growth. Again, we buy those trading low near support. We sell those trading high near resistance. As long as this is the MO, we are sure to win in the long-run.
I wouldn't want to buy-long a project that is crashing when there are others growing, yet to grow and with huge potential for growth.
Remember, the market is big now, Bitcoin is very strong above 100K. It can happen that Bitcoin goes on a retrace while the altcoins move ahead. Money flowing out of the big projects reaches the smaller projects, classic bull market dynamic. Nothing surprising; opportunities are endless.
Thanks a lot for your continued support.
Namaste.

#BTCUSDT: Major Bearish Correction?Bitcoin is currently undergoing a correction following its recent peak. While the initial price decline appeared insignificant, it has since experienced a substantial drop, suggesting a substantial volume of selling activity in the market.
We anticipate two potential areas where the price could reverse and resume its upward trajectory. These areas could lead to a price of 110,000, followed by 120,000, and ultimately reaching 150,000.
We strongly recommend that you implement rigorous risk management measures and conduct your own analysis before making any investment decisions.
Best regards,
Team Setupsfx_

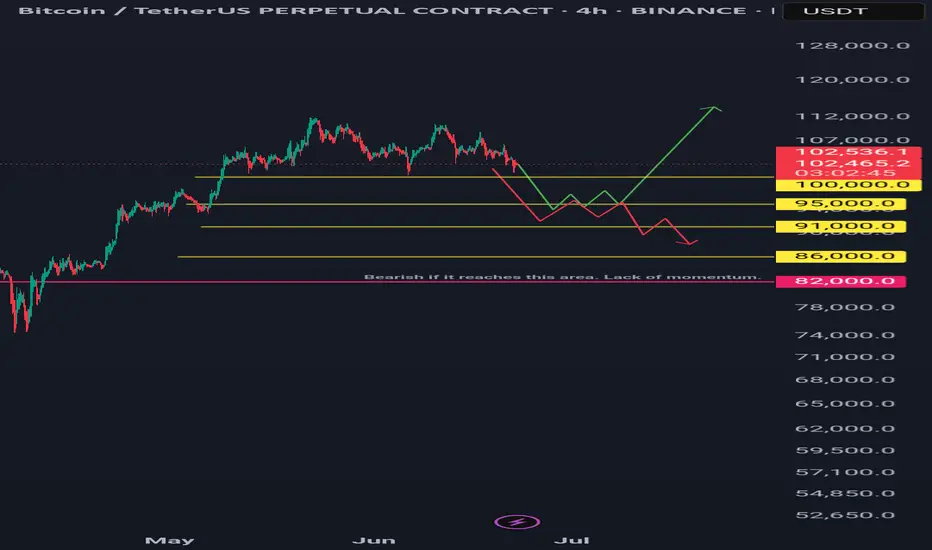
Btcusdt 4hr tf scenarios.Two scenarios: green and red lines.
Green Line: A bounce and sustained recovery above the 100-day and 200-day daily moving averages is bullish.
Red Line: A bounce followed by a lack of momentum and a break below a previous low is bearish.
Long Horizontal Red Line: If the price reaches this area, it could signal the start of a downtrend unless new bullish fundamentals emerge.
My Point of View (POV): I am bearish, primarily due to the ongoing war, similar to the conflict that began between two other countries a year ago.
However, it's important to note that every crisis and recession has historically presented a buying opportunity for institutions and 'whales.' Therefore, be prepared with funds for dollar-cost averaging (DCA), then simply hold and forget. It is recommended to conduct backtesting and research to identify optimal buying areas. DCA is key. Only invest money you can afford to lose.