TradeCityPro | Bitcoin Daily Analysis #150👋 Welcome to the 150th Bitcoin Analysis on TradingView by TradeCity Pro!
I am very happy that the number of daily Bitcoin analyses has reached 150. I hope the analyses have been useful so far and that you have been able to benefit from them. On this occasion, I want to present a complete and comprehensive analysis of Bitcoin.
📅 Weekly Timeframe
On the weekly timeframe, Bitcoin has been in a very strong uptrend since early 2023. After breaking the 24512 resistance, it made several sharp moves and, in multiple bullish waves, managed to register a new ATH in the 120000 zone.
✨ At the moment, it can be said that Bitcoin is in the seventh wave of its trend, which is quite a high number. The more waves a trend has and the more it shows signs of weakness, the higher the probability of a trend reversal.
📊 Regarding volume, there is not much to say because over time, Bitcoin’s trading volume on Binance has decreased. The reason is partly due to Binance exiting certain countries, and partly due to the growth of the DeFi space, where a significant percentage of trading now happens on DEXs, naturally reducing CEX volume.
⭐ However, if we compare the magnitude, slope, and candlestick size of the bullish waves, the trend weakness is clearly visible. But this does not mean the trend will reverse.
🧩 Many trends, even after showing weakness, continue for several more waves. If this happens for Bitcoin on the weekly timeframe, we can still take many long positions in futures during those waves.
💥 Therefore, this trend weakness is not a solid reason to avoid opening long positions for now. I still believe long positions in futures take priority over short positions.
🛒 For spot, if you have already bought Bitcoin, I suggest you keep holding for now. We can take profit after confirming the trend, but for now, it is better to hold.
🎲 However, for spot buying at current prices, I do not recommend it because it is not worth it. It is better to open futures positions to get a more reasonable profit.
🔔 Now that the 110000 resistance has been broken, the next targets are 128000 and 162000. If RSI enters the Overbought zone, these targets will be within reach.
📅 Daily Timeframe
In the last analysis I shared for this timeframe, the price was in a correction phase, and I mentioned that as long as the price is above 110183, the trend is bullish, and the probability of upward movement is higher than a drop.
🔑 That’s exactly what happened — the price formed a higher low above 110183, and RSI bounced from near the 38.21 support level and moved upward.
🔍 We had a Maker Seller zone between 120000 and 122000, and now the price has penetrated into it.
🔼 It seems to be getting rejected from the top of this zone and today failed to break it. Now we need to see what happens during the New York session.
✔️ In my opinion, it is unlikely that the price will break this top today. The market will probably wait for the U.S. inflation data release tomorrow before deciding on the next move.
📊 If inflation comes in higher than expected, the market will re-enter a correction phase, likely dropping back toward 110183.
📈 If inflation is lower than expected, Bitcoin can break the 122000 resistance and start a new bullish leg.
⏳ 4-Hour Timeframe
On this timeframe, Bitcoin finally broke through the Maker Seller zone it had formed, with a strong bullish candle. After RSI entered the Overbought zone, a Blow Off candle was printed near the 122733 resistance.
☘️ Currently, given the recent red candles, it appears that RSI’s entry into Overbought was a fake-out, and the price has pulled back to 120041.
⚡️ There is a possibility that the price could resume its upward movement from here, as the 120041 zone is an important level that can prevent further declines. In this scenario, the price would also have completed a pullback to the SMA7.
💥 If a deeper correction occurs, the next dynamic support is the SMA25, which is also an important momentum support.
📉 The lower static support levels for Bitcoin are currently 116829 and 115364.
❌ Disclaimer ❌
Trading futures is highly risky and dangerous. If you're not an expert, these triggers may not be suitable for you. You should first learn risk and capital management. You can also use the educational content from this channel.
Finally, these triggers reflect my personal opinions on price action, and the market may move completely against this analysis. So, do your own research before opening any position.
BTCUSDT trade ideas

BTC is Still Bullish (4H)After completing the X wave at the bottom of the chart, it appears that Bitcoin has formed a bullish diamond-shaped diametric pattern and is now at the beginning or middle of wave E within this diametric.
It is expected that, by holding the green-marked zone, the price will soon move toward the next targets.
We have set three targets for wave E, which are marked on the chart.
A daily candle close below the invalidation level will nullify this analysis.
For risk management, please don't forget stop loss and capital management
When we reach the first target, save some profit and then change the stop to entry
Comment if you have any questions
Thank You

BTCUSDT Price swept buy-side liquidity, tapped into a key resistance, and formed an engulfing reversal candle.
Entry was taken on the FVG retest, aligning with the break of the ascending trendline.
Target set towards sell-side liquidity for a clean risk-to-reward setup.

Latest BTCUSDT Update TodayBitcoin surged to an incredible $122,056 by the close of trading on August 11, once again challenging the key resistance level of the world’s leading cryptocurrency. But this isn’t just any number—this is the Fibonacci 1.618% extension, known as the "golden ratio" in technical analysis.
The golden ratio originates from two major market bottoms: the 2018 bear market low and the 2022 bear market low. For those who have tracked Bitcoin through various cycles, these timeframes mark the darkest periods in the history of the cryptocurrency market.
In my view, Bitcoin surpassing new highs is just a matter of time after a month of accumulation. I’ve witnessed strong ETF inflows, more companies buying Bitcoin, and positive remarks from the White House.
While Bitcoin struggles with resistance, Ethereum is on a completely different trajectory. According to TradingView data, ETH has tripled from $1,435 in April to its current price of $4,315.
Bitcoin’s volatility is still near all-time lows, while Ethereum has seen a significant increase. Just a month ago, the market predicted a 5% chance for Ethereum to reach $4,500 in August, but now everything has changed.
Many traders are betting on ETH revisiting its all-time high.
The simultaneous price surge of Bitcoin and Ethereum has pushed the total cryptocurrency market cap to a new record high of $4.14 trillion. This number reflects the strong recovery of the entire blockchain industry after a challenging phase.
With the strong rally this weekend, we expect Bitcoin and Ethereum prices to continue rising, unless there are any tariff shocks.
Will Bitcoin break through and challenge its all-time high? Stay tuned!

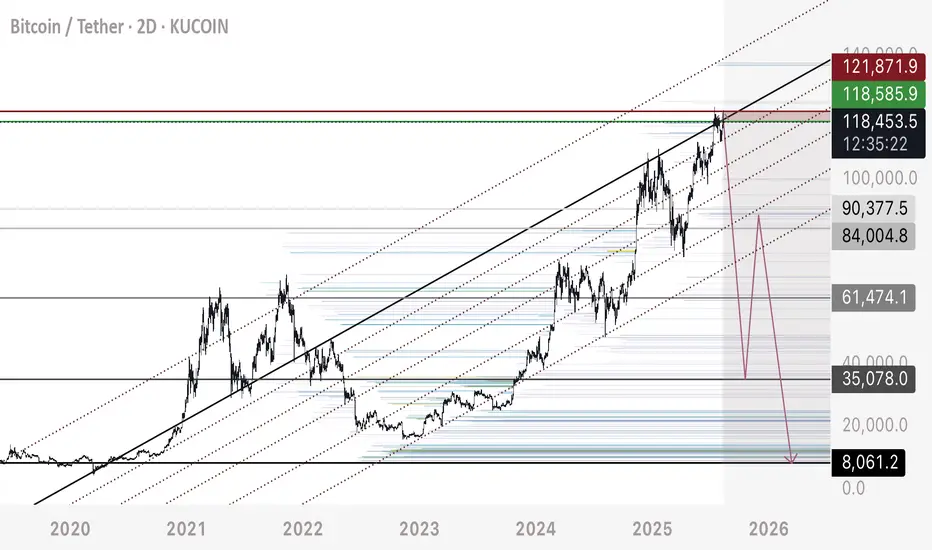
BTC - Short Update Part 2This chart shows the ascending parallel channel that supports 7,000-8,000 ultimate bottom - layered with BITCOIN ONLY liquidity zones on the multi day time frame.
The majority or liquidity in the chart is long position stop losses - leveraged sell orders.
Bitcoin has been moving straight up, consolidating sideways, straight up, consolidating sideways since End 2022.
This tells us the market is collecting long position stop losses and leaving them in tact IE not allowing price to fully drop and start triggering off the cascading chain reaction of sells that is a natural phenomenon.
Happy Trading.
#BTC #BTCUSD #BTCUSDT #BITCOIN #Analysis #Eddy#BTC #BTCUSD #BTCUSDT #BITCOIN #Analysis #Eddy
I have identified the important supply and demand zones of the higher timeframe for you.
This analysis is based on a combination of different styles, including the volume style with the ict style.
Based on your strategy and style, get the necessary confirmations for this analysis to enter the trade.
Don't forget about risk and capital management.
The responsibility for the transaction is yours and I have no responsibility for your failure to comply with your risk and capital management.
💬 Note: This is just a possibility And this analysis, like many other analyses, may be violated. Given the specific circumstances of Bitcoin, it is not possible to say with certainty that this will happen, and this is just a view based on the ICT style and strategy with other analytical styles, including the liquidity style. (( The fall of Bitcoin may not change the trend of altcoins and money will move out of Bitcoin and into altcoins, and we will see altcoins grow. ))
Be successful and profitable.

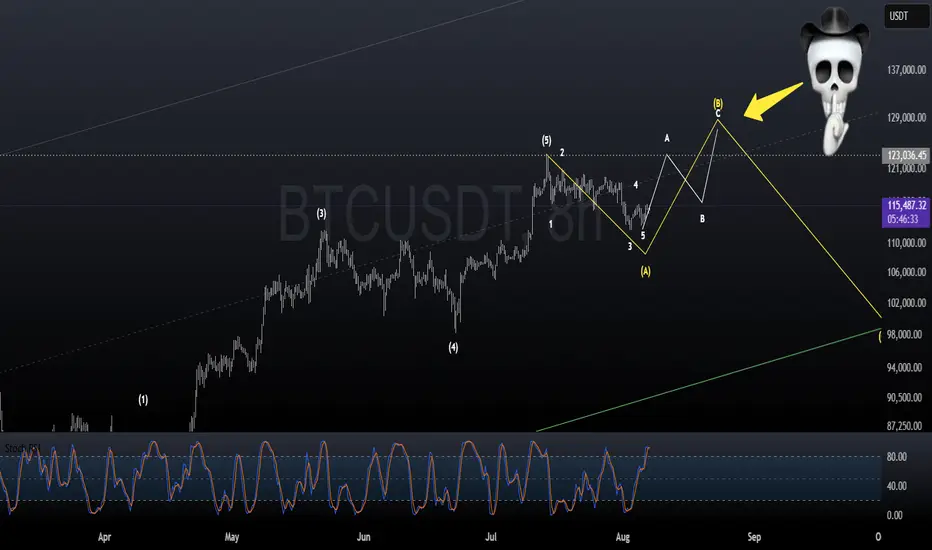
BTC, the clock is tickingLet the chart speak for itself. BTC will make new ATH before the Fed Pivot. After the pivot however, panic will occur and there will be blood on the streets.
You have been told.
P.S Not financial advice.
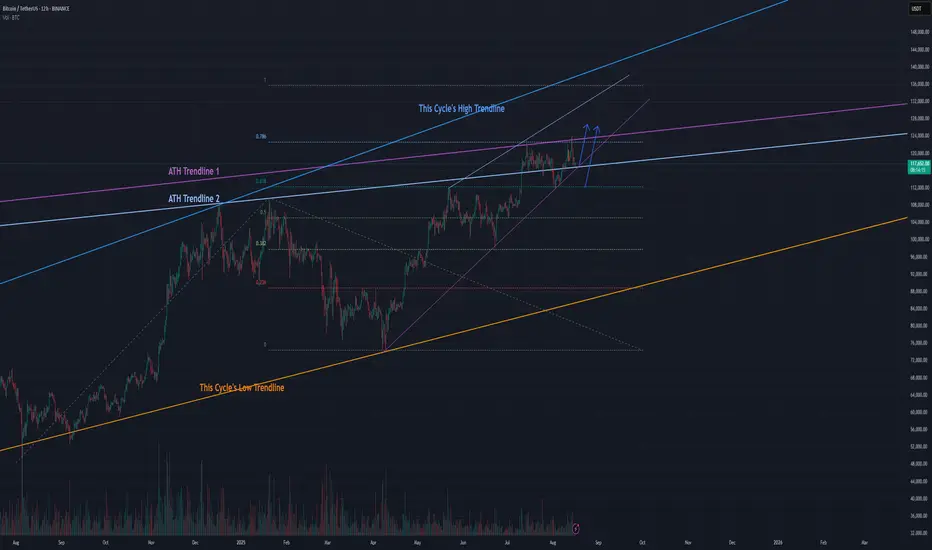
ATH Trendline - Next BITCOIN Levels to WatchThere was a CME Futures gap at just under $117k which Bitcoin came back down to fill. To explain future, the CME Futures market is only open during typical wall street trading hours, so if the Bitcoin price moves outside of that timeframe, there will be a gap in the CME Futures price chart. The gaps almost always get filled and that is what happened this week.
While it hurts to have such a strong pullback just after a new ATH, it is a good thing to have the gap filled now rather than have that waiting to be filled after the price is much higher.
The long term, ATH Trendlines are causing some resistance as well. We'd like to see a monthly candle close above these levels flipping them from resistance into support ("S-R flip") and securing $120k as the new bottom for Bitcoin.
I think price should continue up from here based on the momentum of the new ATH and many other indicators. If price goes lower, I'm still bullish as long as bitcoin can maintain a higher low above $112k.
$BTC Weekly Analysis – Big Move Coming?Bitcoin is currently trading near the 122300 resistance zone.
So far it looks more like a false breakout of the 120k level, and on a bigger picture I see the potential for a correction into the 90k–100k range. However, this doesn’t necessarily have to happen in the coming days.
Possible scenarios for the week:
Sideways : accumulation within the 115k–120k range.
Bullish scenario : a daily close above 120500 could open the way for a rally toward the 125k–130k zone.
Bearish scenario : if price drops below 115k, I expect a move toward the 102k–107k area. The green zone (~111k) could provide strong support, as it has previously held the price.
RSI on the daily chart is at 63, very close to the overbought zone. A breakout above 120500 could extend the rally, but the risk of a pullback is high.
Disclaimer: The author’s opinion may not align with yours.
BYBIT:BTCUSDT.P
BTC Rejection can touch 100K.......The chart is showing what looks like a double top pattern at the recent highs (~118k–120k USDT), marked by two "R" resistance points.
The neckline is roughly around the 112k zone (green support line).
A confirmed breakdown below this neckline could activate the double top target, pushing price lower.
2. RSI Divergence
There’s a bearish divergence — price made a higher high, but RSI made a lower high.
This signals weakening bullish momentum and increases the probability of a pullback.
3. Support & Resistance Zones
Immediate resistance: 118k–120k
Immediate support: 112k (neckline)
Next major support: ~104k (previous range support), and then ~96k if selling intensifies.
4 Possible Scenarios
Bearish: If BTC closes below 112k with volume, it may head toward 104k, possibly even 96k.
Bullish invalidation: A strong daily close above 120k with increasing volume could negate the bearish setup and lead to new highs.
The second push to resistance faced a strong rejection, completing a double top pattern.
This rejection, combined with high bearish volume, strongly signals downside momentum.
The setup confirms a likely move to lower price levels in the near term.

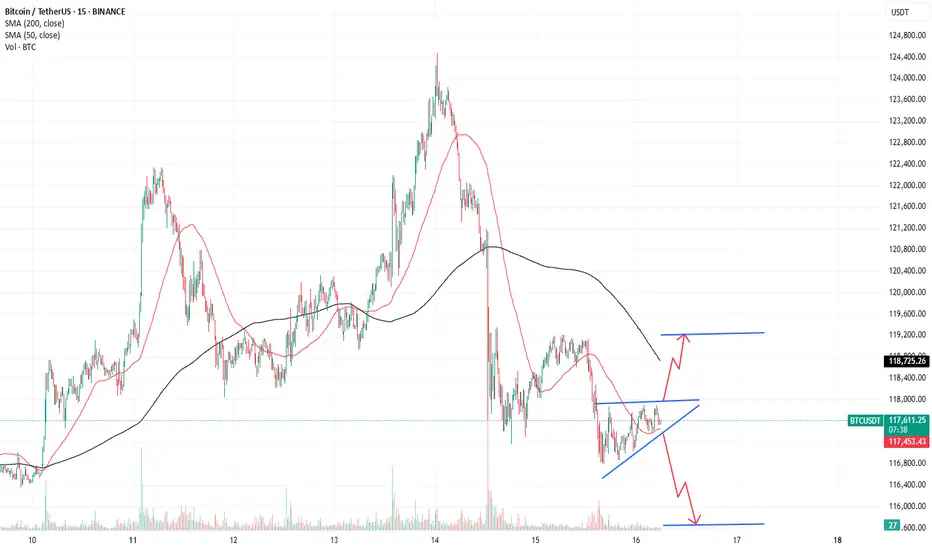
BTC/USD 1h chart Pateern.From this updated chart, "TARGET POINT" label more clearly.
The horizontal green box you marked is roughly between $122,000 and $123,000 (though this seems like a different scale—possibly a derivative or index, not direct BTC price in USD).
The price is breaking above the descending trendline and heading toward that high-volume resistance zone.
The main targets I see from your own chart markings are:
First target: around $118,991 (blue label) — likely the nearest resistance.
Second target: around $120,137 (yellow label) — next key high-volume node.
Final target (your green box): around $122,000–$123,000.
These seem to be based on volume profile gaps and resistance levels.

Stablecoins: Stability in a World of VolatilityIn the cryptocurrency space, everything changes rapidly: trends form within hours, and assets can rise or fall by double-digit percentages in a single day. In such conditions, traders need a tool that allows them to preserve capital and act without haste. That tool is the stablecoin — a digital asset with a fixed price.
They serve as a kind of “safe harbor” in the storms of the crypto market. Even if Bitcoin or Ethereum face a sharp correction, a stablecoin theoretically remains equal to 1 US dollar (or another pegged currency).
What is a Stablecoin
A stablecoin is a token whose value is pegged to a base asset at a 1:1 ratio. Most commonly, this peg is to the US dollar, but there are stablecoins linked to the euro, gold, or even a basket of assets.
The idea is simple: combine the convenience of cryptocurrencies (fast transfers, no borders, transparency) with the predictability of traditional money. This allows traders to quickly move capital between positions or exchanges without losing value to volatility.
Main Types of Stablecoins
1. Fiat-Backed
The issuer holds actual dollar reserves in bank accounts.
The peg is maintained by allowing token holders to redeem them for fiat at any time.
Examples: USDT (Tether), USDC.
Pros: high liquidity, easy to understand.
Cons: reliance on the issuer and a centralized structure.
2. Crypto-Backed
Backed by other cryptocurrencies used as collateral.
Collateral often exceeds the token’s face value to protect against volatility.
Example: DAI by MakerDAO.
Pros: decentralization and blockchain transparency.
Cons: risk of a sudden drop in collateral value, which can trigger liquidations.
3. Algorithmic
The peg to the dollar is maintained via smart contracts that regulate the supply of tokens.
Tokens are minted when the price rises and burned when it falls.
Examples: former UST (Terra) before its 2022 collapse.
Pros: decentralization, no need for real reserves.
Cons: highly vulnerable to market panic.
Why Stablecoins Matter to Traders
Locking in Profits
Closed a profitable ETH long? Instead of cashing out to fiat, you can convert to a stablecoin and preserve purchasing power until your next entry.
Protection from Volatility
When the market looks overheated or uncertain, stablecoins allow you to “go into cash” without leaving the crypto ecosystem.
Liquidity and Transfer Speed
A traditional bank transfer may take days, while moving USDT or USDC takes minutes — crucial for arbitrage or quick reactions to news.
A Tool for Margin Trading
Many futures platforms use stablecoins as the base currency for settlements, simplifying profit and loss calculations.
Risks and Pitfalls
Regulatory Pressure
Centralized issuers can freeze addresses or restrict operations in response to government requests.
Losing the Peg (Depeg)
If confidence in the issuer or system drops, the stablecoin’s price may deviate from $1. Algorithmic stablecoins are particularly vulnerable.
Centralization
Fiat-backed tokens depend on the issuing company, which controls reserves and redemption processes.
💡 Practical Use with CV_Pro
When trading crypto futures with CV_Pro, stablecoins can serve as a “parking spot” between trades. Closed a profitable position? Move funds into USDT, wait for the next signal, then re-enter. This reduces the impact of volatility and gives you time to make thoughtful entries.

Market Update for BitcoinBitcoin is moving according to the bullish (green) scenario, holding above the trendline. At the moment, there’s pressure from the resistance zone, but only 1.5% remains before setting a new ATH.
On the lower timeframe, we can see that high-leverage longs have already been flushed out, so the move may continue.

Bitcoin - Breakout from consolidation patternBitcoin volatility has contracted and is currently exhibiting an Ascending Triangle / Pennant pattern. The longer price remains within the boundaries of the pattern, the stronger the breakout from it will likely be.
BTC will dump to 90k (MAJOR CRACH)I think the big Bitcoin rally ended at $124,500. I knew Bitcoin should hit a new record high above $123,200 and I thought it should be 130k but it didn’t happen. Primary wave 3 is over and now we have to wait for a correction to the 90k range to complete Primary wave 4. Altcoin season didn’t start because Bitcoin didn’t give it a chance! . This is my analysis on the weekly time frame. I have been long since the 80k range and if you look at my ideas they are mostly long but in my opinion Bitcoin has completed its main wave 3 and I am entering a short position.

BTCUSDTBullish Divergence
Expecting it will break LH and start upTrend.
Taking Entry on break of LH and placing SL below LL
R:R=1:1 can ride the trend too

Bitcoin Setup: Long Entry Around $115-116K Area | 5:1 R/R Trade📊 If price drops into the white boxed area, I'm looking for a long entry.
But… there's a chance we sweep the lows near $115,555 first before moving up — so avoid blind limit buys. I'll wait for a reaction at the yellow line before entering.
🎯 I'm expecting price to hunt for liquidity around the white box area — essentially targeting stop losses from less experienced traders — before making its move higher.
This isn't necessarily based on strict technical logic, but rather from years of trading experience watching how these patterns typically unfold.
⚠️ **Setup is invalid if:**
• Move happens before this week's weekly candle closes
• Price breaks below the white box
• Price pumps without returning to the box
🚀 If we get this move early next week, I'm targeting at least the blue circled zone.
ATH is possible, but conservatively I'll take profits there.
📈 This trade setup offers a risk-to-reward ratio of 5:1. Without including fees, the breakeven win rate for this trade would be approximately 16.67%.
Knowing these figures in advance helps me avoid emotional trading.
💡 If you often find yourself trading based on emotions, I recommend doing this type of pre-planning and quantifying your setups before execution — it can be a simple yet highly effective improvement.
---
**Trading is simple.** You don't need multiple indicators or dozens of lines on your chart. A clean and simple chart often works best — it keeps your decisions consistent and reduces uncertainty.
Sure, it might not look flashy, and my analysis may seem a bit "plain" compared to others… but that's how I like it.
If you find this analysis useful, feel free to follow me for more updates.
---
*Disclaimer: This post is for general informational and educational purposes only. It does not constitute financial advice, investment recommendation, or a service targeting specific investors, and should not be considered illegal or restricted information in any jurisdiction.*

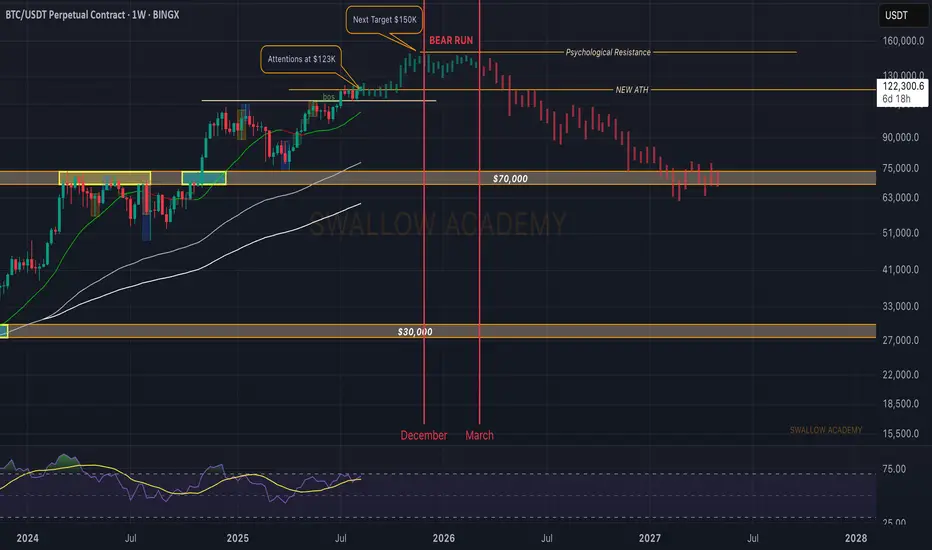
Bitcoin (BTC): Approaching ATH | Marking Potential Cycle TopBitcoin on the weekly timeframe is showing a strong start to the week, where the price is looking for a potential breakout, which then could result in yet another ALL-TIME-HIGH.
Now markets have been very volatile lately, so being close to ATH makes the situation pretty dangerous, so for better opportunities to trade, wait for that proper breakout (which most likely will be an aggressive one).
Now as we approach the end of 2026, we are also thinking that the bull cycle is in the ending phase and 2026 should mark itself as the start of a bear market, so let's get ready and prepare ourselves for it.
We still have time before that so alts still have their chance!
Swallow Academy
BTCMy view on BTC INDEX:BTCUSD
BTC looks like it’s in a distribution zone near 124k–126k.
A liquidity sweep above July High (124k–126k) is likely before a deeper correction.
After liquidity grab → a retrace toward 111.8k – 112k (your Daily/R Level) is very realistic.
If momentum is weak, BTC can even test July Low (105k – 106k).
🔹projection (fake break + liquidity sweep + drop to support) is valid.I agree with it — very probable path.

BTCUSDT - Divergence & Reversals 'Spotted'Bearish Arguments (more dominant now):
Triple confluence: Double Top + Rising Wedge + RSI Divergence → strong bearish case.
If price closes below $112k, this could trigger accelerated downside selling.
Next possible support levels:
$105k (previous demand zone & trendline support)
$96k (stronger historical level)
Bullish Arguments (less strong):
As long as price holds above $112k–113k, bulls are still in control.
A bounce from this zone could invalidate the bearish wedge in short-term.
RSI at ~51 means market isn’t oversold yet → room for downside remains.
Forecasting Outlook
Bias: Bearish, unless BTC reclaims momentum above $120k+ with strong volume.
If breakdown happens, target zone = $105k → $96k.
If support holds, BTC may consolidate sideways before another attempt upward.

Bitcoin Monthly Update + Top Altcoins Choice, Your PickThis is a monthly Bitcoin chart and is really interesting, it supports without a shadow of doubt a strong continuation and bullish bias.
First, the month started red but is now green. This is always a strong signal when the action starts bad but recovers quickly during the month just to end up good. Starts red to end up closing green.
Bitcoin also closed four consecutive months green. This one will be the fifth month. Since the bears already gave everything trying to push prices lower and failed, we know higher prices are guaranteed next.
We also know this because Ethereum just hit its highest price since December 2021, near the top of the last bull market. Now we have Bitcoin, XRP and Ethereum, the top three Cryptos and the biggest projects, moving forward and doing great.
It is only natural. It is the logical sequence, the smaller pairs/projects will do the exact same.
Just as XRP gained in bullish momentum and hit a new all-time high, to follow Bitcoin, Ether did the same. Then we have Solana and Cardano, Dogecoin, Toncoin, Polkadot, Shiba Inu, Avalanche, Notcoin, Chainlink, Bitcoin Cash, Uniswap and the rest.
They are preparing to grow now and are bullish now. Ready to grow and strong.
No more retraces, no more corrections; the 2025 bull market wave & bull run is getting close.
The next immediate target is $137,206. Notice how the $122,630 target on this chart was hit perfectly. So these numbers are good and work long-term.
» After $137,206, Bitcoin is set to hit $155,000.
(Leave a comment with your Top Altcoins Choice, I will do an analysis for you!)
Thank you for reading.
Namaste.

BTCUSD : Long levelHere is a great entry point for those who scalp this instrument or pips. The level is marked with a green arrow. It will be active until I report. It may become inactive over time.
Watch out for trading on the news.

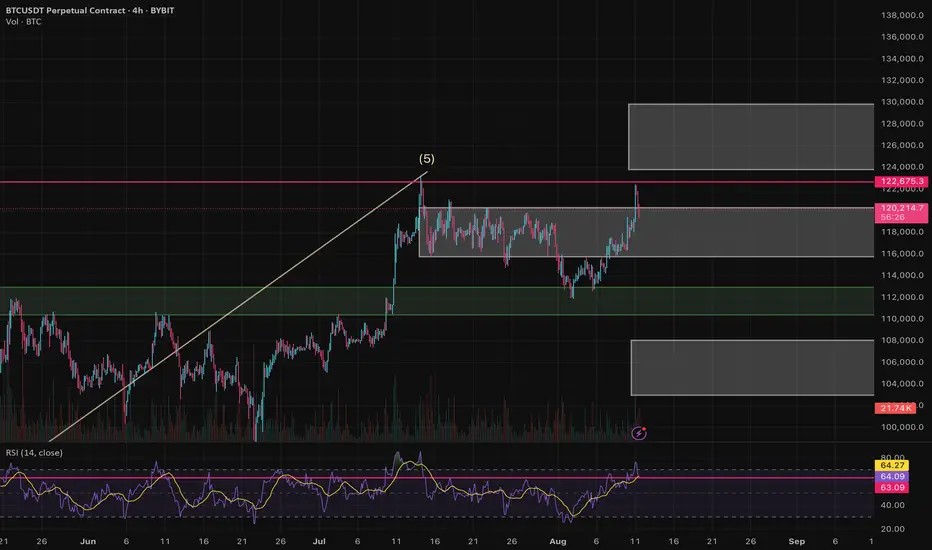
Bitcoin Resumes Bullish Momentum After CorrectionBitcoin Resumes Bullish Momentum After Correction
After reaching our initial target, BTC pulled back for a corrective move down to 118,000.
That bearish phase now appears to be complete near $118,000, with bullish momentum gaining strength once again.
Price action is currently breaking above yesterday’s high, reinforcing the upward move and adding conviction to the bullish outlook.
📍 Key Levels to Watch:
Quick target: 122,600
Extended targets (if a new all-time high is confirmed): → 126,200 → 130,000
If BTC establishes a new historical high, the probability of reaching these extended targets increases significantly.
You may find more details in the chart!
Thank you and Good Luck!
PS: Please support with a like or comment if you find this analysis useful for your trading day
