BTC - Short Update - Same Story, Flash Crash Ahead Bitcoin is respecting the same patterns as my previous analysis on this topic.
Flash crash is incoming any time now.
Be mindful of 2 wave path I laid out here.
Happy trading
- DD
Market insights


btc sellBitcoin is apparently in a downtrend, like the Nasdaq market, so it could react to the areas indicated and fall.


BTC Playbook: Harvest the Dip, Fade 87.8–89.5kMarket Overview
__________________________________________________________________________________
Bitcoin continues to drift lower beneath reclaimed HTF resistances while defending a tight 84k demand pocket; sellers keep fading bounces as we head into U.S. data with a defensive macro tone.
Momentum: Bearish-to-neutral — rallies are sold under 87,784–89,513 while 83.6–84.2k bids keep price supported.
Key levels:
- Resistances (HTF): 87,700–87,900 (720R); 89,300–89,600 (240R); 93,600–94,600 (HTF highs).
- Supports (HTF): 83,600–84,200 (1H/1D cluster + D Pivot 83,871); 79,300–80,000 (2H/12H floors).
Volumes: Normal on HTF; moderate on 1H/2H during re-tests of 87,784 and 84k.
Multi-timeframe signals: 12H/6H/4H/2H/1H trend Down; 1D shows a tactical BUY context at 84k — mixed stack that favors shorting into resistance while respecting the 84k cluster.
Harvest zones: 83,900 (Cluster A) / 79,300–80,000 (Cluster B) — ideal dip-buy areas for inverse pyramiding if a clear reversal prints.
Risk On / Risk Off Indicator context: Neutral sell — confirms the defensive regime and supports fading bounces unless 84k proves strong with breadth improvement.
__________________________________________________________________________________
Trading Playbook
__________________________________________________________________________________
Short-term trend is pressured; adopt a defensive stance: fade rallies into 87,784/89,513, consider tactical longs only at 84k with confirmation.
Global bias: Neutral sell while below 87,784–89,513; bearish bias invalidated on a strong daily close above 89,513.
Opportunities:
- Buy (tactical dip): 83,600–84,200 cluster only with a confirmed 30m/1H reversal; targets 86,000 → 87,784.
- Breakout buy: 12H close above 89,513 opens 93,600–94,600.
- Tactical sell: Fade 87,700–87,900 or 89,300–89,600 rejections with weakening momentum.
Risk zones / invalidations:
- Break below 83,871 would invalidate the dip-bounce idea and expose 79,300–80,000.
- 12H/1D close above 89,513 invalidates the short-fade bias and hands control to buyers toward 93.6–94.6k.
Macro catalysts (Twitter, Perplexity, news):
- Repo usage uptick and soft ETF flows support a risk-off tone — rallies face supply unless data turns.
- U.S. jobs release is the near-term volatility trigger; soft prints help bounces into 87,784, hot prints risk 84k breakdown.
- External dashboard: tech regime unfavorable; credit stress aligned with a defensive stance.
Harvest Plan (Inverse Pyramid):
- Palier 1 (12.5%): 83,900 (Cluster A) + reversal ≥2H → entry
- Palier 2 (+12.5%): 78,900–80,500 (-4/-6% below Palier 1) (Cluster B included) → reinforcement
- TP: 50% at +12–18% from PMP → recycle cash
- Runner: hold if break & hold first R HTF (87,784)
- Invalidation: < 83,900 or 96h no momentum
- Hedge (1x): Short first R HTF on rejection (87,784) + bearish trend → neutralize below R
__________________________________________________________________________________
Multi-Timeframe Insights
__________________________________________________________________________________
Across intraday TFs the trend is down, with supply capping bounces and demand concentrated near 84k; the 1D offers a tactical BUY only if 84k holds with confirmation.
12H/6H/4H/2H/1H: Downtrend beneath 87,784–89,513; sellers defend the MA bands and prior pivots. Key supports remain 83,600–84,200, then 79,300–80,000 if 84k fails.
1D: Tactical BUY context into 83,600–84,200 (tight 1H/1D confluence with D Pivot 83,871). A clean reversal here can squeeze to 86,000–87,784; failure opens the 79.3–80.0k magnet.
Major confluence: Tight cluster at 84k aligns with D Pivot Low; broader macro risk-off keeps upside attempts contained until 89,513 is reclaimed.
__________________________________________________________________________________
Macro & On-Chain Drivers
__________________________________________________________________________________
Macro is defensive: easier Fed rhetoric vs. near-term funding stress and soft ETF flows; risk appetite hinges on U.S. jobs.
Macro events: Repo facility usage elevated (funding stress), USD tone softer, gold remains bid above 4,300; risk assets trade data-dependent into U.S. jobs.
External Macro Analysis (dashboard): Tech regime unfavorable (master BEAR), credit risk aligned (HYG BEAR), while semis/small caps show conflicting resilience — supports a cautious, mid‑cycle stance consistent with a neutral-sell bias.
Bitcoin analysis: Spot ETF net outflow (−$357.7M daily) and muted 7d average add a macro headwind; 86.6k watched intraday, with 75k discussed as a deeper must-hold if supports give.
On-chain data: Demand softening (weak spot CVD/ETF), IV reset, >25% supply in loss; structure stabilizes above True Market Mean but remains fragile.
Expected impact: Unless data flips sentiment, macro/on-chain lean risk-off — favors fading bounces under 87,784/89,513 and waiting for a confirmed 84k reversal or a 89,513 reclaim.
__________________________________________________________________________________
Key Takeaways
__________________________________________________________________________________
BTC trades in a defensive regime: sellers cap price at 87,784–89,513 while buyers defend 83,600–84,200.
- Trend: Short-term bearish-to-neutral; fade bounces until 89,513 is reclaimed.
- Setup: Tactical dip-buy only on clear reversal at 84k; deeper buy zone stands at 79.3–80.0k.
- Macro: Risk-off tone from funding stress and ETF outflows limits upside unless U.S. data helps.
Stay nimble — treat 84k like a boss gate: confirm before entering, and respect invalidation if it breaks.

BTC/USDT | Bears in control? (READ THE CAPTION)Good day folks, hope you're doing okay.
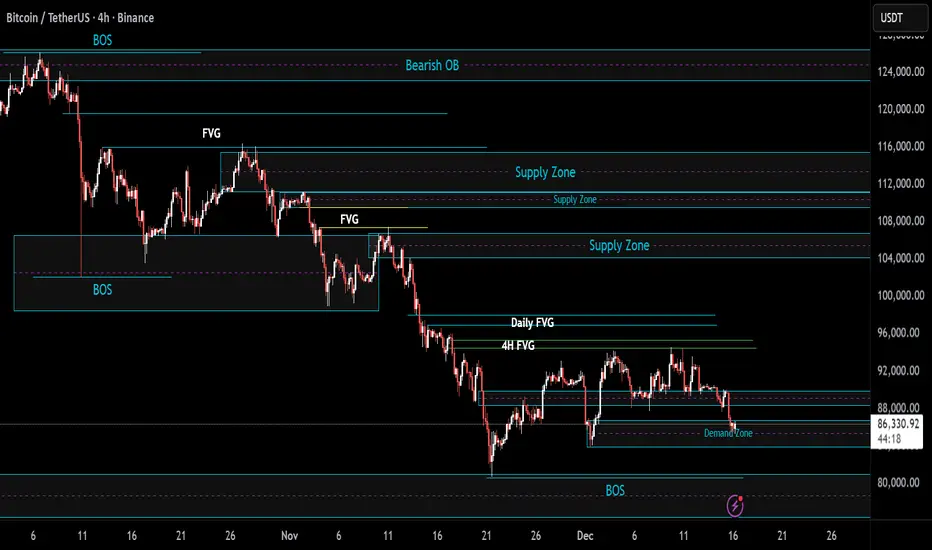
As you can see and I previously mentioned, BTC dropped to the demand zone and now it's being traded at 86,560 level.
However, it is yet to break out of the demand zone, if it fails to do so, a drop to the low of the demand zone at 83,860 is possible. If it goes up, it'll be met by the FVG at 88,350.
BTCUSDT: Bearish Drop to 84000?BINANCE:BTCUSDT is eyeing a bearish reversal on the 4-hour chart , with price forming lower highs within an upward channel, approaching resistance near cumulative long liquidation zones that could trigger downside momentum if sellers defend the levels amid recent volatility. This setup suggests a pullback opportunity after the rally, targeting lower support levels with overall risk-reward exceeding 1:4.
Entry between 91400–92700 for a short position. Targets at 87900 (first), 84000 (second). Set a stop loss at a close above 93180 , yielding a risk-reward ratio of more than 1:3.5 in total. Monitor for confirmation via a bearish candle close below entry with rising volume, leveraging the pair's channel dynamics.🌟
Fundamentally , Bitcoin has plunged below $90,000 on December 12, 2025, amid AI-related jitters dragging down Nasdaq and crypto stocks, with prices consolidating around $89,978 after a sharp fall from its $126,000 peak earlier this year. Despite a 1.9% daily crypto market cap increase to $3.23 trillion, sentiment remains cautious with fears of a price crash, as the asset oscillates in the $88,000–$93,000 range on Fed outlook but shows hourly downside after failing $92,735 resistance. Long-term forecasts eye drops to $80,000 by end-2026, with prediction markets skeptical of hitting $100,000 in 2025, though bulls maintain the uptrend for now. Bitcoin correlates with the S&P 500, which slipped today alongside Nasdaq due to AI bubble fears from Broadcom's results, potentially adding downward pressure on BTC. 💡
📝 Trade Setup
🎯 Entry (Short):
91,400 – 92,700
(Entries inside this zone remain valid with proper risk & capital management.)
🎯 Targets:
• 87,900 (first)
• 84,000 (second)
❌ Stop Loss:
A daily close above 93,180
⚖️ Risk-to-Reward:
More than 1:4 overall
💡 Your view?
Will BTC reject the 92K zone and unwind toward 84,000, or does crypto surprise with a squeeze first? 👇

BTCUSDT – Downtrend - The Market Enters a Critical TestBitcoin is losing bullish momentum and gradually shifting into a phase dominated by selling pressure. After multiple failed recovery attempts, BTCUSDT is showing clear signs of buyer fatigue as short-term capital pulls back and risk-off sentiment spreads across the market.
From a market context perspective, caution is prevailing as investors wait for key U.S. economic data. The U.S. dollar is showing signs of recovery, while Treasury yields stabilize, reducing the appeal of risk assets like Bitcoin in the short term. As a result, speculative flows have become more defensive.
On the price chart, the short-term bullish structure has been broken. Bitcoin continues to form lower highs, signaling that sellers are taking control of price action. Recent rebounds are weak and purely technical, quickly met with selling pressure—typical behavior during the early stages of a developing downtrend.
Notably, key support zones below are being gradually eroded. A clear break of these levels could trigger stop-loss cascades, accelerating the downside move. In this environment, attempting to catch the bottom carries significant risk.
From a trader’s perspective, selling on pullbacks remains the preferred strategy. Trading in alignment with the prevailing trend, maintaining strict risk management.

BTCUSDT (1D) – Cypher Harmonic Breakdown + Bearish Flag ContinuaMarket Context
Bitcoin remains in a daily downtrend following the completion of a large Cypher Harmonic structure. After the impulsive selloff from point C, price has entered a bearish flag consolidation, reinforcing the probability of trend continuation lower rather than reversal.
This is classic impulse → consolidation → continuation behavior.
Harmonic Structure Recap
XA: Strong impulsive advance.
AB: Corrective retracement (~0.58).
BC: Extension into 1.26, forming exhaustion at point C.
CD (In Progress): Expansion toward 0.786 of XC, projecting completion near $60K–$66K.
The harmonic structure provides the macro roadmap; the bearish flag provides the execution trigger.
Bearish Flag Breakdown
Flag formed after a high-momentum selloff (flagpole).
Price is consolidating inside a descending corrective channel.
Volume has contracted during consolidation — textbook bearish flag behavior.
Recent rejection from the upper boundary confirms seller dominance.
A breakdown below the flag low should trigger continuation toward the Cypher D zone.
Structure & Momentum
Market structure: Lower highs, lower lows intact.
Daily RSI:
Holding below 40
No bullish divergence present
Confirms bearish continuation bias
Prior demand levels have failed → now acting as resistance.
Trade Plan
Primary Setup: Bearish Continuation
Short Entry (Aggressive): Breakdown below flag support
Short Entry (Conservative): Pullback into $88K–$95K supply zone
Invalidation: Daily close above $95,000
Targets:
TP1: $78,000
TP2: $70,000
TP3: $60,000 – $66,000 (Cypher D completion / HTF demand)
Risk remains asymmetric to the downside while price stays below flag resistance.
Alternative Scenario
Only a clean daily close above $95K, followed by structure reclaim, would invalidate:
Bearish flag
Cypher continuation
Daily downtrend bias
Until then, all upside moves are corrective.
Conclusion
Bitcoin is aligning two high-probability bearish structures:
Cypher Harmonic continuation
Bearish flag consolidation
This confluence significantly increases the probability of a deeper corrective leg toward HTF demand. Patience favors sellers.
Bias: Bearish
Timeframe: Daily / Swing
Pattern: Cypher + Bearish Flag
Invalidation: Daily close > $95K
Target Zone: $60K–$66K

BTC 4H Range Structure With Key Breakout Levels🔥 Welcome To FireHoseReel !
Let’s dive into Bitcoin (BTC) analysis.
👀 BTC 4H Overview
Bitcoin is currently trading inside a 4-hour range, with resistance at $93,663 and support at $84,563. A breakout from this box could trigger a major move. Keep in mind that December holiday conditions, especially Christmas, are keeping overall market volume relatively low.
📊 Volume Analysis
After breaking $88,082, Bitcoin’s volume shifted into strong selling pressure, printing a large 4H sell-off candle. A renewed volume expansion could lead to another significant move and potentially push price out of this range.
✍️ BTC Trading Scenarios
🟢 Long Scenario:
A breakout above $88,082 with rising buy volume could activate a low-risk long setup (~0.25% risk). If buying pressure expands into higher timeframes, the next resistance levels are $89,807, $93,663, and $96,412.
🔴 Short Scenario:
A breakdown below the current support near $84,563, confirmed by increasing sell volume, could provide a solid short opportunity.
🧠 Protect your capital first. No setup is worth blowing your account. If risk isn’t controlled, profit means nothing. Trade with rules, not emotions.
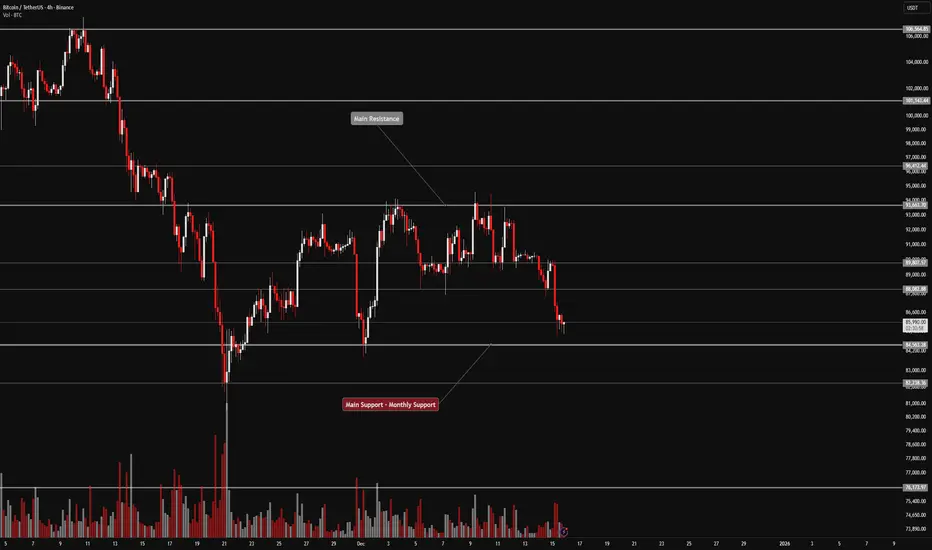
BTC/USDT: Double Top Pattern - Bearish Target $75k-$78kANALYSIS OVERVIEW
Bitcoin is showing a confirmed Double Top pattern at $108,000 level with a breakdown of the neckline around $92,000-$95,000. Current price action suggests a continuation of the bearish trend toward key support levels.
TECHNICAL STRUCTURE
Elliott Wave Analysis:
The price has dropped from $108k to $85k, representing a 21% correction. This appears to be an ABC corrective wave following the fifth wave completion at $108k.
Key Price Levels:
Resistance Zones:
R1: $90,000-$92,000
R2: $95,000-$98,000 (Broken Neckline)
R3: $100,000 (Psychological level)
R4: $108,000 (Previous ATH)
Support Zones:
S1: $82,000-$84,000 (Current range)
S2: $75,000-$78,000 (Double Top target - Strong support)
S3: $68,000-$70,000
S4: $56,000-$58,000 (Major support from previous Wave 4)
TRADING SCENARIOS
Scenario 1 - Bearish Continuation (60% probability):
Short Setup:
Entry: $88,000-$92,000 (on pullback to broken neckline)
Stop Loss: $95,000
Take Profit 1: $78,000 (R/R = 1:2)
Take Profit 2: $70,000 (R/R = 1:3)
Take Profit 3: $58,000 (R/R = 1:4)
Reasoning:
- Confirmed Double Top breakdown
- Break of market structure
- Strong selling pressure
- Multiple consecutive bearish weekly candles
Scenario 2 - Correction and Reversal (40% probability):
Long Setup:
Entry 1: $75,000-$78,000 (Medium risk)
Entry 2: $68,000-$70,000 (Lower risk)
Entry 3: $56,000-$58,000 (Lowest risk)
Stop Loss: Below $52,000
Take Profit 1: $90,000-$95,000
Take Profit 2: $108,000-$110,000
Take Profit 3: $130,000-$150,000
CURRENT MARKET STATUS
Warning: No buying recommendation at current levels. Wait for bottom confirmation.
For swing traders:
- Wait for bottoming pattern at $75k-$80k range
- Look for Hammer or Bullish Engulfing candlestick confirmation
- Confirm with increased buying volume
For long-term investors (DCA approach):
- 25% allocation at $75k-$78k
- 35% allocation at $68k-$70k
- 40% allocation at $56k-$58k
SHORT-TERM FORECAST (1-2 months):
- Primary scenario (60%): Decline to $75k-$78k
- Secondary scenario (30%): Range-bound $82k-$95k
- Alternative scenario (10%): Quick recovery to $100k
CONCLUSION
Current Signal: BEARISH
Primary Target: $75,000-$78,000
Timeframe: 2-4 weeks
Risk Management:
- Always use stop-loss orders
- Risk maximum 3-5% of capital per trade
- Wait for confirmation before entering positions
The Double Top pattern remains active until price reclaims $95,000 with strong volume. Until then, downside pressure is expected to continue toward the measured move target.

BTCUSDT Under Seller Control — Rallies Are for SELLBTCUSDT is entering a clear corrective phas e, with sellers firmly in control . In a market environment that remains risk-averse, recent news shows that risk capital is not yet ready to return to crypto , while macro pressure and defensive sentiment continue to dominate. As a result, Bitcoin lacks bullish momentum and is vulnerable to selling pressure at resistance levels.
On the H4 timeframe, the technical structure confirms that a bearish trend is forming and strengthening . Price has been rejected multiple times at overhead resistance and has broken below the Ichimoku cloud, signaling a clear loss of momentum. The descending trendline remains heavy above price, causing each bounce to be purely technical and quickly sold into.
In the short term, 86,500 acts as a key resistance zone. As long as BTCUSDT remains below this level, the preferred scenario is a continuation lower toward 82,000, where stronger support may trigger a reaction. Any upside pullbacks during this phase should be viewed as SELL opportunities within the trend , rather than early signs of a reversal.

Bitcoin (BTC): Liquidity Grabs Before Breakout | Very BullishBTC looks bullish, as the price is on the verge of forming a proper breakout here. What we are looking for is after the recent liquidity grabs, which formed some kind of triangle pattern, we are into the tight gap between the upper side and lower side of that pattern.
Which leaves us with one way only, a breakout, so that's what we look and wait for. Once we get a proper breakout where buyers secure the area, we are going to aim for a long here for sure (although the current market price is already worth a long entry in my opinion).
Swallow Academy

BITCOIN BTCUSDT DAILY CHARTTHE crypto market is looking for more selloff,the structure indicates more sell.
buyers have failed to cross a key weekly resistance which will call for the next demand floor 75k-70k zone .
tomorrow will validate the analysis ,as i expect the weekly candle to close in massive selloff.
GOODLUCK.

BTC Scalp Sell/Short Signal (30M)Price is bearish on the lower timeframe, which suggests a pullback within the higher-timeframe bullish structure to the downside in order to collect orders, before potentially moving higher.
On the lower timeframe, we have a bearish CH, and there are liquidity pools below the chart that can be swept.
Based on this setup, Bitcoin can be shorted.
At the first target, move the trade to breakeven and take partial profits.
Do not enter the position without capital management and stop setting
Comment if you have any questions
thank you

BTC (+)In the range of 85,000, it will have its last stop, although exactly the reverse of this process has occurred for the Tether market, and we must use the last opportunities to rise.

$BTC at Range Low - Bounce Expected! CRYPTOCAP:BTC range low and bullish order block are marked on the chart. Short-term bounce is expected from this area.
Keep in mind, overall trend is still bearish this move is based purely on the range base strategy.

Brainiak | Bitcoin forming corrective?After Saturday (13 Dec), we analyzed that Bitcoin could potentially continue higher, with the following key support levels identified:
- 89,000
- 88,000
- 86,000
- 84,000
At the moment, price has tested the support around 88,000 but briefly broke below the low to tap another support zone that was not previously mentioned, before bouncing back strongly. However, this rebound alone is not sufficient. Price needs to build a corrective base above the 90,000 level. If it cannot do so, then at the very least it should form a base as close to the 90,000 zone as possible in order to increase the probability of further upside continuation.
On the other hand, if price chooses to move back down to the previous support around 87,000 .. which marked the most recent low .. and then enters a strong sideways consolidation, this would almost certainly signal further downside. In that case, the support levels remain as previously outlined. The key takeaway is that the deeper the price moves down, the lower the probability of a bullish continuation .. though it does not drop to zero.

Santa Rally? Bitcoin yearly close bullwave incomingChart based on patterns , fractals.
btc will try to go up 98k+ , 98.9-108 , toward end of Dec

Bitcoin movement today . 100% works Hey guys
After a while I come with a very predictebale analyze .
Go on but when BTC arivies at 89300 . It goes up at lease 92000
have good day

Waiting for BTC to break out and recover.BTC Trading Plan – Daily Timeframe
BTC is currently in a corrective phase within a larger downtrend, but signs of a potential base formation are emerging.
Key Technical Context
Price is moving inside a descending channel / falling wedge, often a bullish reversal structure if broken to the upside.
The 93.2K level is a critical breakout line. A confirmed daily close above this level would signal a shift in short-term momentum.
The zone around 100K–102K (purple area) is a major supply / resistance, aligning with the descending trendline and EMA resistance.
Strong demand remains at 83.5K–84K, which is the key downside support.
Trading Scenarios
Bullish Scenario
Daily close above 93.2K → continuation toward 100K–102K.
A clean breakout above 102K would open the path back to higher levels and trend reversal confirmation.
Bearish Scenario
Rejection below 93.2K keeps BTC in consolidation.
Breakdown below 83.5K could trigger a deeper drop toward the 79K region.

Bitcoin (BTC): Buyers Are Holding 100EMA Under Control | BullishBuyers of BTC are still holding onto the 100EMA, where for the 5th week sellers haven't managed to secure this area at all.
What we see and what we need now is a proper MSB to form here (market structure break), which would open for us a last bullish movement for this cycle (maybe not as high as our target but definitely towards the current ATH).
Swallow Academy

Bitcoin balanceAs bitcoin is playing between the support and resistance lines, Can still hold, 88k and push up?
This is very tight now and any days from now, we could see a breakout
