BTC aiming to retest 98k to 100k Several factors coming together:
The market is very bearish in sentiment. Selling likely exhausted here and short side probably overcrowded
Daily demand is holding and displaying strong reactions
Untested Weekly gap above and untested daily supply zone are calling for a liquidity test.
Market insights

BTC/USDT | Another run over 100K? (READ THE CAPTION!)By analysing the 4H BTCUSDT chart, we can see that a fall into the FVG and dropping all the way too $87700, it has reacted positively and is now being traded at $91700!
We shall see if BTC manages to go through the daily FVG, which is the $96900-$98000 zone. If BTC goes over than zone, another run to over $100K is possible!
This analysis will be updated!

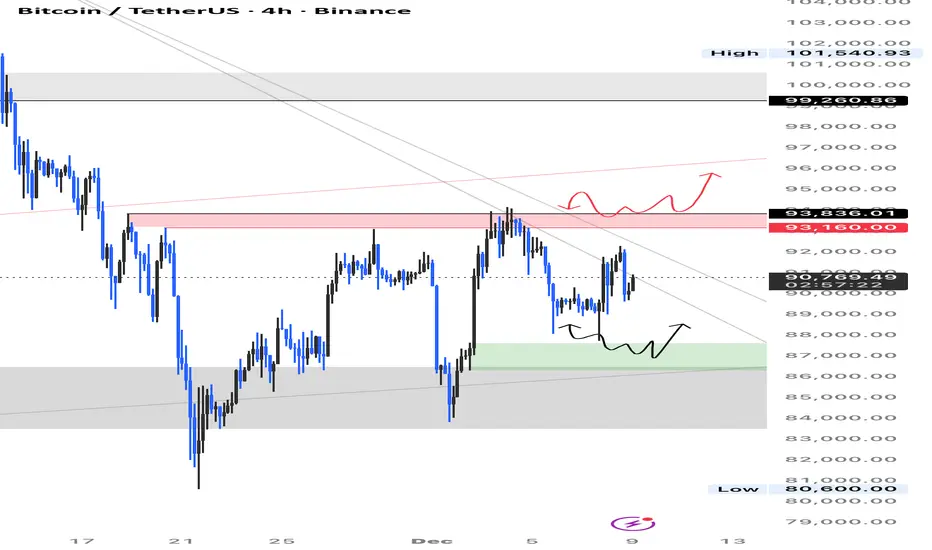
BTCUSDT Price Update – Clean & Clear Explanation✅Bitcoin is trading inside a broader downward structure, and the recent rally has reached a strong supply zone near 92,000–94,000, where sellers have stepped in again. The price reacted sharply from this resistance band, indicating that the market is still respecting the higher-timeframe bearish trend.
✅Currently, the market is showing signs of exhaustion after the latest push upward, and the price is starting to form a lower-high rejection pattern, suggesting that buyers are losing momentum. As long as Bitcoin stays below the 92,000–94,000 supply zone, the long-term outlook remains bearish.
✅If selling pressure continues, the chart supports a gradual decline toward the first target near 88,000, where a previous demand zone and trendline support meet. Breaking below that structure may trigger a deeper drop toward the second major demand zone around 83,000–84,000, which aligns with the lower boundary of the long-term descending channel.
✅Overall, unless Bitcoin breaks and holds above 94,000, the higher-timeframe structure favours a bearish continuation, with sellers aiming for lower levels over the coming sessions or weeks.
✅If If you find it helpful please like and comments for tis post and share thanks.

BTC/USD) Bearish trend analysis Read The captionSMC Trading point update
Technical analysis of Bitcoin (BTC/USDT), showing likely support/resistance zones + moving averages + a projected downside “target.” I think the analysis has merit — but it also carries risks. Here’s a breakdown of what works & what to watch out for:
---
What the analysis does well (strengths)
Use of support and resistance zones: The chart marks a “key support zone / breakout level” and a “resistance level.” That’s textbook technical analysis — horizontal zones where price has previously stalled or reversed tend to work as future decision points.
Dynamic resistance via moving averages: The chart uses EMAs (50 and 200) — those help traders spot trend direction and possible dynamic resistance/support. When price is below a major EMA (like the 200), that EMA often acts as resistance rather than support.
Clear target defined: Having a target around ~$83,783 (as drawn) gives a concrete downside level if the bearish case plays out. This is useful for planning scenarios and risk management.
Logical structure: support → breakdown → target: The idea seems to be that price broke a support zone (or tested and failed), is now below important moving averages — which supports the bearish bias. If support fails, move down toward target. That’s a valid “trend + structure” bearish setup.
---
What to be cautious about (weaknesses / risks / what’s uncertain)
Support/resistance zones are not guarantees: As described in guides for support/resistance — these zones work because many traders place orders there, but price can ignore them, especially under high volatility or news triggers.
EMAs as dynamic resistance/support are probabilistic: While 50-EMA or 200-EMA often act as resistance/support, they are not always respected — especially in volatile crypto markets.
Timeframe & context matter: The chart seems 1-hour, which means the zones and signals are relatively short-term. Levels that look robust on a 1-h chart may dissolve quickly when broader contexts (daily/weekly) shift. Many TA educators stress using multiple timeframes to confirm strong levels.
No certainty of target — market structure can change: The “target point” assumes continuation of bearish momentum. But if price action reverses, or some bullish catalyst emerges, the setup becomes invalid. This is true for any technical projection.
---
What this setup implies — possible scenarios
Bearish scenario (the chart’s base case): Since price is below both EMAs and has recently broken support, BTC could drift toward the projected target around $83,000–$84,000 if downward pressure continues, especially if sellers dominate near EMAs/resistance zones.
Invalidation / bull scenario: If BTC climbs back above the 50 and 200 EMAs, or reclaims a broken support zone, that bearish thesis fails — and price may instead bounce back toward higher resistance. In that case, the target becomes irrelevant.
Choppy / range-bound scenario: Price may hover between the support/resistance / EMA zones, bouncing up/down without reaching the target — which is common in crypto when there’s no strong directional catalyst.
Mr SMC Trading point
---
My view: Reasonable as a probabilistic bearish trade — but not a guarantee
Your chart offers a plausible bearish setup. It makes sense to watch how price interacts with the EMAs and the support/resistance zones. However: because markets are never deterministic, it’s best to treat this as one possible scenario, not a sure bet.
If I were trading this, I’d probably:
Wait for confirmation (e.g. a breakdown + close below support, or rejection at EMA) before committing.
Define risk controls: like where to set a stop-loss (maybe just above the 200-EMA or above recent consolidation), and a realistic profit target as indicated.
Monitor for catalysts (volume spikes, news) — these can up-end technical setups quickly in crypto.
---
Please support boost 🚀 this analysis

BTCUSDTBitcoin Analysis
In the previous analysis, I mentioned that every time Bitcoin corrects more than 30% from its price top, it enters a downward phase.
Although the price dropped close to $80k (36%), it didn’t establish a solid consolidation there, so our scenario is still valid. With a confirmed consolidation below the $86k–$87k range, we would officially enter a bearish phase, with the first potential target around the $74k zone.
For now, the price is being held up well, and we need to see what tonight’s interest-rate decision and Jerome Powell’s remarks will signal for the market.
It’s also worth mentioning that we are in the final month of the calendar year, and historically, this month has consistently shown stronger selling pressure in previous years.
Even though the rate cut has already been priced in, the announcement itself could still generate demand in the market — unless Powell, in his speech afterward, tries to emphasize strengthening the U.S. dollar, which could create selling pressure across markets.
Overall, tonight will give us a much clearer direction for Bitcoin’s price action, and as always, we will move in sync with the market.

btc live tradeHello friends
Given the sharp upward movement we had, you can see that the sellers have made a high, which increases the possibility of a price correction, and we can witness a price increase in the price correction until the specified targets are reached.
This analysis is purely from a technical perspective and is not a buy or sell recommendation, so please observe risk and capital management.
*Trade safely with us*

BTC: The Final RallyBTC has repeatedly dipped below $90K, presenting clear buying opportunities—and I’ve been consistently signaling to keep buying, locking in steady profits along the way. Right now, all you need to do is hold tight and wait for the final upward push.
Our first target to watch is $100K, and there’s still massive upside potential on the horizon for the longer term.
All signals have been 100% accurate for two consecutive weeks. I will keep delivering precise signals to help you lock in consistent profits.

BUY NOW BTCUSD TO 96K.....BTCUSD completed +3,500pips from my last view on it today price made a rejections off the breaker block region am looking forward to see price reclaim back to the buyside liquidity at 96k zone
JOIN AND ENJOY......

BTCUSDT — Correction Ending? Potential Bullish ContinuationAccording to signals from my custom indicator, the recent correction appears to be approaching its end.
Although the indicator itself is not shown on the chart, the analysis here is based on the same reversal conditions that it typically detects.
The market is currently holding above a key local support area, forming a potential higher low — a structure that often precedes bullish continuation. Price reacted similarly in previous cycles, where a series of higher lows led to upward momentum.
Key points of my analysis:
My custom indicator suggests that the corrective phase is weakening.
Price is stabilizing near support, showing reduced selling pressure.
Previous market swings formed similar patterns before moving higher.
A breakout above the nearest resistance zone could confirm the continuation of the uptrend.
This scenario reflects one possible outcome based on indicator-derived signals and market structure.
I will update the idea if conditions change.

BTCUSD : Technical analysis Mini Demand Zone After Bearish Comes📊 BTCUSD 30-Minute Analysis — Reversal Zone + Volume Burst Setup
1. Market Structure Overview
On the 30M timeframe, BTCUSD is currently trading inside a corrective phase after rejecting the upper resistance area around $91,000 – $92,000. The price formed a rounded-top structure, indicating a gradual weakening of bullish momentum.
The market has been moving sideways with decreasing volatility, suggesting accumulation or preparation for the next move.
2. Major Drop & Formation of Fresh Reversal Zone
A major bearish move pushed BTC down into a strong Reversal Zone (RZ) positioned around:
**🔽 Key Reversal Zone (Demand Area):
$88,000 – $87,000**
This zone is significant because:
It aligns with previous reaction level from Dec 2
Strong buy-side volume burst previously originated here
Price has already shown a wick rejection, signaling buyer interest
This is a high-probability demand area where institutions previously entered the market.
3. Volume Burst Confirmation
Inside the Reversal Zone, the chart highlights a Volume Burst area.
Why Volume Burst Matters:
Shows strong buying pressure
Indicates absorption of sell orders
Confirms demand is active at this region
If BTC revisits this zone, buyers may aggressively defend it again.
4. Expected Short-Term Movement
Your chart shows two potential scenarios:
Scenario A – Bullish Reversal (Most Likely)
Price may dip slightly into the Reversal Zone
Strong buyers react at the volume burst area
Market forms a bullish reaction candle
Break above minor consolidation leads to upward continuation
Target Levels After Reversal:
$89,800 – Pattern Completion
$90,500 – Short-Term Resistance
$91,000 – Structural High Retest
Scenario B – Bearish Breakdown (Less Likely but Possible)
If the Reversal Zone fails:
BTC may slide toward $86,500 – $85,800
This would confirm a deeper correction phase
But current PA suggests buyers are preparing a move upward.
5. Pattern Must – Confirmation Zone
A label on the chart shows "Pattern Must" around $89,500–$89,800.
This is the confirmation level where:
Break and retest = bullish continuation
Rejection = temporary sideways / deeper pullback
This acts as the neckline for a potential reversal pattern.
6. Technical Summary
Bias: Bullish from Reversal Zone
Main Support: $88,000 – $87,000 (Strong Demand)
Immediate Resistance: $89,800
Trend Outlook: Accumulation → Possible Upside Reversal
BTCUSD is currently forming a technical base, and a move upward is expected once price reacts strongly inside the Reversal Zone.
🎯 Conclusion
BTC is approaching a high-probability buying zone backed by:
Reversal Zone
Previous demand
Strong volume burst
Rounded-top breakdown structure
Market preparation for pattern completion
A bullish reversal remains the primary expectation, with targets toward $89,800 – $91,000.

Bitcoin Analysis — Pre–New York Session SetupFear & Greed Index: 22 — still in Fear.
👋 Hello Traders! Let’s dive into today’s Bitcoin analysis.
Today’s outlook isn’t very different from yesterday —
we simply have more structure, more clarity, and the market has moved deeper into our expected zones.
And since I wanted you to have this before the New York session, here we go:
📰 Weekly Outlook — No Clear Signal Yet
On the weekly chart, we’re printing something close to a Doji candle.
❓ Does this weekly candle tell us anything significant?
➡️ Not really.
The market had a sharp drop, and now it’s simply resting — completely normal.
I’ve mentioned in previous weekly scenarios that we might range until the end of the year,
and so far the market is following that exact script.
But does ranging mean no long or short positions?
❌ Absolutely not.
It simply means:
Take profits earlier
Avoid holding trades for too long
Do NOT treat mid-range setups as long-term positions
🎯 Key Higher-Timeframe Levels
Two extremely important levels remain:
$78,000
$100,000
These are the levels that can confirm a long-term trend shift (up or down).
They’re also the “heavyweight” breakout levels —
meaning:
When you’ve captured several good R/R trades,
one of them is worth leaving open in case these levels break.
Because if either level breaks, the move could be so sharp that entering afterward becomes nearly impossible.
📉 Lower Timeframe Structure
Now let’s zoom in:
Sellers are attempting to push price toward $84,000.
Two scenarios from here:
Scenario A — Strong Sell Continuation
If sellers manage to reach $84k,
the next short setup becomes straightforward:
📌 Short continuation toward $78,000
(ONLY if momentum remains strong after $84k touches or breaks).
⚠️ Scenario B — Sellers Fail
If sellers show weakness and fail to push price to $84k,
Bitcoin will likely form a range between $84k – $92k.
Inside that box,
only short-term trades make sense — no swing positions.
🚀 Bullish Scenario
If price returns upward toward $92,000,
I will personally open a long position.
🔍 4H Compression Zone — Important!
Bitcoin has created a compression structure between:
$89,000 and
$89,700
This zone is crucial.
Break upwards → I will long altcoins with bullish correlation to BTC.
Break downwards → I will short BTC or altcoins with bearish correlation to BTC.
⚠️ But only AFTER real volume enters the market.
Always track volume — it’s everything in this phase.
✔️ Final Words
Thanks for reading today’s analysis!
I hope you have a great day full of focus and profits.
And remember:
💛 Risk management isn’t optional — it’s your survival tool.
Stay safe, stay sharp, and see you in the next update! 🚀📊

BTC Trading Inside a Well-Defined RangeBitcoin continues to move inside a horizontal range with clearly visible zones used by smart money.
🔴 Distribution Zone (sells): 94,000 96,000
This area has repeatedly shown aggressive selling pressure. Smart money hunts liquidity here, taking out short stops and creating short-term reversals. As long as BTC stays below this zone, there is no confirmed bullish breakout.
🔵 Accumulation Zones (buys):
90,000 – 88,500
87,000 – 84,500
These zones show clean, consistent buyer reactions. Every deeper dip gets bought instantly — classic smart-money behavior when building positions step-by-step and defending key levels.
BTC is essentially trading between two zones of major interest.
Top = distribution.
Bottom = accumulation.
This is a typical balance phase before the market chooses a direction.
What matters now:
Price is pushing toward the top of the range without making new lows — buyers still hold the initiative.
But without a breakout above 96K, this remains a range controlled by smart money.
My focus:
Watch who takes initiative at the boundaries
Wait for either a strong breakout above 96K with volume, or a deeper test of the accumulation zones
No predictions inside the range only reacting to clear signals
For now BTC continues to trade in a structure where accumulation and distribution are clearly visible. True decisions happen at the edges.


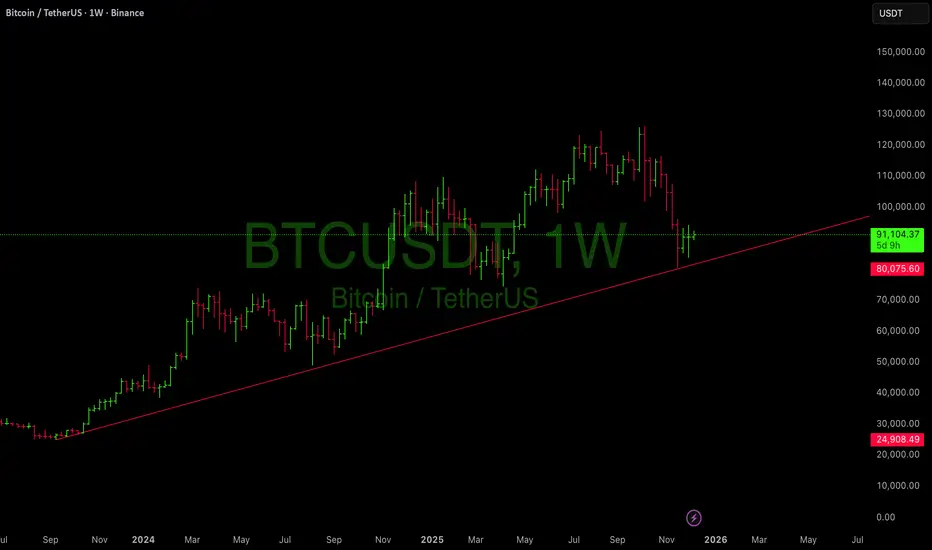
BTC – Trendline Retest Success | Momentum Reloading for Next LegBitcoin just completed a clean retest of its multi-year rising trendline, a structural level that has guided institutional accumulation since 2023. Price wicked below, tagged liquidity, and closed back above a classic bullish deviation → reclaim.
This type of structure historically marks the end of corrective phases and the beginning of new expansions.
📌 Key Bullish Factors
1. Long-Term Trendline Respect
Your chart shows a trendline starting from late 2023.
Price tapped it perfectly and is now holding above $80,000–$82,000, confirming:
Buyers stepped in where they were supposed to
Smart money defended the bullish structure
Heavy liquidation likely cleared weak longs
2. Weekly Candle Structure Turning
The last 2–3 weekly candles show:
Downward momentum slowing
Smaller bodies
Long wicks → buying from lower levels
A potential swing low forming at the trendline
Bitcoin is showing the early signs of seller exhaustion you typically see before a weekly reversal.
---
👉 The move tends to trap sellers before a strong leg up.
---
📈 Upside Targets (Weekly)
If BTC continues holding above trendline:
1. $98,000 – $102,000
→ First major liquidity pocket / inefficiency
2. $112,000 – $120,000
→ Prior breakdown zone + weekly imbalance
3. $135,000 – $150,000
→ Trend extension target / potential new ATH expansion
These are not promises they are structural destinations based on the weekly map.
---
## **🔻 Downside Invalidation**
The bullish thesis remains valid as long as Bitcoin doesn’t close a weekly candle below $80,000.
Break + close below would open deeper retracement into mid-70Ks.
But right now? The trendline holds strong.
---
🧠 Holistic Trader Insight
Institutional players accumulate on weakness, not strength.
When retail panics, smart money buys structure.
This entire move fits the textbook rules:
Trend intact
Liquidity swept
Structural level reclaimed
Momentum slowing into support
This is what early expansion phases look like.
BITCOIN BULLISH NOW!BTCUSDT continues to maintain a strong bullish structure after confirming a clean Bullish CHoCH and multiple Bullish BOS signals. Price is now approaching our last buying zone (if price breaks this zone then the trend will reverse from uptrend to downtrend) at $91,200–$90,700, which remains the key area to watch.
If BTC holds this zone and shows bullish rejection, upside targets at $93,100 and $95,000 come into play as marked on the chart.
However, a break below $89,890 would invalidate the setup and signal a deeper correction.
This zone will decide whether BTC continues its bullish momentum or pulls back for further accumulation.
Always manage your risk wisely when trading volatile markets.
For more in-depth analysis, don’t forget to like and comment.

My view
***Price will drop to the green line.** That’s my key support level.
* **Then it will bounce back up.** I expect a reversal after touching that green line.
***The overall trend is still up.** The big white uptrend line at the top shows the main direction hasn't changed yet.
***It’s a pullback, not a crash.** This dip to the green line is just a normal correction before the next move higher
$BTC: Red Box Breakout Awaited! CRYPTOCAP:BTC is still following our plan with no changes. As expected bounced from marked demand area and is still trading within the range. I hope that once red box breaks out, we’ll finally see some good movement in both #alts and $BTC.
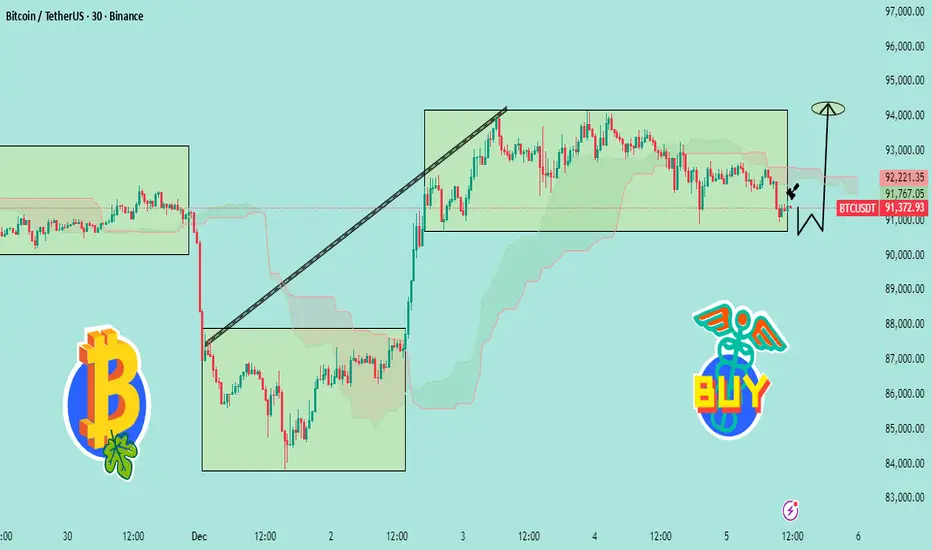
“BTC Bounce From Demand Zone – Targeting 94K Next📊 BTCUSDT Analysis (Based on Your Chart)
1️⃣ Price is Still Respecting the Range
Bitcoin is trading inside a wide consolidation box (around 91,000 – 93,000).
The recent drop tapped the bottom of the range, showing a clean liquidity sweep.
That wick below the box = fake breakdown → bullish signal.
---
2️⃣ Strong Reaction at Demand Zone
The chart shows BTC touching the demand/support zone, followed by a small bullish reaction (the black arrow).
This suggests:
Sellers failed to break lower
Buyers are stepping in exactly where expected
Market preparing for a reversal bounce
---
3️⃣ Expected Move (Your W Pattern Idea)
The drawn “W-shape” indicates a double bottom setup.
If the bottom holds around 91,000, BTC can push back toward:
🎯 Target: 93,500 – 94,000
This matches the upper boundary of the consolidation.
---
4️⃣ Bullish Scenario
If BTC holds above 91,000–91,300:
Reclaim mid-range
Break through resistance
Continue toward 94,000+
This aligns with the “BUY” tag you added.
---
5️⃣ Bearish Invalidations
Bullish idea is invalid if: ❌ Price closes below 90,800 on 30-minute
= fresh breakdown → deeper correction
---
🧠 Summary
BTC swept liquidity at the support → formed a bounce → still inside range → bullish reversal expected toward 94K
Weekly crypto review: BTC macro + short-term bearish lookBitcoin Bitcoin is closing its second consecutive week below the 50-week moving average. Throughout this growth cycle (since the 2022 lows), price has always found support at these levels.
Chart:
Historically, closing below this level for more than two weeks in a row has almost always marked the start of a macro-correction cycle or ‘crypto winter,’ rather than just a standard drawdown.
Chart:
On RSI:
The Weekly RSI, which maintained an uptrend throughout 2024 and almost all of 2025, decisively broke its long-term support line in November. As long as RSI remains above the support line, the bullish cycle structure usually holds; however, a downward breakdown often coincides with the completion of a growth phase.
Chart:
The combination of these two signals—dropping below the 50-week average and the RSI support breakdown—sharply increases the probability that the market has already entered a macro-correction phase. In my view, the probability of this scenario is currently over 80%.
On 200W MA
In all past cycles, the final Bitcoin bottom formed specifically around the 200W MA. Currently, this sits near 66k, and by mid-2026, it could rise to the 73–75k range, fitting a scenario of a further 15–20% decline from current levels.
Chart:
Expectations for the week:
I see potential for another correction wave as long as price remains below 93k. In the coming days/week, it is logical to expect a bounce (already in progress) toward this resistance zone; however, without sustained consolidation above it, the risks of another drop toward 75–70k remain high.
Chart:
If the market does test the 75–70k zone, a local bottom may form there, triggering a powerful bearish rally toward the falling 200-day average. This is the ‘dead cat bounce’ scenario with potential upside of around +40%, typically used to regroup positions in the middle of a bearish phase

BTC TO 61K Keep Eyes on Bitcoin 👀👀🤑
BINANCE:BTCUSDT BTC Making a bearish flag on 1D frame
Just keep your Eyes on it
====================================
we will entry (short) After breakout the flag
Entry Level : 88k
Target 1 : 80K
Target 2 : 74k
Target 3 : 61K
SL: 98.25K
===================================
I think Bitcoin will be very bearish in 2026, and we will see prices below 60k! It looked like sci-fi a few weeks ago, but this idea of 60k Bitcoin seems to be real.
Make sure you Follow me to see the market from another angle ❤️🕊️👌

BTC/USDT: Bulls Defend 89K as Price Eyes 96K ResistanceBTCUSDT is holding firm above its ascending trendline after defending the 89,000 support zone, preserving the broader bullish structure. The recent dip swept short-term liquidity before buyers re-entered, signaling a corrective move rather than a full reversal.
As long as price stays above 89,000, BTC has room to climb toward the 96,000 resistance zone near the weekly high. Continued higher lows and trendline respect favor upside, with consolidation phases adding strength to the bullish case.
➡️ Primary scenario: higher lows hold → continuation toward 96,000 resistance area.
❗️ Risk scenario: a break below 89,000 would invalidate the bullish setup and shift focus toward deeper support zones.

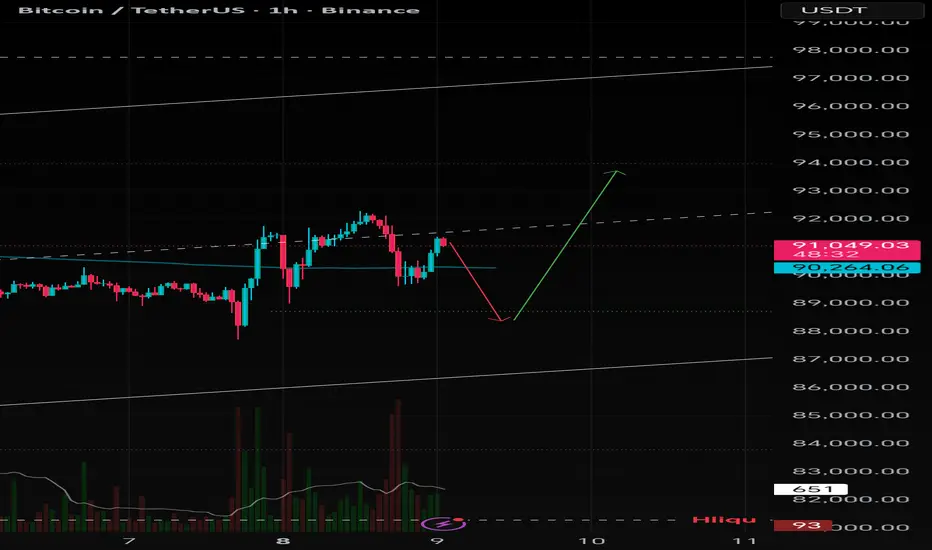
#BTC/USDT is currently strongly bullish#BTC
The price is moving in a descending channel on the 1-hour timeframe. It has reached the lower boundary and is heading towards a breakout, with a retest of the upper boundary expected.
We are seeing a bearish trend in the Relative Strength Index (RSI), which has reached near the lower boundary, and an upward bounce is expected.
There is a key support zone in green at 88200, and the price has bounced from this level several times. Another bounce is expected.
We are seeing a trend towards stabilizing above the 100-period moving average, which we are approaching, supporting the upward trend.
Entry Price: 88900
First Target: 90000
Second Target: 91123
Third Target: 92300
Remember a simple principle: Money Management.
Place your stop-loss order below the green support zone.
For any questions, please leave a comment.
Thank you.

How to choose what to invest inHow to choose what to invest in: a practical checklist for traders and investors
Many beginners start with the question “What should I buy today?” and skip a more important one: “What role does this money play in my life in the next years?”
That is how portfolios turn into random collections of trades and screenshots.
This text gives you a compact filter for picking assets. Not a magic list of tickers, just a way to check whether a coin, stock or ETF really fits your time horizon, risk and skill level.
Start from your life, not from the chart
Asset selection starts before you open a chart. First, you need to see how this money fits into your real life.
Three simple points help:
When you might need this money: in a month, in a year, in five years.
How painful a 10, 30 or 50 % drawdown feels for you.
How many hours per week you truly give to the market.
Example. Money is needed in six months for a mortgage down payment. A 15 % drawdown already feels terrible. Screen time is 2 hours per week. In this case, aggressive altcoins or heavy leverage look more like a stress machine than an investment tool.
Another case. Ten-year horizon, regular contributions, stable income from a job, 30 % drawdown feels acceptable. This profile can hold more volatile assets, still with clear limits on risk.
Filter 1: you must understand the asset
First filter is simple and strict: you should be able to explain the asset to a non-trader in two sentences.
The label is less important: stock, ETF, coin or future. One thing matters: you understand where the return comes from. Growth of company profit. Coupon on a bond. Risk premium on a volatile market. Fees and staking rewards in a network.
If your explanation sounds like “price goes up, everyone buys”, this is closer to magic than to a plan. Better to drop this asset from the list and move on to something more clear.
Filter 2: risk and volatility
The market does not care about your comfort. You can care about it by choosing assets that match your stress level.
Key checks:
Average daily range relative to price. For many crypto names, a 5–10 % daily range is normal. Large caps in stock markets often move less.
Historical drawdowns during market crashes.
Sensitivity to events: earnings, regulator news, large players.
The sharper the asset, the smaller its weight in the portfolio and the more careful the position size. The same asset can be fine for an aggressive profile and a disaster for a conservative one.
Filter 3: liquidity
Liquidity stays invisible until you try to exit.
Look at three things:
Daily traded volume. For active trading, it is safer to work with assets where daily volume is many times larger than your typical position.
Spread. Wide spread eats money on both entry and exit.
Order book depth. A thin book turns a big order into a mini crash.
Filter 4: basic numbers and story
Even if you are chart-first, raw numbers still help to avoid extremes.
For stocks and ETFs, it helps to check:
Sector and business model. The company earns money on something clear, not only on a buzzword in slides.
Debt and margins. Over-leveraged businesses with thin margins suffer in stress periods.
Dividends or buybacks, if your style relies on cash coming back to shareholders.
For crypto and tokens:
Role of the token. Pure “casino chip” tokens rarely live long.
Emission and unlocks. Large unlocks often push price down.
Real network use: transactions, fees, projects building on top.
Build your personal checklist
At some point it makes sense to turn filters into a short checklist you run through before each position.
Example:
Time. I know the horizon for this asset and how it fits my overall money plan.
Risk. Risk per position is no more than X % of my capital, portfolio drawdown stays inside a level I can live with.
Understanding. I know where the return comes from and what can break the scenario.
Liquidity. Volume and spread allow me to enter and exit without huge slippage.
Exit plan. I have a level where the scenario is invalid and levels where I lock in profit, partly or fully.
Connect it with the chart
On TradingView you have both charts and basic info in one place, which makes this checklist easier to apply.
A typical flow:
Use a screener to find assets that match your profile by country, sector, market cap, volatility.
Open a higher-timeframe chart and see how the asset behaved in past crashes.
Check liquidity by volume and spread.
Only then search for an entry setup according to your system: trend, level, pullback, breakout and so on.
Before clicking the button, run through your checklist again.
Common traps when choosing assets
A few classic traps that ruin even a good money management system:
Blindly following a tip from a chat without knowing what the asset is and why you are in it.
All-in on one sector or one coin.
Heavy leverage on short horizons with low experience.
Averaging down without a written plan and clear risk limits.
Ignoring currency risk and taxes.
This text is for educational purposes only and is not investment advice. You are responsible for your own money decisions.
