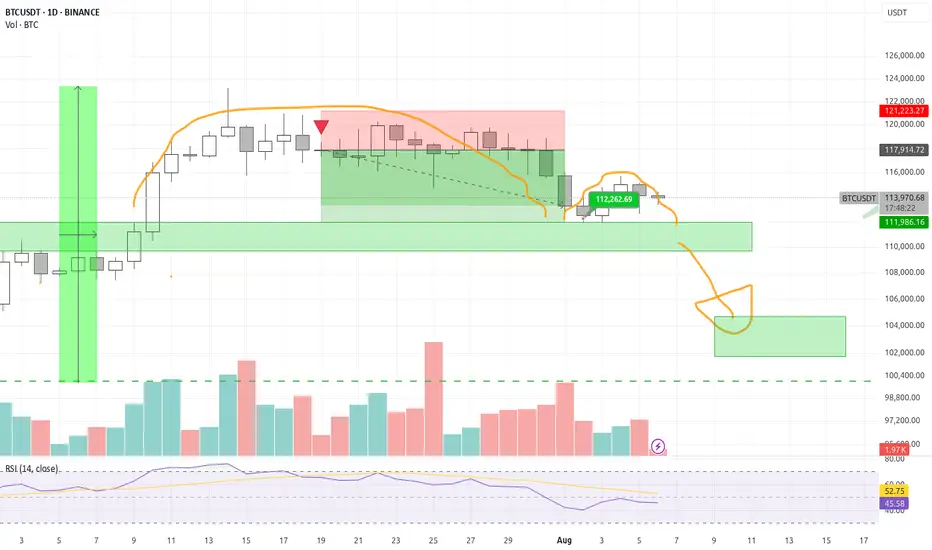
BTC/USDT 4H: Bullish Above EMAs — Watch $108k/$100k/$88k SupportTechnical Breakdown
Trend & Price Action: The overall trend remains bullish. The price is currently holding strong above the primary EMA cluster after a significant run-up, indicating buyer control.
Immediate Dynamic Support: The cluster of EMAs around $117,000 - $118,500 serves as the most immediate, dynamic support zone. The price holding above this area is critical for short-term bullish momentum.
RSI: The RSI at 62.15 confirms healthy bullish momentum with room to move higher before reaching overbought conditions.
Key Levels to Watch
Horizontal Support Zones:
These levels are critical as they represent previous areas of resistance and consolidation that have now likely flipped to support.
Support 1: ~$110,000: This level acted as a ceiling in late June and is the first major horizontal support to watch during a pullback.
Support 2: ~$100,372: This was a key consolidation zone in early June.
Support 3: ~$88,765: This is a major structural level, acting as a peak in April and providing support in late May. It represents the most significant of the three drawn support lines.
Resistance:
The upside targets remain the recent highs, identified by the indicator as:
$121,163
$122,223
Potential Scenarios
Bullish Continuation: The price remains above the EMA cluster and pushes through the $122,223 resistance. This would signal a strong continuation of the uptrend.
Corrective Pullback: If the price breaks down through the immediate EMA support, the market will look for a reaction at the key horizontal levels.
A minor correction would find support near $108,000.
A deeper correction would target $100,372, and in a major bearish shift, the crucial support at $88,765 would be the last line of defense for the current market structure.
Conclusion: The short-term outlook is bullish while the price stays above the EMAs. However, the support lines at $108k, $100k, and $88k are the most important levels to watch to gauge the severity of any potential pullback and the overall health of the uptrend.
BTCUSDT trade ideas

Liquidity Grab Long Setup with Fib Rejection and Head & ShoulderThought Process:
- Identify rejection at 0.618 Fib as a potential trend reversal signal.
- Map out major liquidity pools where stop-loss clusters are likely.
- Expect market makers to push price into these pools to collect liquidity.
- Plan a long entry immediately after liquidity grab for a possible bounce.
- Watch for bounce to align with right shoulder completion in Head & Shoulders pattern.
- Use neckline as the main resistance and decision point for next move.
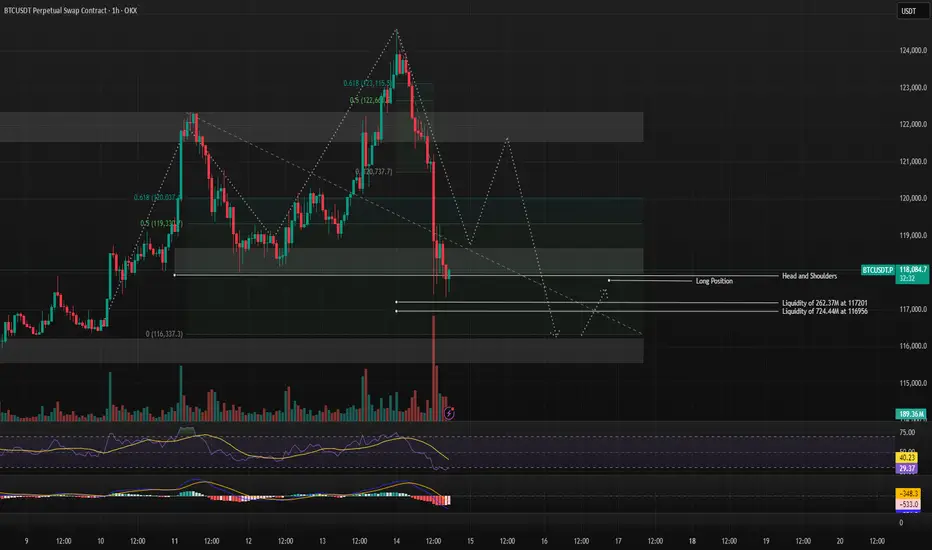
Blessed RT-Tool 3.0 Fib levels give me goosebumps everytime yeaaaah. 2% risk for 11% return.
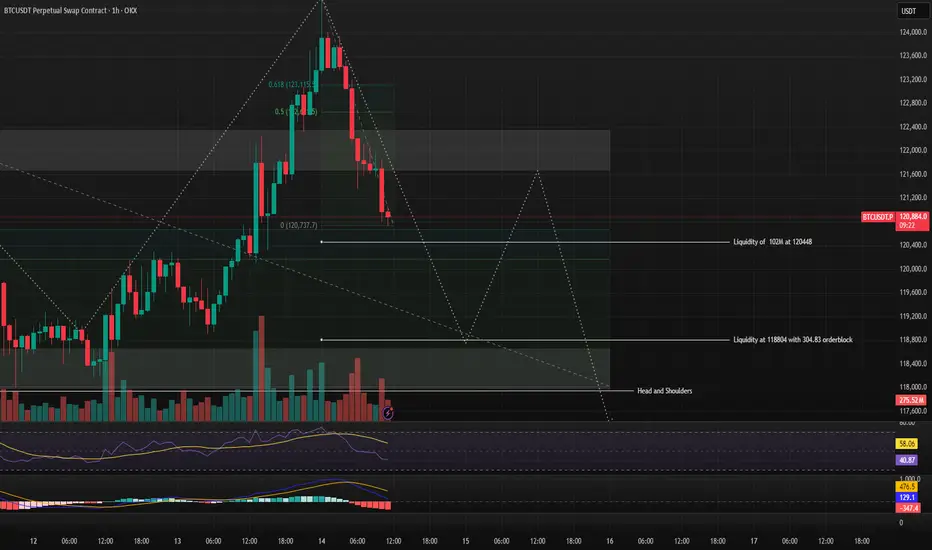
Alright I think i can give a good statement about btc here right now. I like this patterrn what we see here but usually I see this not at ATH territories. But anyway, its possible that the bottom is in. What we need to see now is a S1S2 pattern to form. this will increase the likelyhood heavily to pressure higher for price discovery. If not we will quickly find out. Only liq grabs right now would be allowed for the idea to manifest. everything else would invalidate this

Short BTCBTC (4H) — post-breakdown short. Price lost the rising structure and the long up-trendline, then failed a retest into a heavy confluence zone (Fib 0.382–0.5 at 119,783–118,384 plus supply under ~120k–121.6k). Market is now printing lower highs/lows toward Fib extensions 1.272 → 1.414 → 1.618 at 108,629 → 106,849 → 104,293. Invalidation on a sustained reclaim of 121.6–122.1k.
What your image shows, step by step
Timeframe & instrument: BTCUSDT Perpetual, 4-hour (Bybit).
Structure break: A steep, dashed rising channel/wedge into the local high was impulsively broken. That drop also cut through the green diagonal up-trendline, turning it from support into resistance.
Failed retest (confluence): Price bounced back only to stall below a tight cluster:
Fib 0.382 @ 119,783 and 0.5 @ 118,384,
the prior up-trendline (now resistance),
and the 0.236 @ 121,613 just above.
This is classic “break → retest → reject.”
Trend now: Clear lower highs and lower lows with an accelerating, dotted descending channel guiding the move.
Targets marked on your chart:
First support/target around the prior range base (~112,038), then
Fib extensions: 1.272 = 108,629, 1.414 = 106,849, 1.618 = 104,293 (blue line).
There’s even a deeper extension labeled near ~99,600 if momentum overshoots.
Trade box (your R:R):
Entry region: ~118.3k (post-retest failure).
Stop/invalid: 121.6–122.1k (red box, above 0.236 and supply).
Profit zone: down to ~104.7–104.3k (green box near 1.618).
That’s roughly a 3.5–4R idea to the main target.
Why BTC looks weak here (the logic behind the short)
Loss of key structure: Breaking a steep wedge and the major rising trendline, then failing to reclaim it, shifts control to sellers.
Bearish retest at resistance: The rejection happened where multiple resistances overlap (trendline + Fib 0.382/0.5 + supply under ~120–122k). Confluence rejections are high-quality short triggers.
Momentum & market structure: The sequence after the break is a textbook impulsive leg down → shallow bounce → continuation, confirming a down-trend on 4H.
Clear, mechanical targets: With the prior range supports gone, Fib extensions (1.272/1.414/1.618) provide objective downside magnets—exactly the levels you’ve plotted.
Asymmetry: Tight invalidation just above ~122k versus multi-thousand-dollar downside to ~108k/106k/104k creates attractive risk/reward for a tactical short.
How to read/defend the setup (concise playbook)
Bearish while: Price stays below 118.4–119.8k and can’t close back above the broken trendline.
Invalidation: Sustained reclaim above 121.6–122.1k (back inside the red box and above 0.236) = idea is wrong; flatten.
Take-profit ladder: 112.0k → 108.6k → 106.8k → 104.3k (move stops down as each level tags).
Bonus confirmation (if you want it): Another lower-high under ~120k or a clean 4H close below 116.8k (Fib 0.618) often accelerates the move.
Not financial advice—just a precise explanation of your chart and the short thesis it supports.

BTC long - Tap into demand zone in golden pocket and flydemand zone tapping and then reverserino.
Fib retracement tools are good when you combine them with fvgs

Fibonacci Golden Pocket Reversal Strategy with Liquidity TargetsA confluence-based liquidity grab and reversal strategy using Fibonacci retracement, liquidity pools, and chart patterns to forecast high-probability reversal zones.
The thought process:
- Identify swing high & low → plot Fib retracement.
- Watch for price reaction in the 0.5–0.618 zone (golden pocket).
- Confirm with nearby liquidity pools (where price is likely to be attracted before reversal).
- Add extra confirmation from patterns (like Head and Shoulders).
- Plan for short entries if bearish confluence aligns, or long entries if bullish.
BTC 1H Analysis – Key Triggers Ahead | Day 8💀 Hey , how's it going ? Come over here — Satoshi got something for you !
⏰ We’re analyzing BTC on the 4-hour timeframe , Bitcoin is pushing toward its all-time high with a massive, high-volume whale candle .
👀 After breaking through its resistance zones, Bitcoin surged toward its ATH but faced rejection and selling pressure near that level. Key potential support areas are the 25 and 99 moving averages, marked in yellow and sky blue on the chart. The 25 MA is close to the 0.61 Fibonacci level, around $118,000, and is moving toward the average of the last 25 candles. A reaction to this moving average could indicate whether Bitcoin will rebound or drop further .
⚙️ Bitcoin’s key RSI zone is at 55.25, which corresponds to the $118,000 range. Breaking below this could push RSI under 50 .
🎮 Fibonacci retracement drawn from the breakout and pullback of the V-pattern shows that the 0.13 and 0.23 levels failed under selling pressure, sending BTC toward lower support levels. The current support based on Fibonacci is at 0.37. If this is lost, BTC could range on the 4-hour chart between 0.37 and 0.61 .
✉️ Tomorrow at 8:30 AM New York time, the official CPI (Consumer Price Index) report will be released by the U.S. Bureau of Labor Statistics. This news can significantly impact the crypto market — if inflation decreases, purchasing power rises , and Bitcoin could set a new all-time high .
🕯 BTC trading volume and activity are strong in both directions. Each price surge is followed by a quicker consolidation, and corrections occur under selling pressure .
🔔 An alert zone is set at the 0.13 Fibonacci level to observe price behavior when it reaches that point, then decide on the best course of action .
📊 A break below Tether dominance at 4.10% would signal a long position on BTC, while a break above 4.20% could lead BTC into a deeper correction .
🖥 Summary : Tomorrow’s CPI news could spark large, powerful candles and potentially a new ATH for Bitcoin. If U.S. inflation increases, stronger selling pressure is possible. There’s no specific trigger for this current level, but breaking 0.13 will prompt me to open a position — or at least take trades on altcoins with a bullish correlation to Bitcoin .

BITCOIN to 160kBitcoin appears to have an inverted Head & Shoulders pattern and has broken the neckline. It's now rising, targeting 160k, which aligns with the top of the rising channel.

BTC - ath retest soonBitcoin has recently broken its previous market structure on the 1-hour chart, confirming bullish momentum and opening the door for further upside. This breakout, supported by price action staying well above the Alligator moving averages, suggests strong buying pressure is in play. With the RSI currently around 64, there is still room before overbought conditions are reached, leaving space for additional upward movement.
I suggest opening a long position from the current market price, targeting the previous all-time high at $123,145 This level represents a key resistance point where price could face selling pressure, making it an ideal take-profit zone. The stop loss is placed below the recent structural $120,000 to protect against false breakouts. This setup offers a favorable risk/reward ratio of 3.6, meaning the potential upside significantly outweighs the downside risk. As long as the bullish structure holds, I expect Bitcoin to test the ATH in the coming sessions.

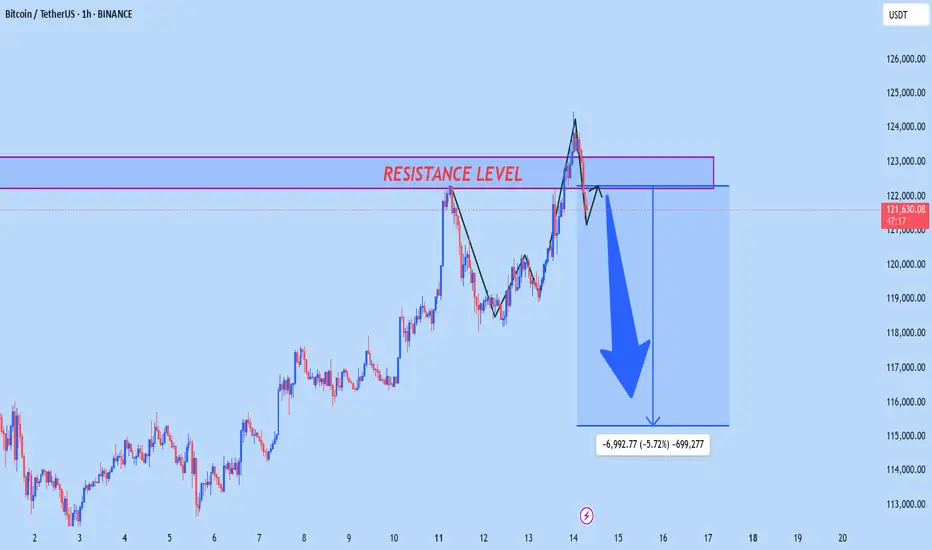
BTCIUSD OUTLOOK According to H1 anaysis btcusd market is in flying pressure now it will be touch the RESISTANCE LEVEL and it will be falling from there so if you are intersted the go short from resistance it is best for you
TRADE AT YOUR OWN RISK
Bitcoin Hits a New All-Time High · $200,000 in SightExactly 30 days after the last peak, Bitcoin hits a new all-time high. The entire cryptocurrency market is about to explode and go wild. The altcoins market will blow up because when Bitcoin grows, the entire market follows.
Market conditions are perfect and trading volume is rising today. Bitcoin is doing what is used to do, what it always does and likes to do best, appreciating.
One Bitcoin today is worth $123,500 US Dollars, wow! Amazing.
So much, so fast, amazing growth.
Bitcoin is not only a means of exchange, a store of value but also the backbone of the cryptocurrency market. Bitcoin is the infrastructure. It is the base on top of which everything revolves.
The market continues to evolve and many cryptocurrencies are in no way related to Bitcoin, but Bitcoin sets the stage, the sentiment, the pace, the value and the price. Bitcoin is the standard.
We are having a nice week with many classic signals showing up. The week is great but started red, classic. After a small drop the action recovers and see where we are at today. Only higher, moving higher, prices going up.
Prepare for a major rise, this is only the start.
Bitcoin is set to hit a target of $155,000 followed by $209,000.
Thank you for reading.
Namaste.

BITCOINBITCOIN, My hunter mindset strategy wont allow me to give a buy or sell position at the moment, allow the price to give a clear breakout out otherwise you will be caught in a bad trade.
we have conflicting signals ,we have buy and sell signal without confirmations, the strategy is based on risk to reward ratio and the probability of buy back is poor after the selloff from the supply roof which could put long position in danger.
and if you try to sell ,the price action is resting on daily support floor of the descending daily trendline breakout which gave birth to the current all time high.
ALLOW THE MARKET TO GIVE A DIRECTION.
NO TRADE FOR NOW.
HUNTER MINDSET
GOOD LUCK

BTC | Long Idea – All-Time Highs LoadingBTC | Long Idea
📊 Market Sentiment
Overall sentiment remains bullish, supported by expectations of a 0.25% rate cut in the upcoming FOMC meeting. A weakening USD and increasing global risk appetite are providing favorable conditions for further upside in crypto assets.
📈 Technical Analysis
Price formed a 4H demand zone and immediately retested it, showing a strong bullish reaction.
That retest offered a perfect entry, but there’s still potential for another move back to the demand zone before pushing higher.
The 1H swing low liquidity sits in confluence with both the 4H demand zone and the 0.5 Fibonacci retracement level — a strong triple confluence.
This alignment occurs around the $120,000 level, making it a key watchpoint.
📌 Game Plan
Wait for price to revisit the 4H demand zone.
Look for a sweep of the 1H swing low liquidity.
See the 0.5 Fibonacci level tapped for maximum discount before continuation.
🎯 Setup Trigger
Look for a 1H market structure break after price taps the $120,000 confluence zone.
📋 Trade Management
Stoploss: Below the 1H swing low that confirms the break of structure.
Target: Direct push towards all-time highs at $123,300.
💬 Like, follow, and comment if you find this setup valuable!
Disclaimer: This is not financial advice. The content is for informational and educational purposes only and reflects personal opinions.


BITCOIN THE price action is not looking good for buyers ,after the early rejection from the supply roof. ,but at the moment the demand floor on 4hr is broken and we will watch for the ascending trendline connecting from may 2025.
stay cautious of the current position ,until we have a clear breakout for forward guidance ,we can go up or down .
wait for clarity
manage your risk and capital
#bitcoin

BTC accumulation, cash flow through altcoin💎 MIDWEEK BTC PLAN UPDATE (August 13, 2025 )
1. Market Structure & Wave Pattern
The chart is applying the Elliott Wave theory with a completed 5-wave upward structure (1 → 5) and is currently correcting in an ABC pattern.
The current zone is in corrective wave C, with a likely retest of a key support area before bouncing back upward.
2. Key Price Levels
• Short-term resistance: 120,500 – 120,700 (previous breakout zone).
• Nearest support: 118,800 – 119,000 (EMA34 zone + retest of the broken downtrend line).
• Stronger support: 117,500 – 117,800 (EMA200 zone + long-term trendline).
• Major resistance above:
• 122,770 (Fib 2.618, short-term take-profit zone).
• 127,260 – 127,480 (Fib 3.618, strong resistance zone).
3. EMA & Trend
• EMA34 (gold) is above EMA89 and EMA200 → medium-term trend remains bullish.
• EMA200 (red) acts as dynamic support during the correction.
4. Trend Outlook
• Main scenario: Price may continue corrective wave C toward 118,800 – 119,000, possibly testing deeper at 117,500 – 117,800, then sharply rebound in line with the main trend toward targets at 122,770 and 127,260+.
• Alternative scenario: If the 117,500 support breaks, the short-term bullish structure will be invalidated, and BTC could retreat to 115,800 – 116,000 before recovery signals appear.

BTC 1H Analysis – Key Triggers Ahead | Day 12💀 Hey , how's it going ? Come over here — Satoshi got something for you !
BINANCE:BTCUSDT
⌛ On the 1-hour Bitcoin timeframe, we can see that the trend has shifted from bullish to a deep correction. The reason for this move was the release of higher-than-expected Producer Price Inflation, influenced in part by Trump’s tariff policies. As a result, the likelihood of an interest rate ( CPI) cut has decreased — which is not particularly favorable news for the market.
👀 After forming a new all-time high, Bitcoin faced heavy selling pressure and a sharp rejection, pushing it towards support levels. The current key support for Bitcoin is at $117,200, which could attract market makers (buyer entries). The next support is likely around $115,000.
🎮 Fibonacci levels have been drawn from a higher low to Bitcoin’s all-time high. The most important levels are $117,200 and $119,800. A breakout above or below these levels could provide potential long or short trading opportunities.
⚙️ On the RSI, the key resistance zone is at 35.88. Historically, each time the RSI has reached this level, Bitcoin has reacted strongly. A rejection here could lead to a deeper correction, while a breakout above it could trigger upward momentum.
🕯 Both trading volume and the number of transactions are increasing, but selling pressure is leaving increasingly “red” candles. This rise in volume could be a useful signal for planning entries.
🔔 There’s no specific alarm zone today since Bitcoin is in a phase of uncertainty, and the exact reason for the market’s drop has not yet been fully absorbed.
CRYPTOCAP:USDT.D 📈USDT.D has broken a strong resistance level and is now moving toward its next resistance .
🖥 Summary: Trump’s tariffs have fueled higher producer inflation, reducing the chances of a rate cut. Bitcoin’s critical support is at $117,200; if this breaks, the price could move towards lower levels.
❤️ Disclaimer : This analysis is purely based on my personal opinion and I only trade if the stated triggers are activated .

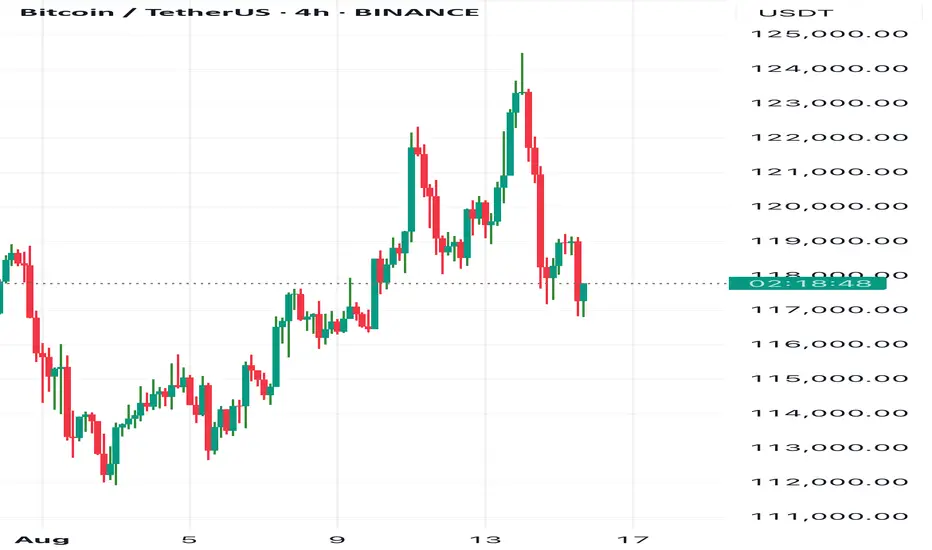
Bitcoin Possible SenarioIt seems that the bullish trend is weakened. The RSI shows divergence both in weekly and daily timeframes. Buyers needs to be careful at 110K level. Break under 110K can bring sellers into the game!

A clear head and shoulders pattern on Btc 4 h A clear head and shoulders pattern is forming on Btc 4 h
If price dropped below 117 k I guess it can continue falling until 114-113
Trade carefully
BTCUSDT_M_011 Post Halving BreakoutThe recent U.S. presidential election, won by the Trump/Vince camp, has sparked a wave of optimism in the digital asset space, signaling a promising future for cryptocurrencies. The election results triggered a strong market reaction, with Bitcoin experiencing a significant price surge, breaking out of a multi-month accumulation phase. November was particularly remarkable, with Bitcoin closing the month with a massive $25,000 green candle—the largest monthly gain in its history.
Currently, Bitcoin’s circulating supply stands at approximately 94%, or around 19.8 million coins, translating to a market capitalization of roughly $1.9 trillion. Looking ahead, market sentiment is overwhelmingly bullish, with key expectations including a breakthrough of the $100,000 barrier. This milestone could prompt long-term holders to realize profits, while fresh retail capital is likely to flood the market, driven by the psychological impact of six-figure pricing. As a result, the bullish momentum is anticipated to continue, reinforcing Bitcoin's dominance in the broader financial landscape.

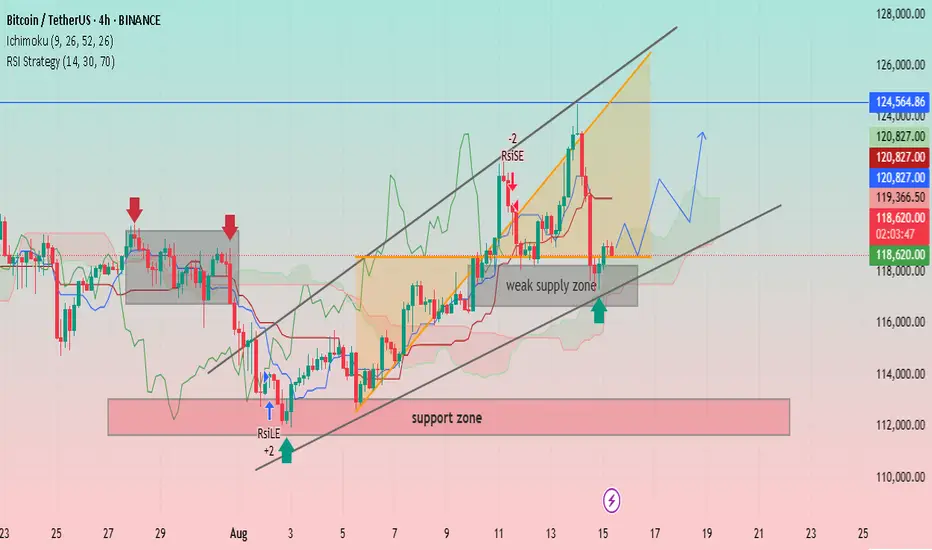
BTC/USDT: Bullish Momentum and Key Support LevelsUptrend Channel: The price is trading within an ascending channel, denoted by two parallel black trendlines. This suggests a bullish trend is in play.
Support and Resistance:
A significant support zone is identified between approximately 112,000 and 114,000 USDT.
A weak supply zone is marked around 118,000 USDT. The price has recently tested this area and found some support.
A strong resistance level is visible at approximately 124,564.86 USDT.
Indicators:
Ichimoku Cloud (9, 26, 52, 26): The price is currently trading above the cloud, indicating a bullish sentiment. The cloud itself appears to be thin and slightly bullish, suggesting potential for continued upward movement.
RSI Strategy (14, 30, 70): The Relative Strength Index (RSI) is used as a strategy, with a "RSILE" signal (likely "RSI Low Entry") marked with a "+2" and a red arrow, suggesting a potential buy signal near the support zone in early August. A "-2" signal is marked near the top of the channel, indicating a potential overbought condition or reversal signal.
Price Action and Projections:
The price recently experienced a sharp decline from the upper trendline, indicating profit-taking or resistance at that level.
The price is currently near the lower trendline and the "weak supply zone," which appears to be acting as support.
A potential future price path is drawn with a blue arrow, suggesting that the price may consolidate or bounce off the current support area and move higher towards the upper boundary of the channel.
Another potential path is drawn with a red arrow, showing a possible further drop towards the lower trendline before a bounce.
Check the BTC 4H candle right at close • Bull trigger: 4H close > 119,600
• Bear trigger: 4H close < 119,200
• Fib 61.8%: 118,340 — was it lost or reclaimed?
Then report in this format:
trigger:
close:
retest/acceptance:
next targets:
other based details cannot be provided here and that’s it. I hope you have a nice day.
