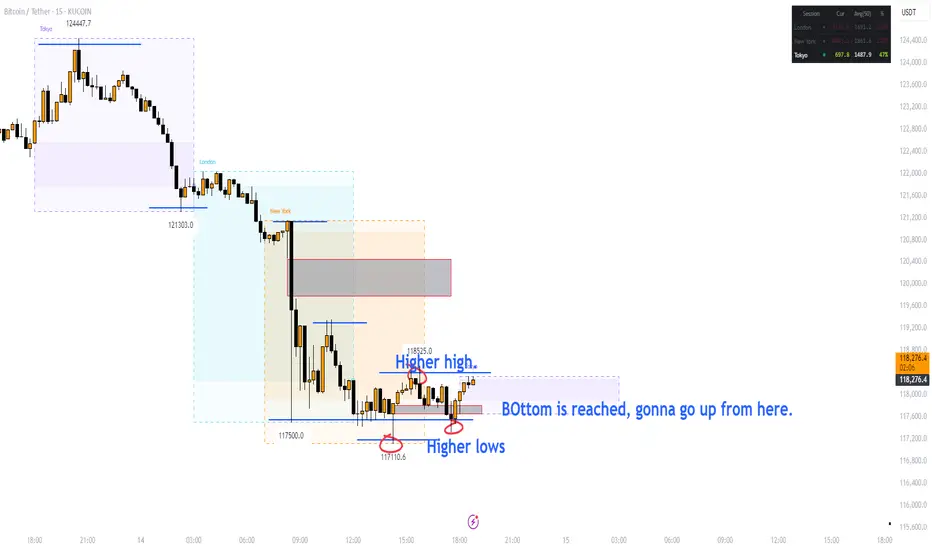
BOttom reached up from here BTCYes, I believe BTC has reached the local bottom, now we go back up, 121, 124, it's a wrestling match between buy and sell, but we gotta take our chances and not be afraid, and be flexible to switch between bearish and bullish when the charts show you the way forward. Get it? Peace out.
TCK.
BTCUSDT trade ideas
Have you just baited the retails in? nice move inst.Have you just baited the retails in? nice move inst.

BTCUSDT 12HAs we mentioned in our previous analysis, we expected #BTC to struggle breaking above the resistance zone at $122,120 – $123,218 — and that’s exactly what happened. BTC attracted liquidity just above this zone and quickly reacted downward.
This drop also filled the CME Gap at $119,100 – $117,425.
On the 12H spot chart, BTC is still within the support zone, with the 12H EMA50 holding as support. If Bitcoin is to move higher, it must hold this zone and rebound quickly.
Otherwise, a breakdown below the triangle support line could lead to moves toward:
🎯 $114,437
🎯 $111,337
🎯 $108,236
🎯 $103,822
🎯 $98,200
If volume picks up and BTC breaks above the resistance zone, the upside targets are:
🎯 $126,507
🎯 $130,473
🎯 $135,524
🚫 Right now is not the time for leverage trades. It’s crucial to wait and see which way Bitcoin breaks. Avoid greed and make decisions with clear judgment — either stay on the sidelines or stick to the spot market.
⚠️ As always, use a tight stop-loss and apply proper risk management.

BTC - 1H Elliott Wave Analysis - 12.08.25Greetings! Another update for you lovely traders :)
Not trying to be confusing, yesterday we looked at the multiple 1-2's set up case, so if you're interested in that count too we recommend you to check out our last analysis which will be linked in the noted down below. Today we will look at the diagonal scenario which we briefly mentioned yesterday!
We assume that the recent move up was a diagonal displayed in green as a five wave move up which ended on the green Wave 5 being a throw over, meaning it pushed over the trendline with high volume and it did enter the wedge later on again. This leading diagonal finished the blue Wave 1 and we are looking for blue Wave 2 now which we would like to get after a pullback as red ABC.
The blue Wave 2 support area lies between the 0.5 FIB at 117150 USD and the 0.786 FIB at 114118 USD. We can not calculate targets for the red Wave C yet. The red Wave A seems to have bottomed. In today's bounce we see that we have a 0.886 FIB touch after the red Wave A low which indicates that the next move up is corrective and not impulsive and that the red Wave A low has a higher probability to be taken again.
The red Wave B target area is between the 0.382 FIB at 119730 USD and the 0.886 FIB at 121948 USD. Keep in mind B waves do not have to strictly respect the target area. We could very well get an overshooting B wave that maybe even takes out the ATH, this would be a bullish sign.
Thanks for reading.
NO FINANCIAL ADVICE.

$BTCok so gave back a fair bit and hesitated buy the deviation on eth
never mind onto the next one
dominance has 59.58 as a resistance for now
was expecting a deviation but not ugly wick
targeting $!23 and shall see if we get a deviation there or not
for now looks to be a retest

$BTC was rejected at $123,000, now where is the next level?!BTC got rejected at the rejection block. Based on Candle range theory, we will see 107500 as our weekly range low soon.
that will be a good support, but we need to monitor the situation closely. I don't expect breaking down that level in the first touch. just grabbing liquidity, but we will see how it will react.


BTC/MSTR Pair Monthly ChartA 1M line chart that shows the BTCUSDT/MSTR Pair. Time to find a faster horse?

BTC shortHere’s the English translation of your sentence:
"I see a BTC short opportunity here. The market will reverse from this area. Please confirm the trade according to your own analysis and place it. Thank you."

BTC Breakout Without Volume⚠️ Watch Out – Breakout Without Volume
Price is testing the resistance zone again, but look closely at the volume bars — there’s no real participation behind this move. Without strong buying volume, it’s unlikely the market can sustain a bullish breakout.
Low-volume breakouts often result in false moves or quick pullbacks as there’s no fuel to keep driving price higher. I’ll be watching closely for confirmation before committing to any long positions.
📌 Quick Technical Note:
In breakouts, volume is the fuel that powers price movement. A breakout backed by strong volume shows that many market participants agree with the move, adding conviction and sustainability. When volume is low, it suggests limited interest — meaning fewer buyers to keep the price climbing, increasing the probability of a reversal or retest.
What do you think — is this breakout already losing steam, or do you see hidden strength here?

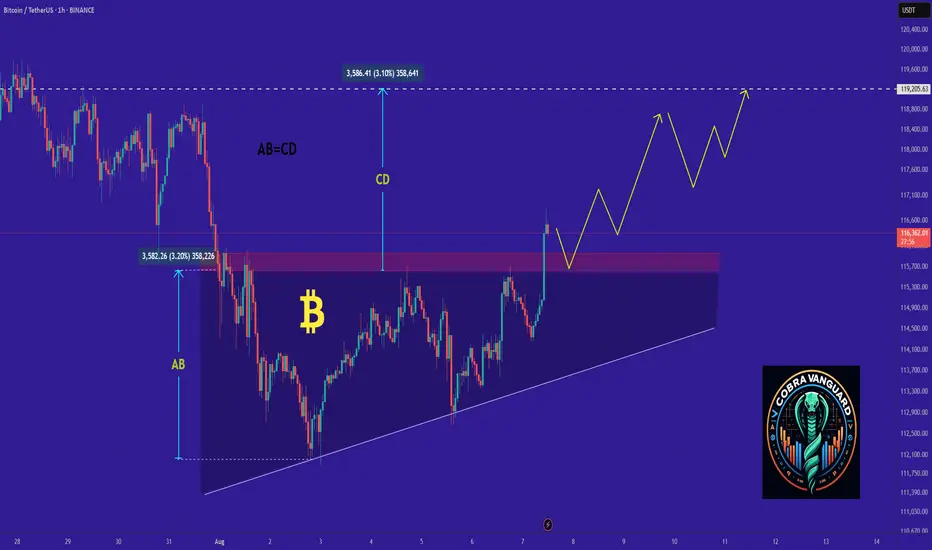
Why BTC Remains Bullish and Its Next Potential Move !bitcoin has completed and broken the ascending triangle in the daily timeframe, The price is currently supported well, which can increase the price. I expect the price to rise to around 119k .
Stay Awesome , CobraVanguard
BITCOIN BULLS ARE GONNA DO THIS NOW!!!! (Fakeout Wick) Yello Paradisers! In this video, I've been updating Bitcoin price action and the Elliot Wave theory. I've been doing lots of advanced technical stuff. We've been going through channeling and updating ourselves about the most important support and resistance levels. We've been taking a look at the MACD histogram, the RSI, and the stochastic RSI. We've been professionally analyzing the volume; we've understood who is in power right now and what's going to happen next with the highest probability.
We've also been taking a look at what kind of confirmations we are waiting for in order for us to be able to open long or short positions.
Paradisers, make sure that you are trading with a professional trading strategy. Wait for confirmations, play tactically, and focus on long-term profitability, not on getting rich quick.
Remember, don’t trade without confirmations. Wait for them before creating a trade. Be disciplined, patient, and emotionally controlled. Only trade the highest probability setups with the greatest risk to reward ratio. This will ensure that you become a long-term profitable professional trader.
Don't be a gambler. Don't try to get rich quick. Make sure that your trading is professionally based on proper strategies and trade tactics.

BTCUSD WILL FLY HIGHAccording to H1 analysis BTCUSD is in flying pressure from last few days and market break the resistance level and make RBS resistance become support
market will be falling soon and reached at support level if you want then go long from support level
TRADE AT YOUR OWN RISK


Bitcoin And The 3 Step Rocket Booster StrategyIf you think Bitcoin is going to a new High and i wont comment on it, you have another thing coming.
There's is no way am going to watch bitcoin go up and not comment.This is the right time for you to see the light
of capitalism.
And of course this is the right to introduce to you
the rocket booster strategy.
This strategy has 3 steps as follows:
1-The price has to be above the 50 ema
2-The price has to be above the 200 ema
3-The price should gap up
You can see the gap up from the new high.
This point you will experience the fear of not taking action
But this is the time to take action do it now.
Rocket boost this content to learn more.
Disclaimer:Trading is risky please learn risk management
and profit taking
strategies
also feel free to use a simulation
trading account before you
trade with real money
[SeoVereign] BITCOIN BEARISH Outlook – August 12, 2025Today, I will introduce my short position outlook for Bitcoin on August 12.
There are two grounds for this idea.
First, an arbitrary wave X forms a 0.382 length ratio with another arbitrary wave.
In general, the 5th wave often has a length ratio of 0.382 compared to the 1st wave.
In this case as well, it can be counted in the same way.
Second, as a result of applying the Fibonacci in reverse to the wave that appears to be in a diagonal form,
the point where the ratio of 2 is formed almost exactly matched the recent high of around 112,360.
I often use this kind of “reverse Fibonacci.”
Normally, Fibonacci is drawn with the past point as the first point and the future point as the second point,
but I do the opposite — setting the future point as the first point and the past point as the second point.
In this case, ratios such as 1.618 / 2 / 2.24 / 2.618 / 3 / 3.618 are often used.
It is especially effective for measuring ratios between wave pairs that skip one wave,
such as between wave A and wave C, or between wave 3 and wave 1.
thank you.

Bitcoin's New All-Time High, Corrections & Bear Market DurationFrom the low in December 2018 until the high in November 2021 there is a period of 1064 days. That's how long the last bull market lasted from bottom to top.
The current cycle started November 2022 with the previous bear market bottom. If we project 1064 days into the future this would put us at the week of 20-October 2025.
Bitcoin rose 65% in 98 days. Between 7-April and 14-July.
Mid-August 2025 through 20-October 2025 gives a total of 70 days.
Do you think Bitcoin will stop rising and produce a long-term bear market after 70 days?
The rise between August 2024 and January 2025 lasted 168 days. 133 days with the December 2024 peak.
168 days starting 7-April 2025 would give us a date around 22-September 2025.
The main question is this: How strong is Bitcoin likely to drop after major growth?
The new all-time high and final peak for this cycle can be $180,000 to $200,000, but strong resistance will be faced around $155,000. Seeing for how long Bitcoin has been moving, do you think a strong correction can happen at 155k? Absolutely.
Think of August 2024. Something like this.
Bitcoin keeps on growing and once this level is reached a flash crash, 30% off or maybe even 35% in a flash. Then a long-term recovery and bullish resumption toward 200K and beyond. And it keeps on going, bear markets being nothing more than a correction. No more bear market but mild, strong or weak corrections.
The next target is $137,000 and this is an easy level. Watch out for $155,000. It is a mixed bag, the market will not behave in expected ways. It will be unpredictable on the short-term. You can predict the bigger picture though, it is going up. When in doubt, hold strong (and follow).
Namaste.

BTC Bitcoin Among My Top 10 Picks for 2025 | Price TargetIf you haven`t bought BTC Bitcoin before the recent breakout:
My price target for BTC in 2025 is $125K, driven by the following fundamental factors:
Regulatory Developments Favoring Adoption:
The anticipated regulatory shifts in the United States are expected to create a more favorable environment for cryptocurrencies. With the potential for pro-crypto policies under a new administration, including the establishment of Bitcoin as a strategic reserve asset by major nations, investor confidence is likely to increase significantly. Analysts suggest that such developments could drive the total cryptocurrency market capitalization from approximately $3.3 trillion to around $8 trillion by 2025, with Bitcoin poised to capture a substantial share of this growth.
Increased Institutional Demand through ETFs:
The launch of Bitcoin exchange-traded funds (ETFs) has already begun to transform the investment landscape for Bitcoin, making it more accessible to institutional and retail investors alike. Following the successful introduction of multiple Bitcoin ETFs in 2024, analysts project that inflows could exceed $15 billion in 2025, further boosting demand for Bitcoin. This increased accessibility is expected to drive prices higher as more investors seek exposure to the asset class.
Supply Constraints from Halving Events:
Bitcoin's supply dynamics are fundamentally bullish due to its halving events, which occur approximately every four years and reduce the rate at which new Bitcoins are created. The most recent halving in April 2024 has led to a significant reduction in supply inflation, creating scarcity that historically correlates with price increases. As demand continues to rise while supply becomes more constrained, this fundamental imbalance is likely to support higher prices.
Growing Adoption as a Store of Value"
As macroeconomic conditions evolve, including persistent inflationary pressures and potential monetary policy easing, Bitcoin is increasingly viewed as a viable store of value akin to gold. This perception is bolstered by its finite supply and decentralized nature, making it an attractive hedge against inflation. Analysts suggest that as more investors turn to Bitcoin for wealth preservation, its price could see substantial appreciation

BTC – Still looking heavy below key resistanceDespite a short-term relief bounce after Monday’s drop, BTC remains below the critical 1D MSS + S/R (red box). Structure is weak until this level is reclaimed. Bears remain in control as long as price can’t close above 115.7k.
Plan:
Maintain bearish bias while below the red box — expecting new lows, targeting the green demand/OB cluster around 108.3k.
Flip the red box (close above 115.7k) and the outlook shifts to neutral or bullish.


Bitcoin is on fire!Bitcoin is on fire!
🔥 Heading for an all-time high - will it break the record this time?
I THINK YES!!!
Write your opinion

BTCUSD ready for Breakout ? 140K TargetBTCUSD is currently moving within an ascending broad wedge pattern on the 3D chart. Price has reached the resistance area near 123K and is showing a higher probability of breaking above it, targeting the 140K level. The setup remains bullish as long as price holds above the marked sub-trendline.

It's to be apart of the trading revolutionthe AI I've built from scratch has predicted the market moves 6 weeks in advance
this level of accuracy is mind melting...
So many people have lost in this game, not only are we winning, I'm revolutionize it.
Reach out to me if you have any questions
