BTC 1H Analysis – Key Triggers Ahead | Day 10💀 Hey , how's it going ? Come over here — Satoshi got something for you !
⏰ We’re analyzing BTC on the 1-hour timeframe .
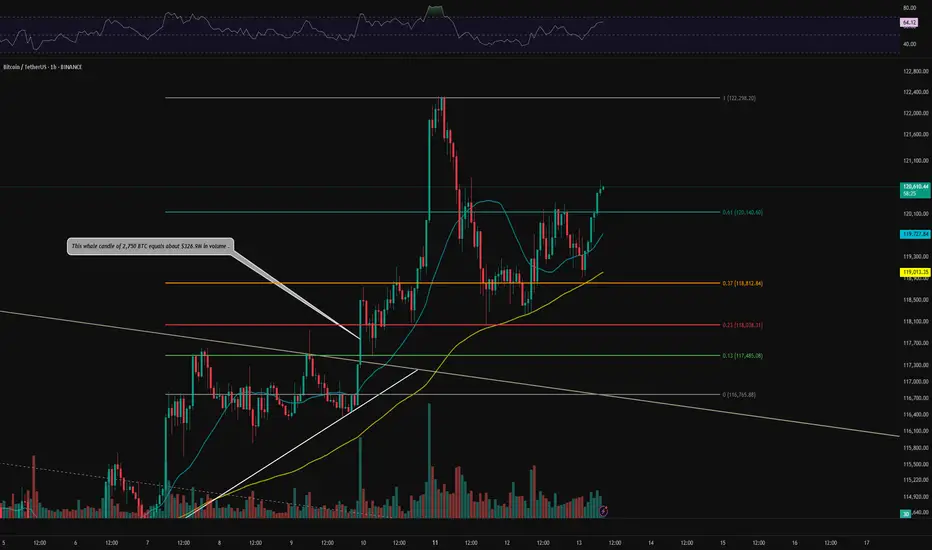
👀 After completing its correction, BTC broke the 120,140 zone and consolidated above it, now heading toward higher resistance levels. Increasing buy volume and support from moving averages are observed .
🎮 Fib drawn from the bearish channel breakout to the 122,300 ticker seller zone. The last resistance for ending the correction and forming a new bullish structure was the 0.61 Fib level, which was broken and consolidated above. The next resistance (potential new ATH) is at the 0 Fib level .
⚙️ BTC is approaching the overbought zone on RSI , which could facilitate a stronger push toward resistance and a potential breakout .
👑 Moving Averages:
MAs (medium and low wave cycles) are strongly bullish , showing high momentum .
🕯 Volume & Market Session :
Rising buy volume is noted . We're approaching the New York session, which may bring increased buying pressure. Stay at your system during this session to monitor the chart .
🔔 Set an alert at 122,300 to observe price behavior. This zone offers low-risk trading opportunities , and price action here can guide trade decisions .
🖥 Summary : BTC has broken the key Fibonacci zone, signaling the end of its correction. Taking a long position now may be challenging , but price action at 122,300 can provide a good trading opportunity .
📊 On the 1H timeframe for USDT.D , USDT.D broke the 4.10 zone and is moving downward. The next support is at 3.92 .
❤️ Disclaimer : This analysis is purely based on my personal opinion and I only trade if the stated triggers are activated .
BTCUSDT trade ideas
Bitcoin (BTC): We Are Back | Bullish Until ATH BTC is back, showing us bullish signs that could and should lead us back to the all-time-high zone.
What we expect here is the break of that ATH zone so for now we aim to reach that upper zone and once we are there and see signs of a breakout, we are going to aim for the $140K area.
Swallow Academy

$BTC Macro OutlookWeekly Chart
BTC is still trading inside the macro range at $111,959.5–$119,655.0. Last week closed green but as an inside bar, which signals indecision. We also printed a failed auction above the prior higher-high vLevel—hinting at trend fatigue and the risk of a deeper pullback.
As long as price holds $111,959.5, the broader bullish structure is intact. A weekly close below $111,959.5 would likely open room toward the next vLevel near $98,115.4. Until this range resolves, expect two-sided trade and respect the extremes.
Daily Chart
Today’s candle closed as a shooting star (bearish pin bar) with elevated Relative Volume (RVOL), a classic reversal signal at resistance. On the Footprint, delta finished negative and, more importantly, VAH, VAL, and the POC all sit inside the upper wick, which tells us most of the trading occurred near the highs. That’s typical of late longs getting trapped.
With the daily trend pointing lower, the base case is a rotation toward the $111,910 vLevel. Until conditions change, treat bounces as opportunities to stay aligned with the bearish daily momentum.
12-Hour Chart
Structure is still bullish, but this push looks more like a liquidity sweep above the prior range highs, right where most short stops sit; than true initiative buying. If we fail to gain acceptance above the breakout and rotate back inside the range with sell-delta/absorption at the highs, I’ll treat it as a failed auction and look for rotation back toward the range low.
4-Hour Chart
After a clean macro Over/Under, the 4-hour has rotated back into the SWING OTE zone, exactly where I want to be stalking shorts. Despite the 4H still reading structurally bullish, price is boxed inside $118 395.8–$122 165.4 and keeps showing responsive selling into the upper range. For a swing short, the key now is the 30-minute: Invalidation is acceptance above $122 165.4; below that, the short idea stays in play. We’ll break down the 30-min setup next.
30-Minute Chart
The 30-minute is flashing a clean spike in both CVD and Open Interest, fresh longs chased the intraday pump. Best case from here is a full fade of that impulse, turning late buyers into exit fuel. Leverage looks elevated, so a liquidity flush is very much on the table if price can’t hold acceptance above the spike. I’m placing limit shorts inside the intraday OTE zone with my stop just above 122 165.4.

Skeptic's Night Byte: How to Catch Altcoin MovesHey, welcome to the first episode of the Skeptic's Night Byte
In this quick lesson, we’ll dive into how to spot when liquidity moves from Bitcoin into altcoins .
Each video is about 60 seconds, giving you fast, no-fluff insights to help improve your trading game :)
If you find this useful, give it a boost and share it with your trading circle.
Let’s get started!

BTC/USDT Analysis — Buyer Weakness
Hello everyone! This is the trader-analyst from CryptoRobotics with your daily market analysis.
Yesterday, Bitcoin finally moved into a correction after forming resistance at $121,500–$122,300. There was no reaction at the nearest support around $120,000 (push volumes). Only at $119,000 did buyers attempt to step in — the delta suddenly turned positive — but for now, all buying attempts are being absorbed.
The scenario is currently highly mixed: on the one hand, wave analysis shows we are still in a strong bullish trend; on the other, volume spiked sharply at the top and is being positioned for shorts, while there was also no clear defense at support.
At this stage, we expect further correction either from current levels or after a retest of ~$120,000 (mirror zone). After that, we will watch for the buyer’s reaction at the lower support zone. This scenario will be invalidated if $120,000 is broken without any defense from sellers.
Buy Zones:
$117,500–$116,000 (accumulated volumes)
$115,300–$114,000 (accumulated volumes)
Sell Zones:
~$120,000 (mirror zone)
$121,500–$122,300 (volume zone)
This publication is not financial advice.

Bitcoin (BTC): Looking Back At Last Analysis | Buyers DominateSince last time we looked at the 4-hour timeframe, we have had a good 7% upside movement, where price is now back in our sideways channel, giving us another opportunity for a potential breakout to happen and proper buyside movement to start!
So we wait out today, and if buyers maintain current zones, we are going to look from a different angle!
Swallow Academy

BTC Buy / Long SetupWait for the entry till London Session, and Hold the trade, Must use SL with proper risk management.

Bitcoin (BTCUSDT) Technical Analysis – August 11, 2025📊 Bitcoin (BTCUSDT) Technical Analysis – August 11, 2025
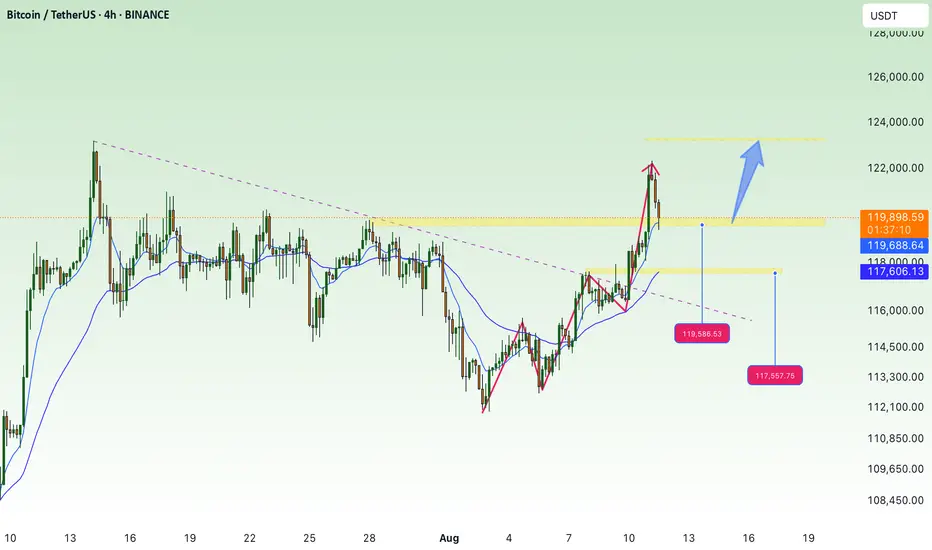
🔹 After breaking the downtrend line, Bitcoin rallied to the key resistance zone at $122,000 before starting a pullback.
📉 Bearish Scenario:
First support: $118,273 (confluence with the broken trendline)
Second support: $117,000
📈 Bullish Scenario:
If BTC bounces from these supports, the first target is $122,000
A strong breakout above this level opens the way to the next target at $129,000
⚠️ Note: Always wait for strong candlestick confirmation before entering any position.
#BitcoinAnalysis #BTCUSDT #Crypto #Bitcoin #TechnicalAnalysis #Cryptocurrency #Trading #PriceAction #CryptoTrading #BTC

BTC is in the 4th wave zone.BTC is in the 4th wave zone. Key support at 108.8K — as long as price holds above, targets at 123K and 130K remain in play. A break below cancels the scenario.
#BTCUSD #Bitcoin #ElliottWave

BTCUSDT | Cup & Handle Breakout Forming – Key Resistance Ahead!Bitcoin is forming a classic Cup and Handle pattern on the 4H chart, indicating potential for a bullish breakout.
🔹 Key Highlights:
Clear bullish momentum after a confirmed ChoCH (Change of Character)
Bearish trendline has been broken, shifting market structure
Price approaching the resistance area near $120,000, which aligns with a strong high
Watch for breakout above the target zone for potential continuation
MACD shows bullish divergence supporting momentum
📌 A clean break and close above the resistance zone could trigger the next leg up. However, a rejection here may retest the $112,000–$114,000 demand zone (handle support).
🧠 Not financial advice. Always do your own research before trading.

BTCUSDT Analysis
BTCUSDT From our previous analysis, BTC initially showed signs of a potential decline, but after holding a long-term support level, it has now pushed toward the 124K resistance. In the short term, a pullback is expected to retest the green support zone before continuing its upward movement.
BTC’s strength is supported by rising demand as an inflation hedge, which could maintain bullish momentum in the coming sessions.

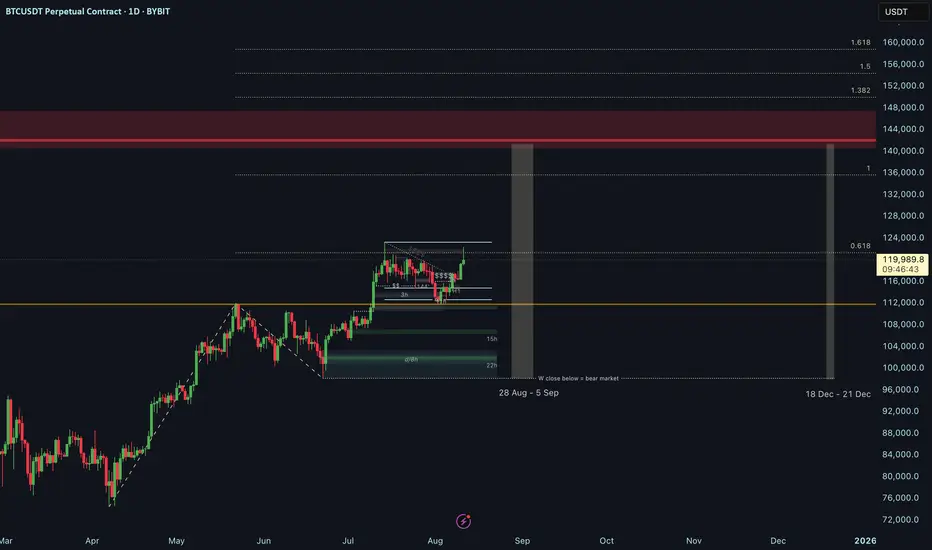
BTC Plan 2025 - 2026BTC is making the double top pattern and GANN pattern. I am expecting it down to 108k-110k target in play. After hitting this target, it will bounce back to 135k-155k target for wave 5 to complete this bull market cycle.
lets wait and play.

BTCUSDT – Eyeing Liquidity & Channel Resistance BTC has rebounded strongly from the lower boundary of the descending channel, supported by a recovery in momentum indicators from oversold territory. This move has pushed price toward the upper trendline resistance, with bullish momentum eyeing key liquidity levels.
A CME gap lies just ahead, acting as a potential magnet for price action. The immediate long target sits at $115,450, aligning with the identified liquidity zone and serving as the first area of interest for partial profit-taking. Sustained bullish pressure could lead to a test of the upper channel resistance near $121,400.
However, traders should monitor price reaction closely — a rejection from resistance could trigger a retracement toward mid-channel support or even back to the lower boundary around $108,000.
Key levels to watch:
Long Target: $115,450 (Liquidity zone)
Resistance: ~$121,400 (Upper channel boundary)
Lower Support: ~$108,000 (Channel base)
📊 Bias: Short-term bullish toward $115,450, but still trading within a larger corrective structure. Reaction at $121,400 will be critical for the next trend leg.

Support and Resistance Areas: 114454.57-115854.56
Hello, traders!
Follow us to get the latest information quickly.
Have a great day!
-------------------------------------
(BTCUSDT 1D Chart)
The K indicator on the StochRSI indicator appears to have entered the overbought zone, leading to a change in slope.
Therefore, the upward trend appears likely to be constrained.
-
We need to confirm whether the price falls within the range indicated by the index finger.
The key question is whether there is support around 114454.57-115854.56.
If it declines, it is likely to continue until it meets the M-Signal indicator on the 1W chart.
At this point, we need to check for support around 108353.0.
This period of volatility is expected to occur around August 13th (August 12th-14th).
The start of a stepwise uptrend is likely to occur only after it rises above 119177.56.
-
Thank you for reading to the end.
We wish you successful trading.
--------------------------------------------------
- This is an explanation of the big picture.
(3-year bull market, 1-year bear market pattern)
I will explain in more detail when the bear market begins.
------------------------------------------------------

BITCOIN target $140,000-150,000Wave-g of (d) has become completely similar to Wave-a in terms of price and then moved strongly upward, surpassing the end of Wave-f. As long as the price does not break below $117,000 and consolidate there, the price targets of $140,000 to $150,000 will remain achievable.
In my last post about Bitcoin, I mentioned that Mr. Powell's speech might cause the pattern to expand, and that’s exactly what happened—Wave G has slightly extended in terms of price.
My personal opinion (not a recommendation to buy or sell):
For Bitcoin, a long-term investment approach should be adopted, and short-term fluctuations should be ignored. These short-term fluctuations can merely provide opportunities for additional buying.
Good luck
NEoWave Chart

Finale is done.So many bearish patterns are there.
Before I said, finale always leads to alt bull-run. But, it is almost ended too.
However, it doesn’t mean cycle is end.
I just think CRYPTOCAP:BTC will be in big box-range. This range is too wide to say that it is just the Healthy Pullback. That’s the reason why I said “finale is end. bearish.”.
Alt finale is also end but I still think alt is better than btc at current markets because btc will be at the big range box price. I prefer low fdv or nice float of cmc/fdv alts from now. Heavy, especailly CRYPTOCAP:ETH needs time to relay the bull run .
Summary
>>Finale is ended. DCA time for $BTC. Trading time for low cap ALTs. No long-term view now.

BTC - 1H Elliott Wave Analysis - 11.08.25Welcome back to our updated Elliott Wave Count for Bitcoin.
Apologizes for not publishing an update yesterday, I caught a cold over the weekend so I wasn't in a good position to do a proper analysis :( We try to post a daily BTC update and occasionally EW counts for other coins too :) Going to try to keep that style up but no promises got to see how it works out.
We have seen a strong move up from our support area as we expected.
Today we got another count on the charts which doesn't mean that the other count (diagonal) we have been discussing throughout the last week is invalid. More on that later this analysis.
In this count we assume that the move up isn't a diagonal but rather multiple 1-2 set ups.
This count allows us to go higher more directly with a strong Wave 3. We got three 1-2's, a green one, a blue and a white one on the chart. We assume that the recent aggressive push was the white Wave 3 and we're now seeing a pullback in white Wave 4 which will be followed by the white Wave 5 which finishes the blue Wave 3 etc.
The support area for the white Wave 4 is between the 0.236 FIB at 120'892 USD and the 0.5 FIB at 119'150 USD. Preferably we would see a bounce from here now in this count as we have already entered it and tested the 0.5 FIB of the support area which Bitcoin seems likes to be doing recently. In case we go lower it could be that the white five move is already done but we'll see how it develops. The blue Wave 4 support area would be around 118'000 USD to 120'500 USD.
As above mentioned this doesn't invalidate the diagonal count. It is hard to distinguish between multiple 1-2's and a diagonal. We lean towards the multiple 1-2's count because the last move up was impulsive and aggressive. If you connect the Wave 1 and 3 high you get a trendline which can be overshot by the 5th Wave in a diagonal in a such called "throw-over" which usually comes with high volume which we indeed had here. The issue is we are looking for a leading diagonal and this throw-overs are more common in ending diagonals which is the main reason for the switch of the counts. :) Hope it makes it more transparent and understandable!
I just want to make aware that with this counts we got multiple support areas which are close to each other or even overlap. Essentially the whole price range of 114'000 USD to 121'000 is important, preferably we still want to bounce from the mentioned support area above but what we want to make aware of is that a break of it doesn't turn the count bearish. Just keep that in mind when trading on smaller timeframes :)
We would appreciate a follow and boost if you like the analysis! :)
Thanks for reading.
NO FINANCIAL ADVICE.

BTC Double Combo CorrectionFollowing a failure to maintain support at several critical technical levels, Bitcoin now appears vulnerable to a potential decline toward the ~$111,000 region. This projection is derived from an Elliott Wave corrective structure identified as a WXY Double Combination. The initial leg of the pattern features an ABC correction terminating near the 0.618 Fibonacci extension, thereby establishing the W pivot. This is succeeded by the X pivot, followed by a sharp, impulsive decline forming the Y wave.
By applying a trend-based Fibonacci extension across the W, X, and Y pivots, we can estimate the probable termination point of the corrective sequence—typically extending into the 1.0 to 1.1 Fibonacci range.
This move is anticipated to unfold over the weekend, potentially presenting a strategic buying opportunity, contingent on a favorable reaction at the projected low. Sunday evening may offer optimal conditions for entry, as traditional market participants—limited to weekday trading—could miss the initial dip, subsequently being compelled to re-enter at elevated price levels.

Weekly trading plan for BitcoinBINANCE:BTCUSDT has shown strong growth since last week; the main task now is to print a new ATH. The price will likely test the 126K–130K zone we marked a couple of weeks ago, with a final monthly target at 132K .
We’re seeing some pressure and a pullback, but as long as the trendline holds, there’s a real chance to see a new ATH today/tomorrow . If the trendline breaks, I’ll look for a reversal from the moving averages or after a test of the weekly pivot.
If 115K breaks, I’ll expect further downside toward 110K .
More details are in the idea video.

continue to increase in price, towards old ATH💎 BTC WEEKLY PLAN UPDATE (11/08)
1. Overall Trend:
BTC has completed a 5-wave Elliott impulse and is currently in a corrective phase after wave (5).
The main trend remains bullish, as the wave structure has not broken and price is still above key EMA lines.
2. Fibonacci Levels:
The current correction may retrace to the following Fibonacci support levels:
• 0.382 Fibo: ~118,800 USD (aligns with strong support)
• 0.5 Fibo: ~117,800 USD (close to EMA and trendline)
These are potential price zones where the market may rebound.
3. Support & Resistance Zones:
• Near-term Support: 118,000 – 117,500 USD (combination of Fibo + EMA + broken trendline).
• Near-term Resistance: 120,000 USD (previous high).
• Next Resistance: 122,000 – 123,000 USD (Fibo extension target 2.618).
4. Main Scenario:
BTC retraces to 118K – 117.5K → rebounds → breaks 120K → moves towards 122K – 123K.
5. Trading Notes:
• Prioritize entries when price reacts well at 118K – 117.5K support zone.
• Stop loss if H4 closes below 117K.
• Stay patient, as corrections are normal before the next upward move.
BTC - TOP CYCLE 2025key zones of price & time to watch.
every sign of an accumulation or distribution in those zones would trigger the alert.
11/08/25 Weekly OutlookLast weeks high: $119,322.97
Last weeks low: $112,665.39
Midpoint: $115,994.18
BTC takes back the spotlight as the week ends! Breaking through the previous weeks high just hours after weekly close and stopping just shy of ATH. This rally comes off the back of a successful bounce from $112,000 area and mirrors the previous weeks drawdown almost perfectly setting up an interesting week ahead.
I am still wary of August seasonality, yes BTC and the broader altcoin market especially ETH have seen great gains so far this month but history shows August is not kind to the bulls;
August '24: -8.74%
August '23: -11.27%
August '22: -13.99%
August '21: +13.42%
August '20: +2.74%
August '19: -4.84%
August '18: -9.0%
Now history doesn't necessarily repeat itself but it does rhyme. Should BTC SFP and accept below the weekly high I would say a $115,000/ Midpoint retest is a logical move. RSI has been posting bearish deviations on HTF (1W&1M) which can suggest a shift in trend is coming but further proof of this would be needed before then
This week CPI & PPI take place on Tuesday and Thursday respectively. With a September interest rate cut on the horizon this data release may be more important than it has been in recent months so I'm keeping a close eye on the result.
Previous: 2.7%
Forecast: 2.8% (+0.1%)
For altcoins many have had great rallies, ETH predominantly after breaking through $4000, again many indicators are showing a local top is due so I am looking at price action context for any clues of a pullback to come, until then the trend is your friend.
Good luck this week everybody!

BTCUSDTlet see what will happen my expactation it is. it is doing w and high. there is idm level and below of it exist fvg and order block when you check daily and weekly you will see the level which i mention.
