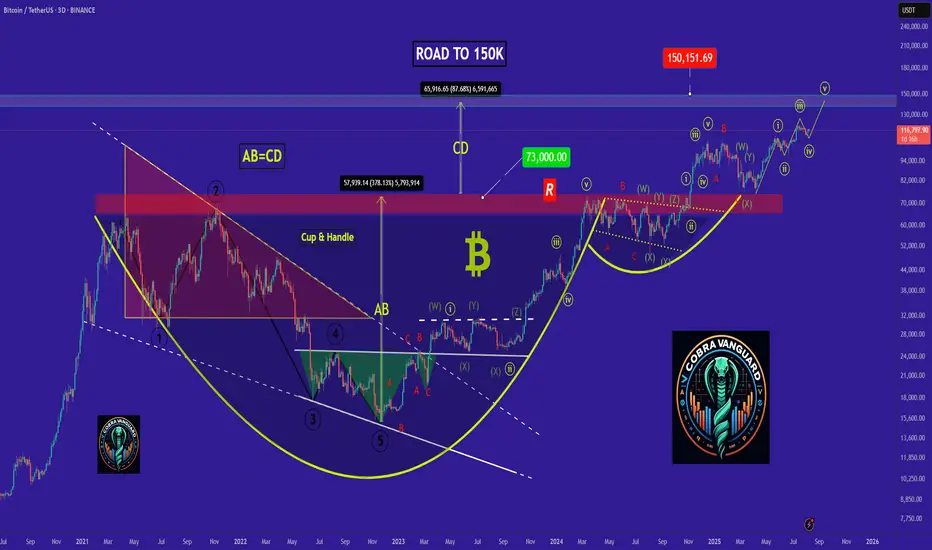
Bitcoin 3D · $137000 Next Target & The Altcoins Market & MercuryBitcoin continues to look awesome. The next target is $137,000 short to mid-term, let's say within 1-2 months. Certainly Bitcoin will continue growing after this target. It comes up and we know when this level is reached there will be a stop. Just as Bitcoin stopped after reaching $123,000. A small pause, a small retrace and then more growth.
We are now in the more growth phase, you are looking at 3D candles. Just today, 11-August 2025, a new 3D session started and as you can see, full green. Bitcoin is now trading at is highest price ever since the all-time high. At resistance, challenging resistance, ultra-bullish.
There are many signals that support a bull market, bullish growth, bullish continuation, bullish impulse, bullish resumption, bullish trend and long-term growth. One of the strongest signals comes from the altcoins.
When Bitcoin consolidates at a high price, it is hard to know if the next move is down or up, the market always goes into a frenzy and half go SHORT the other half go LONG.
You don't have to guess. If the altcoins are rising while Bitcoin is consolidating, this means that the consolidation will lead to additional growth. If the altcoins are dropping while Bitcoin is consolidating, this means that the consolidation phase will end as a breakdown with lower prices.
We see the altcoins growing; we saw the new multiple years high Ether (ETH) did. We know how the smaller altcoins are performing after looking at hundreds of charts. We know the market is not red. We know some are lagging behind or some are way ahead... We know, we know, we know... We know the market is painful when it is bearish; we know the market is quite generous when it is set to grow.
The market does not discriminate between down or up. When it is going down, it will activate all of your stop-loss and beyond. When it is going up, it will fill up all of your sell orders and then go higher... That's how the Cryptocurrency market works.
We are set for the final stage of the bull market, for Bitcoin. For some projects the bull market starts now and will go for years on end. There will be strong variations. Allow for strong variations. I already adapted and this will be a great development because opportunities will be available always. This is the turning point. Mercury stations direct today.
Namaste.
BTCUSDT trade ideas

BTC Breaks the Cage – Is $125K Next? (With Built-In Invalidation🔥 Welcome to The Wick Syndicate 🔥
The $118K prison bars just snapped — and Bitcoin didn’t even pause to look back.
We’ve been shadowing this move for days, waiting for the exact moment the door would swing open.
Now it’s here — a textbook continuation setup for those who know how to ride the current.
In a bull run, pullbacks aren’t fear.
They’re the market leaning in, asking quietly: “Care for another bite before we run?”
📊 BTCUSDT.P – Long Setup
🎯 Direction: Long
📍 Entry Zone: $119,800 – $120,200 (Breakout base retest + POC support)
🩸 Stop Loss: $118,500 (Below base & liquidity sweep)
🎯 Take Profits:
• TP1: $122,500 (Intraday liquidity)
• TP2: $124,000 (HTF extension)
• TP3: $125,000 (Round number + major liquidity)
📐 RR Ratio: ~1:2.6
🧠 Logic: HTF breakout above $118K range, spot-led buying pressure, OI rising, low resistance ahead. Bull run momentum favors shallow pullbacks & fast legs higher.
⏱ Trust Meter: ████████▒▒ 80%
⸻
⚠️ Execution Rules – Read Before You Ape
We never enter without confirmation.
For this trade, confirmation means:
• Price retests $119,800–$120,200 and holds above with a clear bullish M15–M30 CHoCH/BOS or footprint/CVD absorption.
• A clean 30m close below $118,500 = setup invalidated, bias flips to neutral until new structure forms.
No confirmation = no trade. Fakeouts in bull runs are savage — trade smart, not desperate.
⸻
Candle Craft | Signal. Structure. Execution.

DeGRAM | BTCUSD exceeded $120k📊 Technical Analysis
● BTCUSD has broken above the 119.4k–119.9k support-turned-resistance zone, confirming a bullish channel breakout.
● Structure favors a climb toward the 129.4k resistance, with short-term pullbacks expected to retest the green support band before continuation.
💡 Fundamental Analysis
● ETF inflows hit a 3-month high as institutional interest in BTC strengthens amid rising inflation-hedge demand.
● On-chain metrics show increased miner accumulation, signaling confidence in higher future prices.
✨ Summary
Long above 119.4k. Targets 125k → 129.4k. Setup holds if price remains above 118.5k.
-------------------
Share your opinion in the comments and support the idea with a like. Thanks for your support!

BTC - 1H Elliott Wave AnalysisWelcome back to another Elliott Wave Analysis for Bitcoin! :)
In this analysis we want to focus on the short term. We have been in a correction displayed as pink ABC and it seems that this correction is coming or has come to an end in the pink Wave C.
It is hard to say if the pink Wave C has finished yet. The last low at 111'850 USD is the 1 to 1 ratio of the pink Wave A to the pink Wave C which is a common target for Wave C.
Looking at the sub-count in white we think another low in white Wave 5 would look cleaner but it is not given to happen.
For now we added the white Wave 4 resistance of which we touched the 0.5 FIB retracement at 115'830 USD which is a rather deep but valid Wave 4. We also added the 0.618 FIB at 116'213 USD which would be the invalidation for the white Wave 4. If we hit it the probabilities shift to the case that the low at 111'850 USD is already the end of pink Wave C.
If we get white Wave 5 the first target would be at the 1 to 1 FIB at 111'319 USD which is right below the last ATH of which we bounced recently but that seems a bit shallow.
The next target would be at around 109'700 USD where we got some confluence between the 1.38 FIB target for white Wave 5 measured with the white Wave 1 as well as the 1.618 FIB target if we measure of the white Wave 4. It is also close to the 0.5 FIB of a bigger support area.
Be aware that the bigger support area below goes down to 103'000 USD which is the 0.786 FIB of the support area.
Due it looking likely that pink Wave C is finished we also added the support area for the potential Wave 2 in the bullish scenario.
It is between the 0.5 FIB at 113'640 USD and the 0.786 FIB at 112'616 USD. From this area we would like to see a bounce if the low is already in.
Thanks for reading.
We would appreciate a follow and boost if you like the analysis! :)
NO FINANCIAL ADVICE.

bitcoin - Time to buy again!The price seems to have completed the fourth corrective wave, and from now on, it's time for a price increase, which will continue up to around $150k .
previous analysis
$BTC Market Outlook – Repeating Pattern?CRYPTOCAP:BTC Market Outlook – Repeating Pattern?
Bitcoin appears to be following the same repeating pattern we saw back in May–June 2025. On the Daily timeframe, a clear bull flag is forming, with both MACD and RSI confirming the setup.
In the previous instance, the pattern included two pullbacks before a strong rebound.
Currently, we’ve already seen a bounce off the 50 EMA, which acted as solid support.
You can clearly see the striking similarities, with both the MACD and RSI showing the same bearish divergence.
If history repeats itself, the likely scenario is:
Rejection near the top resistance at $119.5k
Pullback toward the 100 EMA to find support, signaling the end of the correction
The structure is mirroring the earlier move almost perfectly.
Key support levels: $115.6k, $112k, $109k, and in case of a deeper (low probability) pullback: $104k
Key resistance levels (possible rejection zones): $119.6k, $122.2k
If $122.2k is broken, we could be looking at a new ATH.
DYOR 📊

Buying Idea For BITCOIN
dont be aggresive dont be greedy
Trading is 80% of waiting 20% (open position, money management, etc)
Lets wait and see BINANCE:BTCUSDT

BTC - Full Elliott Wave count for this Bull RunFull BTC Elliott Wave count for this Bull Run
Chart - Bottom left Nov 2022 low of 15k
🔴 Primary waves are circled in red
.......
🔴 Primary waves 1 to 4 are complete
.......
🔴 Primary wave 1 was -
🟧 Intermediate waves 1 to 5
🔴 Primary wave 2 was -
🟧 Intermediate waves WXY
🔴 Primary wave 3 was -
🟧 Intermediate waves 1 to 5
🔴 Primary wave 4 was -
🟧 Intermediate waves ABC
🔴 Primary wave 5 is in play as -
🟧 Intermediate waves 1 to 5
🟧 Intermediate waves 1 to 4 are complete
🟧 Intermediate wave 5 is now in play as -
🟦 5 Minor waves drawn on the chart
Target - 200 to 300k

127-128k incoming ( altcoins round ? )Hi, Bitcoin seems to have completed its short term Elliott wave 4 correction and the price action analysis also confirms that this time Bitcoin will be able to break the 120-119 resistance, I predict Bitcoin to make a new high around 127-128. Altcoins have not grown that much yet and if the price can make a reliable consolidation above 120k, altcoins will start to rise.

Bitcoin testing 116k zoneIf we are successful in breaking above the 116k zone resistance. Bitcoin will pump hard to 120k and 123k next. As the high time frame trend continues to stay uptrend. Let's see if bitcoin breaks it now or has some other plans.
Stay tuned!

BTCUSDT 111k first then UPHi fellow traders,
Here’s my current BTCUSDT view on the 4H chart, based on Elliott Wave principles.
After a corrective structure, we’ve seen a strong bounce, and price is now approaching a key area of interest. I’ve marked the zones I’m watching for potential buys and sells:
🟨 Lower box: Potential buy zone if price pulls back with a corrective structure.
🟨 Upper box: Area of interest for taking partials or looking for potential short setups, depending on how price reacts.
If momentum continues, we could see BTC pushing into the 125K region, which aligns with fib extensions from previous swings.
As always, I’m waiting for confirmation before making any entries.
Let me know what you see on your end!

BTC - Rising Wedge testing previous Channel highBTC has made a strong recent runup and is now testing the high side of a recent consolidation channel.
A Rising Wedge making higher highs and higher lows is pushing BTC into overbought territory and if the attempts at the previous channel high fails, with price falling through the lower wedge support line, there could be a period of bearish exhaustion to previous support zones.
BTC OUTLOOK LOOKING AT BTCUSD, price presented us with a bullish momentum the previous weeks but rn we shall probably withness a dp{retracement in the trading melieu}

BTC Price Prediction and Elliott Wave AnalysisHello friends,
>> Thank you for joining me in my analysis.
- As we had explained in my last idea, I think we are still moving in this Brown X, which starts to form this Irregular flat pattern Green wave ABC.
- till now, I don't have any confirmation of ending this Green wave B, just breaking 115000 will confirm it.
>> Reminder:
* For the biger imagination of the BTC path, we are still moving into the Orange wave A of the final White C for ABC from its begining.
* For the smaller imagination of the BTC path, we are still moving into the Blue wave C of the final Green C for the upper Orange wave A.
* For the tighter imagination of the BTC path, I think we are still moving into the correction wave B for the upper Blue wave C.
Keep liking and supporting me to continue. See you soon!
Thanks, bros

Emotions vs. StrategyTrading rarely breaks us technically — more often, it breaks us psychologically. Anyone who has ever opened a position knows this feeling: your heart races, your hand wants to close the trade too early, and the thought “What if I was wrong?” keeps gnawing at you. Emotions are a trader’s biggest enemy. And more often than not, they are the true reason for losses, not the market itself.
Imagine this: you open a long, and the price immediately moves against you. Instead of calmly waiting for your pre-set stop-loss, you move it, or worse — remove it altogether. Or the opposite: the trade is profitable, but the fear of losing makes you close far too early. The result? The strategy collapses, trades become chaotic, and the account balance shrinks.
Every trader has had that moment of realization: “I knew what I should have done, I had a plan — but I couldn’t handle the pressure.” That’s the most frustrating part, because knowledge and analysis were there, but discipline failed. And in those moments, you understand that the winners in this game are not the smartest ones — they’re the ones who can stay calm and stick to the system.
What really helps
1. A systematic approach. Trading must be built on an algorithm, not on impulses or guesses. If you have a clear plan — entry, stop-loss, profit targets — the risk of chaotic actions drops dramatically.
2. Writing the rules down. A written plan works better than one you keep “in your head.” Many successful traders keep a trading journal: why they entered, what emotions they felt, where they made mistakes. This builds awareness and helps improve discipline.
3. Automation and tools. Using algorithms that help manage trades takes away most of the emotional burden. Machines don’t hesitate, don’t fear, and don’t regret — they simply act according to conditions.
4. Proper risk management. Emotions flare up when the risk per trade is too large. If a position risks only 1–2% of your account, market swings don’t feel as painful — and that allows you to calmly stick to the plan.
5. Stop-losses and take-profits. These are not only for controlling risk and locking profits — they are tools for peace of mind. A trader who sets them in advance is less likely to act impulsively.
6. Diversification. Putting all of your capital into one trade is the fastest way to emotional burnout. Splitting positions across assets reduces pressure and makes price movements easier to tolerate.
7. Working on emotions directly. Meditation, sports, walks, proper sleep — they might sound trivial, but psychological resilience is built on these habits. A tired trader is far more likely to make poor decisions.
The market is chaotic only for those who approach it without a system. When you have an algorithm that highlights key zones, identifies trend shifts, and guides trade management step by step, emotions fade into the background. This is what transforms trading from a stressful lottery into a structured process. The core idea is simple: cold calculation instead of emotions, an algorithm instead of chaos, technical analysis instead of guesses. Everything else follows from that choice.

Crypto Market Drops Without News: External Factors Back in PlayToday we’re seeing a synchronized decline across the crypto market. Major altcoins and Bitcoin have dropped on average 2–4%, while some assets corrected even deeper — up to -9%. What’s notable here is the absence of significant crypto-related news that could justify such a sharp move.
This type of action often points to external influences. In this case, it’s geopolitics: escalation in the Middle East, where Israel has launched active military operations against Yemen. For global markets, events like this typically trigger risk-off sentiment, pushing investors toward safer assets. Cryptocurrencies, despite their popularity, are still perceived as high-risk instruments, so we’re seeing capital outflows.
From a technical perspective, many assets had already entered overbought zones after the recent rally, meaning any external shock could serve as a trigger for correction. The market was essentially “looking for a reason,” and geopolitics delivered one right on time.
For now, this looks more like a technical correction on news-driven noise rather than the start of a major bearish trend. Still, caution is warranted: volatility may remain elevated in the coming days, with potential for false moves in both directions.
The key takeaway is risk management. In periods like this, it’s wiser to reduce position sizes, lock in partial profits, and monitor how the market reacts to support levels. Geopolitics rarely dictates the long-term direction of crypto, but it often acts as a powerful short-term catalyst.

BTC/USDT: Wave V warming up> Wave count structure: Current analysis places BTC in green wave V, with wave IV confirmed as valid as long as price stays above 108,790.
> RSI support: Presence of bullish RSI divergence reinforces the case for wave IV completion and the start of a new impulsive leg higher.
> Key invalidation level: A break below 108,790 would invalidate this count and suggest a deeper correction or alternate structure is in play.
> Target projection: If the current wave V unfolds as expected, the bullish target is a new all-time high above 124,000.
> Setup bias: As long as BTC holds above support and RSI maintains divergence, traders may consider buying pullbacks with stops below 108,790 in anticipation of trend continuation.

Bitcoin : Stay heavy on positionsThe market continues to hold support at the prior short-term overbought resistance zone, attempting to stage a rebound. I’ll maintain my position with the same outlook as before.
Bitcoin : Stay heavy on positions (2x)
** This analysis is based solely on the quantification of crowd psychology.
It does not incorporate price action, trading volume, or macroeconomic indicators.

BTCUSDT – Decision Point: Spring or Breakdown? BTCUSDT – Decision Point: Spring or Breakdown?
Bitcoin is standing at a make-or-break zone ⚡ – the thin line between a massive rebound 🔥 or a trend failure 🩸.
📍 Key Levels
Support (Buy Zone): 113,000 – 113,200
Stop Loss: below 112,500
Resistance / Take Profit: 118,800 – 120,000
📈 Technical Outlook
Price is testing a strong Demand Zone around 113k.
EMA200 (1H) near 115.4k acts as dynamic resistance → breakout confirms trend shift.
RSI & Stochastic bouncing from oversold = early sign of buyers stepping in.
Potential Inverse Head & Shoulders forming → a breakout above 118.8k could trigger a strong bullish reversal.
💡 Wyckoff Insight
This could be a “Spring Phase” – shaking out weak hands before launching higher 🚀.
If 113k holds → we may witness the start of a new bull leg.
🔥 Quick Takeaway
👉 “113k = Life Support | 118.8k = Steel Wall | Breakout = The Bull is Back!”
--------------------------------------------------------------------------------------------
BTCUSDT – จุดตัดสิน: เด้งแรง หรือ หลุดเทรนด์?
Bitcoin กำลังอยู่ในจุด “เสี่ยงชี้ชะตา” ⚡ ระหว่าง รีบาวด์ครั้งใหญ่ 🔥 หรือ การหลุดเทรนด์ 🩸
📍 แนวรับ-แนวต้านสำคัญ
Buy Zone (แนวรับ): 113,000 – 113,200
Stop Loss: ต่ำกว่า 112,500
Take Profit (แนวต้าน): 118,800 – 120,000
📈 การวิเคราะห์เชิงเทคนิค
โซน 113k = Demand Zone เดิมที่เคยดันราคาขึ้นแรง
EMA200 (1H) แถว 115.4k = ด่านสำคัญ ถ้ายืนเหนือได้คือการเปลี่ยน Trend
RSI & Stochastic ดีดขึ้นจาก Oversold → สัญญาณแรงซื้อเริ่มกลับมา
มีโอกาสเกิด Pattern Inverse Head & Shoulders → ถ้า Break 118.8k = เทรนด์กลับขึ้นจริง
💡 Insight
นี่อาจเป็น “Spring Phase” ของ Wyckoff → จุดที่ตลาด “หลอกให้กลัว” ก่อนจะดีดแรง 🚀
ถ้า Support 113k เอาอยู่ → อาจเป็นการเริ่มต้นรอบกระทิงใหม่ 🐂
🔥 สรุปสั้น ๆ
👉 “113k = เส้นชีวิต | 118.8k = กำแพงเหล็ก | ถ้าทะลุ = กระทิงกลับมา!”
📌 Hashtags
#BTCUSDT #Bitcoin #CryptoTrading #TechnicalAnalysis #BTC #PriceAction #Wyckoff #InverseHeadAndShoulders #CryptoSignal #BTCAnalysis #BuyTheDip #CryptoBreakout #CryptoTrend #CryptoCommunity #คริปโต #บิทคอยน์ #แนวรับแนวต้าน #กราฟบิทคอยน์

FunTrade very Low Probability the price wont reach thereThis BTCUSDT setup is more like a funtrade ngl. Chances are the pending order won’t even trigger, and if it does… most likely it’ll hit SL. So yeah, just treat this one as entertainment
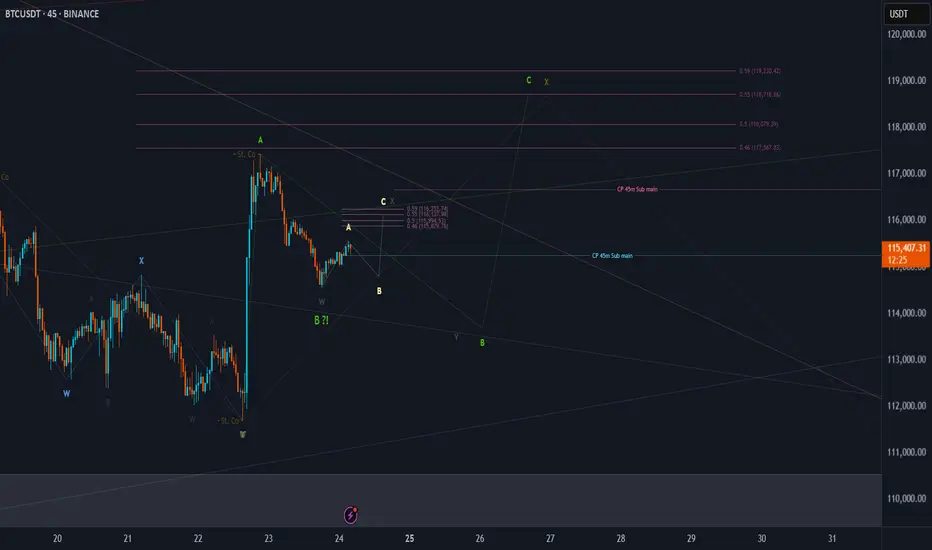
BTC Price Prediction and Elliott Wave AnalysisHello friends,
>> Thank you for joining me in my analysis.
- As we had explained in my last idea, and Ended the extension wave for Blue wave wxy, then reversed and broke 115900, as I mentioned as a first indication.
- I am waiting to see the formation of the Brown wave X, will it be Brown X and then back to Brown Y ? Or will have the confirmation of starting the final wave C to end the total bullish counting as the final top.
>> Reminder:
* For the biger imagination of the BTC path, we are still moving into the Orange wave A of the final White C for ABC from its begining.
* For the smaller imagination of the BTC path, we are still moving into the Blue wave C of the final Green C for the upper Orange wave A.
* For the tighter imagination of the BTC path, I think we are still moving into the correction wave B for the upper Blue wave C.
Keep liking and supporting me to continue. See you soon!
Thanks, bros
what's the reaction of price after breakout 70% bullish I Thinksteam of buyers are getting slow, however I believe manipulation to get bullish to 119K before hunting liquidity down to 89K

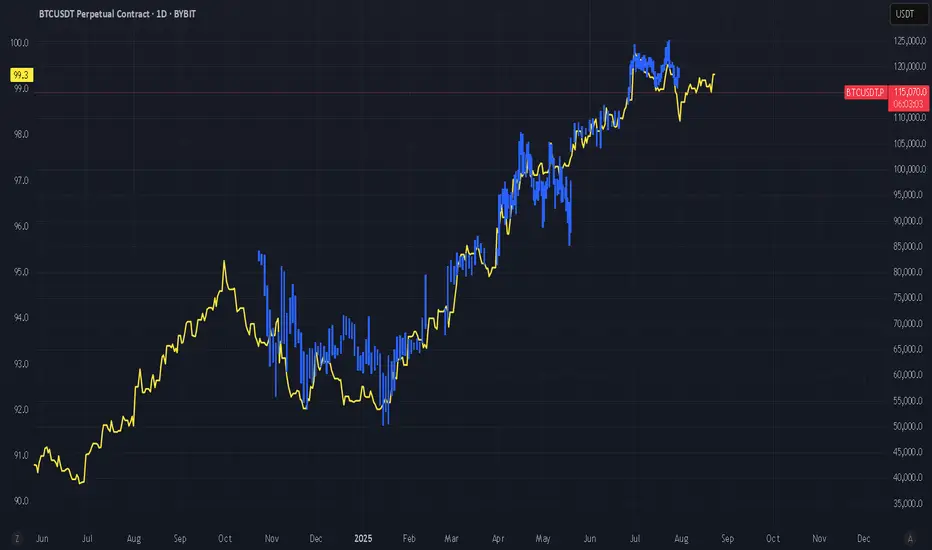
Is a Bitcoin correction still on the horizon?The chart below compares BTC price (blue) and US M2 money supply (yellow). Historically, Bitcoin’s movements have closely tracked changes in US money supply, often with a few months’ lag. With current trends suggesting a potential divergence, a market correction could still be on the table.
Curious to hear your thoughts, where do you see Bitcoin heading next?
#crypto #bitcoin #btc #trading #analysis