BTCUSDT (30M) – Breakout & Retest | DROP YOUR THOUGHTS MUST?Structure | Trend | Key Reaction Zones
BTC broke out of the downtrend structure 🔻, confirming a shift in momentum.
Price retested the buying zone 💰 (around 114,800–115,000) and is now attempting a recovery.
Order block sits above 118K, a crucial zone for liquidity.
Market Overview
After a long bearish leg, BTC showed signs of reversal with a strong breakout move 🚀.
Bulls are eyeing higher targets if the buying zone holds.
Failure to hold above 114,800 may lead to further dips.
Key Scenarios
Bullish Continuation 🚀
Holding above 114,800–115,000 →
🎯 Target 1: 115,626
🎯 Target 2: 116,645
🎯 Target 3: 117,429 → 118,096 (Order Block Test)
Bearish Breakdown 🔻
If BTC loses 114,800 →
🎯 Retest of 112,400 zone possible.
Current Levels to Watch
Resistance: 115,626 → 116,645 → 117,429 ❌
Support: 114,800 → 112,400 ✅
⚠️ Disclaimer: This analysis is for educational purposes only. Not financial advice.
BTCUSDT trade ideas

BTCUSDT: Price Action Trade Bitcoin 121K!Hello friends, based on the price action levels and this phase change from a bearish mode and back to a broken level, Bitcoin is expected to reach the level of 121,000.

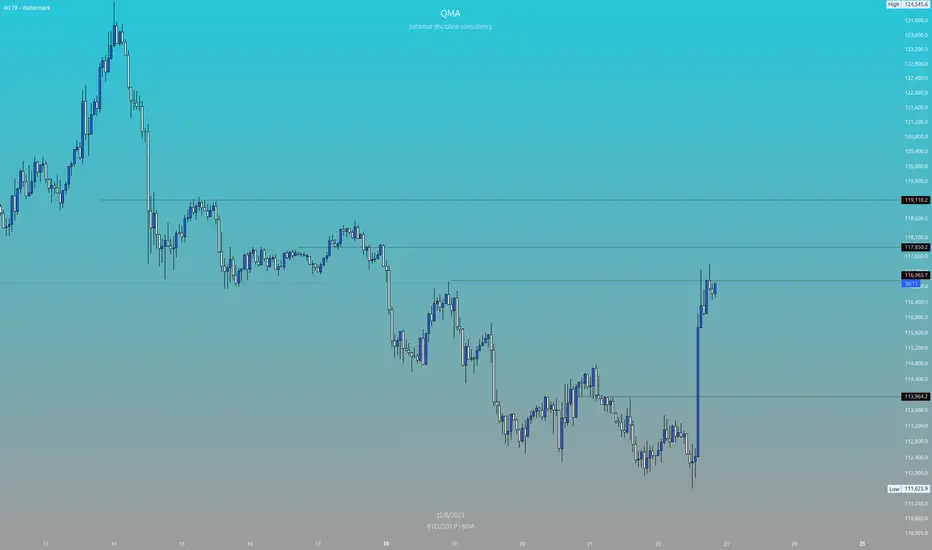
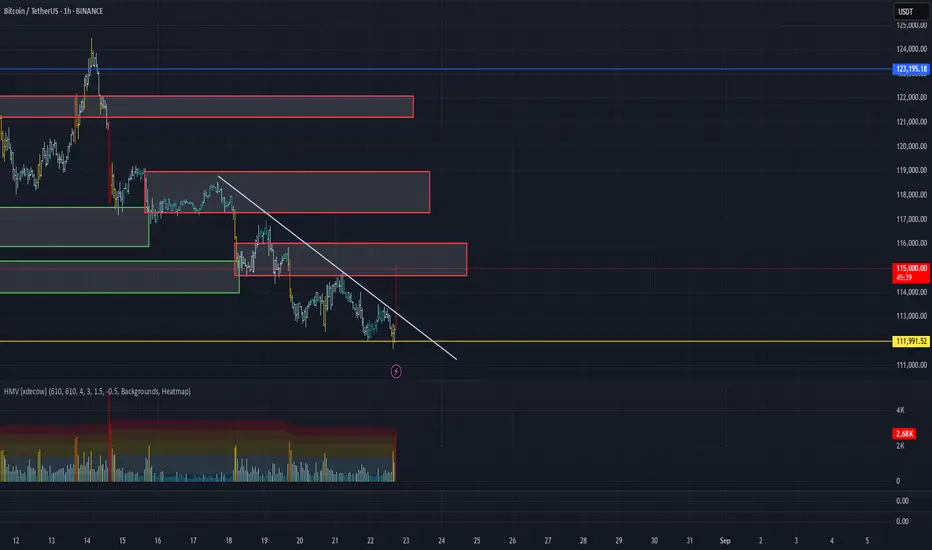
Thoughts on btc 💡 Fresh Insights on #BTCUSD 🪙
📈 Shifting Market Dynamics: Potential Upside to 125K...
———————————————
Following a deceptive drop below support—a scenario I highlighted in my previous analysis—and buoyed by dovish signals from Powell, BTC surged from 112K up to 117K.
In the wake of Powell's address, which flipped the fundamental outlook to bullish, Bitcoin shattered the short-term downtrend, sparking a climb to 117K. The momentum has since tapered off, leading into a pullback amid the weekend's reduced trading volume. That said, the optimistic fundamentals remain a key factor for upcoming moves. Easing interest rates might provide a solid boost to the market...
From a technical standpoint, after probing the 112K area again and creating that fakeout breakdown, Bitcoin has flipped the overall sentiment. By sweeping liquidity and dismantling the nearby bearish pattern, the setup now tilts toward the bulls. Key targets on the radar include 117.8K, 120.27K, and up to 125K.
Resistance Zones: 117K, 117.86K, 120.27K
Support Zones: 114.6K, 111.9K
Should the bulls defend the price above the top of the recent range—staying over the descending channel and the 114.6K level—during this dip, buying pressure could ramp up. Overall, the market shows promise for challenging the upper boundaries of the broader range.

BTC USDT LONGHello my friend. Pivot failure and pullback to pivot $11.4961. I buy on lower timeframes seeing price action pattern.

eliot chart btcusdtWe are at the end of wave 2 of the main microwave a and after the end of these 5 microwaves we will see a very heavy market drop.

BTC SHORT : More Downside? Yesterday's bullish action looking more and more like an impulse move rather than actual trend continuation.
Price made a rapid attempt at breaking past supply zone at $116/117000 area. Doesn't look like a clean break though, bearish engulfing formed at this price point hints at further downside. Will we see $107000?

BITCOIN'S FALL HAS BEGUN ! DON'T GET CAUGHT UP IN THE BLOODBATH JPowel's rate cut hints that something bad is about to happen. All Fed Rate cuts have been marked by devastating market crash and this time will be no different. Don't lose your hard-earned money to the upcoming carsh !! You have been warned.
Disclaimer: Not financial advice.

BTCUSDT. Find the differences.Hi traders and investors!
On the left — March 3, 2025.
On the right — August 23, 2025.
Same structure, different time.
👉 What happened after March 3?
Will we see the same outcome now — a pullback all the way to the start of the move — or is the market setting up a different scenario this time?
Wishing you profitable trades!

BTCUSDT (2H) – Breakout in PlayStructure | Trend | Key Reaction Zones
Market completed a long accumulation zone 🏦 and later formed a sharp rally with new HHs (higher highs) 📈.
Price reached ATH liquidity zone but rejected
Recently, a downtrend was broken ✅ and BTC retested the order block around 118K.
Market Overview
Current price is near 115.8K, holding above the breakout structure.
Market is at a decision zone → continuation higher vs deeper retracement.
Key Scenarios
Bullish Continuation 🚀
If BTC reclaims 116.9K, upside momentum may extend.
🎯 Target 1: 118.0K (Order Block)
🎯 Target 2: 120.5K zone
Bearish Breakdown 🔻
Rejection from 116.9K → retracement lower.
🎯 Target 1: 114.8K
🎯 Target 2: 112.7K (Breakout base)
🎯 Extended Target: 110.5K liquidity zone
Current Levels to Watch
Resistance: 116.9K → 118.0K ❌
Support: 114.8K → 112.7K ✅
⚠️ Disclaimer: This analysis is for educational purposes only. Not financial advice. Do your own research before trading.

BTCZ looks very interesting RIGHT NOWBTC looks like it had a decent day, but just like everything that goes up, it must come down. The technicals look ripe to drop (candle length, wick, crossing 9SMA etc.) and signals UltraShort show weakness (clearly seen here). Easy trade!

Double Bottom may of been what ruined that latest prediction I knew something weird was happening after watching the AI DOMINATE for 6 consecutive weeks...
Then it didn't...which had me really confused.
Now that time has passed I see that it was a mischievious damn double bottom that arrived to shake things up.
Haha, its the market that failed, not the AI hahahha. My AI's an angel ;)

BTC/USD 1H Key Levels to WatchResistance Zones:
$119,082 - Major resistance, watch for rejection
$117,857 - Secondary resistance level
$116,940 - Intermediate resistance
Support:
$114,000 - Critical support zone
Current Setup:
Price action around these levels will determine next directional move. Clean break above $119k could signal continuation higher, while failure to hold $114k support may lead to further downside.
Trade Plan:
Watch for volume confirmation on any breakout attempts
Look for rejection/bounce signals at key levels
Manage risk accordingly
Not financial advice. DYOR.
BTC Breakout Watch🚨 BTC Breakout Watch
Massive volume spike. Clean breakout. Now it’s all about follow-through.
📍The Alpha View:
In the 1/2 hour, these levels matter:
✅ Above Green Line→ Bullish🐂
🟡 Above Yellow Line → Cautiously Bullish
🟨 Below Yellow Line → Cautiously Bearish
😡Below Red Line → Bearish 🐻
This is where momentum decides who owns the next move — bulls must hold the line, or it’s just another fakeout in disguise.
➼Stay Sharp. Stay Disciplined. Stay Ready.

BTCUSDT Expanded Flat Correction may be overBear with me (pun intended). I know I'll probably get some slack from the 5 wave correction counting of wave C. Most people would place the 3rd wave in June instead of May, but a few things suggest me that the 3rd wave down was actually in May:
This C wave lies at the 123.6% extension of wave A which is a common area for the Expanded Flat correction.
Volume and RSI printing a divergence
2M RSI just broke out of its falling wedge
BTCUSDT resiliance at the 19k level, in contrast with the current equity price action & general sentiment, which goes against the previous sell offs of April and June
All of the above considered, there's still something missing : that the C wave should hold RSI divergence between wave 3 and 5 at completion, which did not happen with this counting. Also BTC would not only have be above the 19.3k resistance of the 123.6% extension of wave A (which is being rejected @ the moment) as it would also need to break & retest that yellow trendline (hands tied with the faster EMA's) that is holding its price down. But where is the fun in posting ideas when all of the cards are on the table? =D
All I'm saying is that this correction is closer to its ending than the other way around, and what I'm suggesting is that I wouldn't be surprised if it would be already over.
DYOR. Not advice

BTC/USDT Analysis. Testing a Key Low
Hello everyone! This is the CryptoRobotics trader-analyst, and here is the daily analysis.
Today, Bitcoin reached the key low at $112,000. There was almost no false breakout, but a local absorption from the buyer appeared, which led to a new wave of buying and a breakout above the descending trendline.
Currently, the price is approaching the $114,700–$116,000 sell zone (seller’s market activity), where another wave of pressure from the seller is expected. This will reveal how strong buyers truly are in the current context. Despite recent buyer activity, the overall market structure still leaves room for a potential squeeze into the $110,000–$105,000 support zone (accumulated volumes) or a retest of the recent low.
For now, it is better to observe how the balance of power unfolds and avoid long-term positions in Bitcoin.
Buy Zones:
$110,000–$105,000 (accumulated volumes)
Sell Zones:
$114,700–$116,000 (seller’s market activity)
$117,200–$119,000 (accumulated volumes)
$121,200–$122,200 (absorption of buys)
This publication is not financial advice.
BTCUSD UNDER STRONG BEARISH PRESSUREThe price of Bitcoin BTCUSD has been hit with a Rejection on Daily Time Frame after last week bull movement that hit $123346 price region as Resistance and traded downward to $112298 with inside pin bar on 4H Time Frame if the price close below $111345 we will see a more dive down to $105233 - $102453 price level.

BTCUSDmy short position in BTCUSD with Stop loss and Take Profit
Follow the Risk Management
RISK
Patience
Psychology

BAD NEWS for Bitcoin :(. BE CAREFUL!My last Prediction was PERFECT . i know this will UPSET many bulls, but this is how the MARKETS WORK. After a strong uptrend and extreme greed environment, its time for Bitcoin to CORRECT and have strong PULLBACK. Look at the channel and trendlines, I expect bitcoin to reach a price of 100k/96k in the coming weeks. That will be a GOOD BUY opportunity. BE CAREFUL AND STAY WISE.
See My Previous PERFECT prediction:
BINANCE:BTCUSD COINBASE:BTCUSD CRYPTO:BTCUSD OKX:BTCUSD

BTC correction august/septemberBTC has reached overbought territory, there is also bearisch divergence. It also didnt go above 123k anymore. i expect a correction in august/september.
dont chase FOMO, be prepared. Nothing goes in a straight line. there are always corrections.
CRYPTO:BTCUSD BINANCE:BTCUSD CME:BTC1! BINANCE:BTCUSDU2025

What is the Current BTC Satus? i am trading at Echobit exchange!#BTC
Bitcoin is clearly rejecting from ~$114k resistance on the Daily timeframe
CRYPTOCAP:BTC #Crypto #Bitcoin
im currectly trading on Echobit exchange now. you may follow it any time.

BTC Warning: Hidden Signals Before October’s Big Move!Right now, I’m leaning a bit bearish on BTC. Why?
I’m spotting a bearish divergence both on the daily and weekly timeframe.
Volume has also been drying up, which makes the move look a bit weak.
And historically… September tends to be shaky before October kicks in with that bullish momentum.
That said, I’ve marked key support zones in case BTC decides to dump before a bounce:
🔴 112,770 (0.236 Fib) – first line of defense
🟠 105,455 (0.382 Fib) – solid support zone
🟢 99,543 (0.5 Fib) – critical level to hold
🔵 93,631 – 92,028 (0.618–0.65 Fib) – last strong demand zone
So if BTC wants to test liquidity, these are the areas I’m watching closely.
👉 What do you guys think? Are you also seeing the same bearish signs, or do you think BTC skips the dump and runs straight into October bullish?
Drop your thoughts below ⬇️ and hit that follow if you’re tracking BTC moves with me. Let’s ride this market together. 💯


BTC WORSTCASE SCENERIOHello guys
How is the market...I know some of us are having this fear but i feel its the best time to buy in bits...so this is what i think but not a financial advice thou.
Now as we are experiencing a bear market things might get a little bit rough. As btc losing its strength in the market so in my own case the best places to get a smart buy are within the $73k zone (worst case) , $93 or $96k zone ( A bit fair) and risky zones @ $110k, $108K AND $100K ZONES ...As BTC will try to want to fill up 50% of its imperfect move in the last bull run ...so i suggest you load your bags at this zones and we might see another move to $150k region and we will now enter the bear market..... My thoughts
