BTCUSDT trade ideas
BTC CME / FVG levelsHi,
Here are some 4 hour FVG / CME levels I found on BTC, just to have an overview over the levels in case of bull, in case of bear, etc..
Price don't have to respect these levels, but usually does, in accordance with ICT market maker / smart money algorithm theory.
Have a great day, and good luck trading!

Short term bitcoin move Bitcoin has landed on a support coupled with a trendline at 112000…
It will make an attempt to retest the upper trendline at around 114000 before finally dumping to 107500…

pullbackI think the next bit will have a correction period and the price will not hold the $120,000 floor.

Bitcoin Go 70k Bitcoin repeats the pattern again and MACD is showing us a big drop and RSI is also showing negative divergence on the weekly chart.
Bitcoin Go 70k
70
70
70

MVRV Demystified: A Guide to Tops, Bottoms & RiskFinancial nerds love to give tools weird names to make them look like fortune-tellers. Some actually are predictive—like grandma’s dreams!🌙 I’m Skeptic from Skeptic Lab , and today we’re talking about MVRV .. First off, it can’t predict the future , but it tells you four key things:🔮
Identifying market tops and bottoms
Assessing market sentiment
Trading strategies
Risk management
What is MVRV? 🔍
Imagine you have a box of chocolates. You want to know how many you have and what they’d be worth if everyone decided to buy or sell.
MVRV is a number that shows: “How the current value of everyone’s chocolates compares to the price they originally paid.”
High MVRV → people are selling chocolates for much more than they paid → expensive market.
Low MVRV → people are selling for less than they paid → cheap market, potential buy zone.
In short: MVRV is like a green/red light for buying and selling chocolates 🍫🚦.
The Formula ➗
Market Value (MV): total value of all coins at current market price.
Realized Value (RV): total value based on last on-chain transaction price — a "truer" cost basis, filtering out short-term volatility.
Why Z-Score? ✨
MVRV alone sometimes misleads:
In bull markets , it can stay high for weeks → fake sell signals.
Low MVRV can just be short-term noise.
One week after MVRV was introduced, David Puell and Murad Mahmudov created the MVRV Z-Score. It standardizes MVRV against historical mean and volatility, showing if current levels are truly abnormal.
Z > 7 → speculative top
Z < 0 → deep undervaluation, potential bottom
Applications 🎯
Spotting Tops & Bottoms:
High MVRV (>3.5) = late bull top
Low MVRV (<1) = bear bottom, strong buy
Z-Score filters extremes
Market Sentiment:
High = greed, low = fear → emotional barometer
Trading Moves:
Long-term: buy <1, hold
Medium-term: sell >3.7, buy <1
Timebound MVRV (365d, 60d) shows short vs long-term holder pressure
Risk Management:
Identifying potential profit zones Checks if BTC is overpriced/undervalued vs RV
Works best combined with SOPR, NVT, macro factors
Limitations 🌡️
Sensitive to volatility
Assumes on-chain movements = sales (not always)
Blind to shocks (regulations, macro events)
Overvaluation can persist → mistimed sell signals
Needs historical data → weak for new coins
Not standalone → combine with other metrics
Conclusion 📍
MVRV compares Market Value to Realized Value → shows over- or undervaluation
Identifies market tops and bottoms
Z-Score filters noise, highlights abnormal levels
Historically effective in Bitcoin cycles
Best used with other metrics for holistic analysis
Boost for more Skeptic takes :) 📈
Disclaimer: This article was written for educational purposes only and should not be taken as investment advice.

btc is heading for double red (RT-Tool) Btc is on its way to double red after the failed reclaim of the upper blue extension !

Does this looks like a wyckoff pattern? The way i look at it:
1. Follows the market structure
2. It's a long term trader setup
3. Similar to chart pattern of Wyckoff
This chart has been in analyzed from monthly to H4. H4 has cross the EMA, to 'short' but D1,W1 and M1 still carry 'Bull'.
Therefore, it depends on what type of trader are you and your entry should follows it.
Follows price action and see the bigger market structure for money magnet area.

BTC 8H – Testing Key Support, Will Bulls Defend or Breakdown?BTC is once again retesting the 114k–112k support block that has held multiple times since July. Price is consolidating at this major level, with buyers attempting to absorb sell pressure.
Support Zone: 114k–112k remains critical for continuation.
Resistance: Next hurdle sits around 123k supply.
Downside Risk: A clean breakdown targets 105k demand.
Momentum: Stoch RSI shows oversold conditions, suggesting a potential bounce.
The next move depends on whether bulls can reclaim momentum at this support, or if bears force a deeper sweep toward the lower demand zone.

BTC Triple Top Loading? | Key Fibs & Order Blocks in PlayCRYPTOCAP:BTC Triple Top in Progress? 🚨
Price bounced from the 111K–113K order blocks and is now heading toward key resistance:
🔹 0.5 Fib – 117.5K
🔹 0.618 Fib – 118.9K
🔹 Final boss = Triple Top at 122.4K 👀
Smart money may hunt liquidity before rejection.
Watch closely:
🧠 Rejection = short opportunity
🚀 Breakout = bullish continuation
Set alerts. Be patient. Let the setup come to you.

Bitcoin going back homeMy analysis indicates that there is a high chance that Bitcoin starts a major correction right now.
This is not financial advice; do your own research.
Price should plummet ~30% in the next 6 weeks.
This idea can be totally wrong, and the upside move can continue, but the probability makes it worth it for me to take the risk, so I'm going short.
What do you think will happen in the next 6 weeks?
A. We will see a new ATH.
B. Nothing will happen; the price will go sideways.
C. The price will break down the 100k support.
Let me know in the comments.

Bitcoin's Technical Trajectory: Analysis for Q3-Q4 2025Breaking New Records: Bitcoin's Path Beyond the August Correction
With Bitcoin currently trading at $114,352 after reaching its all-time high of $124,474 on August 14, 2025, we find ourselves at a critical technical juncture. Ill examine Bitcoin's potential trajectory through the remainder of 2025.
Current Market Context
Bitcoin has climbed from around $85,000 in January to establish a new all-time high of $124,474 in mid-August. Following this peak, we've seen a corrective phase with price action forming a potential bull flag pattern between $112,000-$118,000.
The most recent data shows Bitcoin trading around $114,352, representing a pullback of approximately 8.13% from the all-time high. This moderate retracement suggests a healthy reset rather than a reversal of the primary trend.
Ichimoku Cloud Analysis
The Ichimoku Cloud indicators provide critical insights:
• Tenkan-sen: $114,127.92
• Kijun-sen: $115,477.50
• Senkou Span A: $119,324.70
• Senkou Span B: $120,176.36
The price is currently trading below the cloud, indicating short-term bearish sentiment. However, the relatively narrow cloud formation ahead suggests potential for a breakout if Bitcoin can reclaim the $119,324-$120,176 range.
Wyckoff Analysis
The price action following the August peak displays characteristics that align with Wyckoff re-accumulation rather than distribution:
• Initial decline represents a "Preliminary Support" phase
• Trading range between $112,000-$118,000 shows decreasing volatility
• Volume characteristics show diminishing selling pressure
• Recent price action suggests we're approaching the "Spring" phase
This structure indicates institutional accumulation is still occurring at these elevated levels, projecting a move toward the $132,000-$145,000 range in the coming months.
Supply/Demand Zone Analysis
Critical price levels that will influence Bitcoin's next directional move:
• Major demand zone: $114,600-$116,700 (Fibonacci 61.8%-78.6% retracement)
• Secondary support: $111,920-$114,000 (recent low and psychological support)
• Primary resistance: $124,474-$127,889 (all-time high region and 127.2% Fibonacci extension)
Moving Average Analysis
The moving average configuration reveals a strong underlying bullish structure:
• 4H EMA 50: $116,284.41
• 4H EMA 100: $116,781.30
• 4H EMA 200: $116,214.57
• Daily EMA 50: $114,939.55
• Daily EMA 100: $110,513.11
• Daily EMA 200: $103,162.36
The hierarchical alignment of these moving averages confirms the primary bull trend remains intact. The current price is finding support near the Daily EMA 50, a critical level that has historically served as a springboard during bull markets.
Fibonacci Extension Framework
Potential targets using Fibonacci extensions from the recent swing points:
• 127.2% extension: $127,889
• 161.8% extension: $132,232
• 200% extension: $137,028
• 261.8% extension: $144,786
Elliott Wave Analysis
The current price action suggests an extended wave structure:
• Wave 1 high (ATH): $124,474
• Wave 2 low (Recent Low): $111,920
• Wave 3 target range: $144,786 to $157,340
• Wave 4 target: $132,231
• Wave 5 target range: $152,545 to $165,100
This wave count suggests potential for continued appreciation toward the $152,000-$165,000 range before a more significant corrective phase begins.
Bitcoin Dominance Factor
Bitcoin's market dominance currently stands at 59.3%, indicating a strong position relative to the broader cryptocurrency market, providing additional support for the bullish case.
Price Projection Timeline
August-September 2025:
Completion of the current consolidation phase with potential final support tests in the $114,600-$116,700 range. A decisive break above $120,000 would confirm the end of the consolidation phase.
October 2025:
Renewed momentum pushing Bitcoin toward the $127,889-$132,232 range, potentially coinciding with seasonal strength typically observed in Q4.
November-December 2025:
Final wave extension potentially reaching the $144,786-$157,340 range, followed by a Wave 4 correction before the final Wave 5 push toward $152,545-$165,100 by year-end or early 2026.
Key Levels to Monitor
Support Zones:
• Primary: $114,600-$116,700 (Fibonacci retracement zone)
• Secondary: $111,920-$114,000 (recent low and psychological support)
• Tertiary: $103,162-$110,513 (Daily EMA 100-200 zone)
Resistance Zones:
• Immediate: $119,324-$120,176 (Ichimoku Cloud base)
• Secondary: $124,474-$127,889 (all-time high region and 127.2% Fibonacci extension)
• Target 1: $132,232-$137,028 (161.8%-200% Fibonacci extensions)
• Target 2: $144,786-$157,340 (Wave 3 target range)
• Target 3: $152,545-$165,100 (Wave 5 target range)
Strategic Considerations
With Bitcoin having already achieved a new all-time high at $124,474 in August, strategic approaches might include:
• Maintaining core positions while implementing trailing stop strategies
• Adding to positions during retests of key support levels ($114,600-$116,700)
• Considering partial profit-taking at key Fibonacci extension levels
• Remaining vigilant for signs of distribution patterns at higher levels
Conclusion: The Path to $165,000
The weight of technical evidence suggests Bitcoin has entered a new paradigm of price discovery. While the path may include periods of consolidation and volatility, the underlying trend remains firmly bullish with multiple technical frameworks projecting targets in the $152,000-$165,000 range by year-end 2025 or early 2026.
The current correction phase represents a healthy reset rather than a trend reversal, creating an ideal technical foundation for Bitcoin's next major advance. Bitcoin appears well-positioned to achieve new record highs in the coming months.
BTC still has some steam?Is the pullback over and does BTC still have bulls left? BTC is hovering close to the 50 EMA? The Stochastic indicator is near oversold levels. The RSI is not too far from 50. The probability for the bulls to step back is there, however, we need some price action above the 50 EMA 114, 938.

BTC Price Prediction and Elliott Wave AnalysisHello friends,
>> Thank you for joining me in my analysis.
- Until now, we are still moving in the extension of micro wave Blue Y as the White wxy. I don't have any sign to replace ending of Grey wave W with Brown wave W, just I need to break 115900 and keep above it to detect that starting the Brown wave X or Ending the correction Orange Y totally.
>> Reminder:
* For the biger imagination of the BTC path, we are still moving into the Orange wave A of the final White C for ABC from its begining.
* For the smaller imagination of the BTC path, we are still moving into the Blue wave C of the final Green C for the upper Orange wave A.
* For the tighter imagination of the BTC path, I think we are still moving into the correction wave B for the upper Blue wave C.
Keep liking and supporting me to continue. See you soon!
Thanks, bros

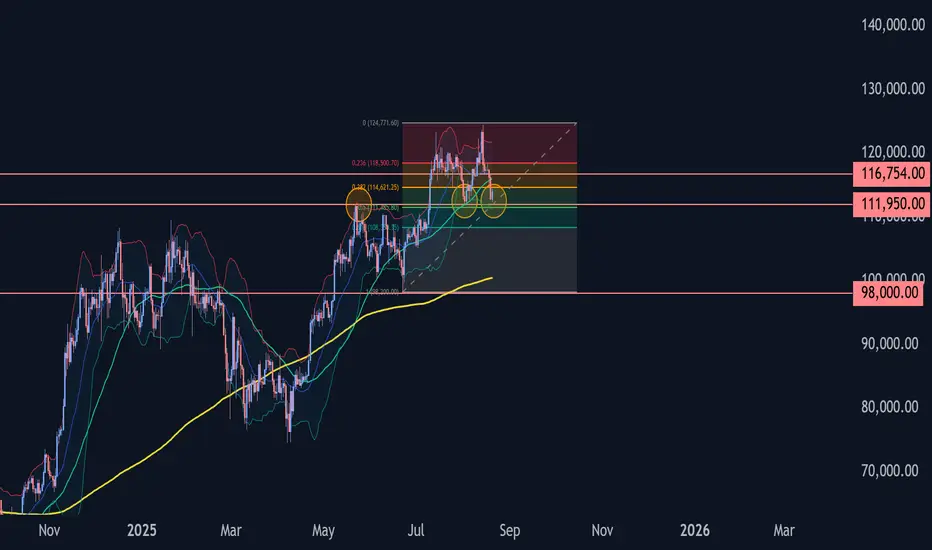
Bitcoin Wave Analysis – 20 August 2025
- Bitcoin reversed from support zone
- Likely to rise to resistance level 116754.00
Bitcoin cryptocurrency recently reversed from the support area between the pivotal support level 111950.00 (former monthly high from May, which stopped earlier wave 2) and the lower daily Bollinger Band.
This support zone was further strengthened by the 50% Fibonacci correction of the previous upward impulse from June.
Given the clear daily uptrend, Bitcoin cryptocurrency can be expected to rise to the next resistance level 116754.00.
BTC/USDT Analysis. Continuation of Decline
Hello everyone! This is the trader-analyst from CryptoRobotics, and here is the daily analysis.
Yesterday, Bitcoin once again tested the ~$115,000 level, but buyers showed no significant reaction, and selling pressure continued to dominate. At the moment, the price has dropped below the $115,300–$114,000 support (accumulated volumes) and is approaching the $112,000 level, which is likely to be tested soon.
Below that lies a key zone — $110,000–$105,000 (accumulated volumes), where a buyer’s reaction is to be expected. It’s worth noting that the decline is accompanied by weak volumes and ongoing limit absorption of sell orders, which makes $118,000 the main “liquidity magnet.” In the case of a full rebound, this will be the primary upside target, while other resistance levels are viewed only as local corrective zones.
For now, buyer activity remains insufficient for a trend reversal, so in the coming days we expect a test of the recent lows.
Buy Zones:
$110,000–$105,000 (accumulated volumes)
Sell Zones:
$114,700–$116,000 (seller’s market activity)
$117,200–$119,000 (accumulated volumes)
$121,200–$122,200 (buyer absorption)
This publication is not financial advice.

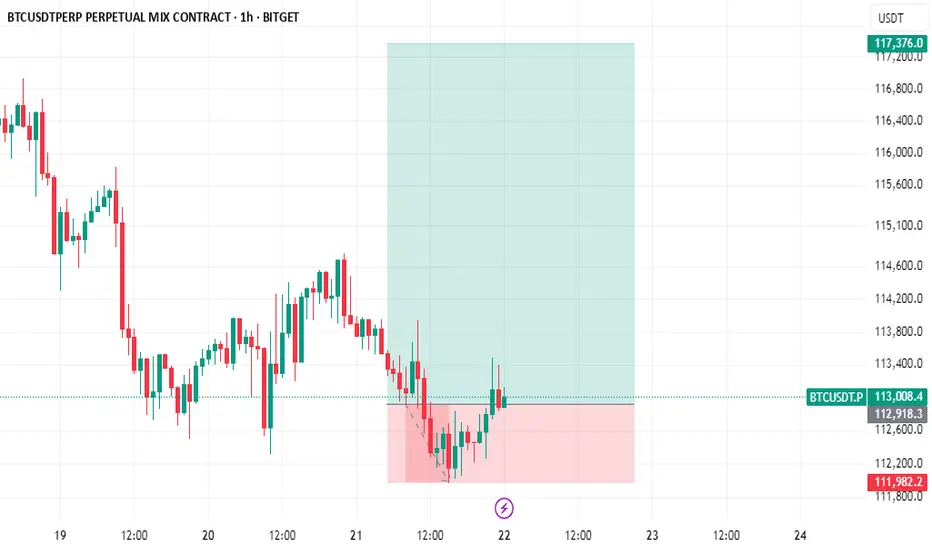
BTCUSDT 1H🔎 Chart Context
• Pair: BTC/USDT
• Exchange: Binance
• Timeframe: 1H (intraday)
• Date: 20 August 2025
• Current price: ~113,578
The chart uses Fair Value Gaps (FVG), Change of Character (CH), Supply/Demand blocks, and liquidity sweeps to track short-term moves.
📊 Key Observations
1. Overall Structure
• BTC is in a clear short-term downtrend on the 1H timeframe.
• Price broke down from 116,500–117,000 supply block, confirming a bearish CH 1H.
• Since then, the structure has been forming lower highs and lower lows.
2. Fair Value Gap (FVG)
• An FVG is marked near ~115,500–115,800.
• Price is currently trading well below this zone.
• Typically, market tends to retrace into FVG zones before resuming the main direction (here: bearish).
3. Liquidity Levels
• Above: Liquidity around 115,000–115,800 (FVG) → potential pullback target.
• Below: Liquidity pools near 112,000–111,000 demand block.
• A deeper liquidity sweep could reach 110,500–111,000, marked as the downside magnet.
4. Support & Demand Zones
• 113,000–112,000: Nearest minor support.
• 111,000–110,500: Major demand block, strong liquidity resting here.
5. Resistance & Supply Zones
• 115,000–115,800 FVG zone: Key intraday supply area.
• 116,500–117,000: Higher timeframe supply where the breakdown started.
📈 Bullish Scenario (Countertrend Relief Rally)
• If BTC defends 113,000 support, expect a bounce into 115,000–115,800 FVG.
• This would be a retracement move, not a trend reversal.
• Path: 113,000 → 115,000–115,800 → rejection.
• Only a clean reclaim of 117,000 CH zone would flip short-term bias bullish again.
📉 Bearish Scenario (Higher Probability)
• Trend is already bearish, so the likely path is:
1. Short retracement into 115,000–115,800 FVG.
2. Continuation lower toward 112,000.
3. Final sweep into 111,000–110,500 demand zone (major liquidity target).
• This scenario is also drawn on your chart with the projected arrow.
⚡ Trading Plan
• Short Setup (Preferred):
• Entry: 115,000–115,800 FVG zone.
• TP1: 113,000
• TP2: 112,000
• TP3: 111,000–110,500 demand
• Stop: Above 117,000 (CH invalidation).
• Long Setup (Risky, Countertrend):
• Entry: 111,000–110,500 demand zone.
• TP1: 113,000
• TP2: 115,000 FVG
• Stop: Below 110,000

Reversal comingON THE MOVE
This is the area where BTC reverses from, as long as it stays internal.
Anticipate for a reclaim above the S/R flip
Alts are bleeding, might be a good idea to start DCA

Afterlife 1 - Life after BTC>$100KHere are my thoughts laid out briefly. I feel there are 3 possible moves to the market:
1. Bullish - 50 bp rate cut into September followed by a mild bull season into $140K, followed by mania in December. Alts see 2x-3x (HYPE at $100)
2. Neutral/Slightly bearish that will murder alts - BTC drops to $100K or lower to reset the RSI and kill momentum. Alts -50% across the board. HYPE at $20. This builds confidence for BTC to be at $300K at the end of 2027 and will provide massive long term entry opportunities.
3. Full bear case - Strategy/Saylor unable to keep mNAV>1, stock tanks forcing Saylor to either dilute stalk or change paths meaningfully into bidding less(which is kind of already happening)/selling BTC. Alts -99% (think HYPE at $5)
I know this is a wide range but I think volatility will expand meaningfully very soon to fix the matter of RSI consolidation above $100K. This is a test for BTC in a sense - we are expecting BTC to show resilience to rate cuts, macroeconomic factors and the "eternal" institutional demand/supply game. It is a tough ask for any asset.
My current positioning is stabled out fully awaiting one or more of the above to be true.

BTCUSDT | 1H Outlook /BEARISH CONTINUATION FORMATION OF LH/LL🔍 Structure | Trend | Key Reaction Zones
BTC continues to respect a bearish structure, shifting from Higher Highs to Lower Highs & Lower Lows.
🧠 Market Overview:
After the ATH sweep, BTC dropped from the consolidation zone.
Price is struggling to reclaim momentum above $115,950–$116,500.
Current level around $113,600 is holding, but pressure remains to the downside.
🎯 Key Scenarios:
🔻 Bearish Continuation (Main Bias):
If BTC stays under $115,950–$116,500, next key levels:
KEY POINTS:
Target 1: $113,000
Target 2: $112,500
Target 3: $112,000
🔼 Bullish Recovery (Invalidation):
Reclaiming $117,300 could flip momentum back up toward $118,100, invalidating short-term bearish pressure.
📌 Current Levels to Watch:
Resistance: $115,950 → $117,300
Support: $113,000 → $112,500 → $112,000
⚠️ Disclaimer: This analysis is for educational and informational purposes only. It is not financial advice. Please conduct your own research before trading.

BTC Liquidity IdeaI think BTC will play for both of the traders, will take the liquidity from both lower and higher.
From the lower first is, of course, it will make some patterns, and then from the top, of course, whales are not gonna make these new highs.

BTC/USDT Short Trade Idea🔻
Pair: BTC/USDT (Bybit Spot)
Chart: 15m, Heikin Ashi
Trade Setup:
Entry: 113,200 – 113,400
Stop Loss: 114,200
Target 1: 112,000
Target 2: 111,500
Risk/Reward: ~1:2
Analysis:
BTC remains in a bearish trend with lower highs and EMA resistance on the 15m chart. MACD momentum supports continuation to the downside. A rejection from the 113.2–113.4k zone offers a short opportunity with defined risk.
⚠️ Disclaimer: This is not financial advice. Manage risk and size properly.

Elliott man in tahlil ro yek mahe keshidm screnesh has
nemizare trding benevisam
eslah be nafe roshde...
