A daily trading plan: stop trading your moodA daily trading plan: stop trading your mood and start trading your system
Most traders think they need a new strategy. In many cases they need a clear plan for the day.
Trading without a plan looks very similar across accounts. The platform opens, eyes lock onto a bright candle, the button gets pressed. Then another one. The mind explains everything with words like “intuition” or “feel for the market”, while the journal in the evening shows a pile of unrelated trades.
A daily plan does not turn trades into perfection. It removes chaos. The plan covers charts, risk, loss limits, number of trades and even the trader’s state. With that in place, the history starts to look like a series of experiments instead of casino slips.
Skeleton of a daily plan
A practical way is to split the day into five blocks:
market overview from higher timeframes
watchlist for the session
risk and limits
scenarios and entry checklist
post-session review
The exact form is flexible. The important part is to write it down instead of keeping it in memory.
Market overview: higher timeframe sets the background
The day starts on the higher chart, not on the one-minute screen. H4, D1 or even W1. That is where major swings, large reaction zones and clear impulses live.
A small template helps:
main asset of the day, for example BTC or an index
current phase: directional move or range
nearest areas where a larger player has strong reasons to act
Descriptions work best when they are concrete. Not “bullish market”, but “three higher lows in a row, shallow pullbacks, buyers defend local demand zones”. A month later these notes show how thinking about trend and risk evolved.
Watchlist: stop chasing every ticker
Next layer is a focused list of instruments. With less experience, a shorter list often works better. Two or three names are enough for the day.
Selection can rely on simple filters:
recent activity instead of a dead flat chart
structure that is readable rather than random noise
enough liquidity for clean entries and exits
Once the list is fixed, outside movement loses some emotional grip. Another coin can fly without you, yet the plan keeps attention on the few markets chosen for that day.
Risk and limits: protection from yourself
This block usually appears only after a painful streak. Until then the brain likes the story about “just this one time”.
Minimal set:
fixed percentage risk per trade
daily loss limit in R or percent
cap on number of trades
For example, 1% per trade, daily stop at minus 3R, maximum of 5 trades. When one of these lines is crossed, trading stops even if the chart shows a beautiful setup. That stop is not punishment. It is a guardrail.
Breaking such rules still happens. With written limits, each violation becomes visible in the journal instead of dissolving in memory.
Scenarios and entry checklist
After the bigger picture and limits are set, the plan moves to concrete scenarios. Clarity beats variety here.
For every instrument on the list, write one or two scenarios:
area where a decision on price is expected
direction of the planned trade
SEED_ALEXDRAYM_SHORTINTEREST2:TYPE of move: breakout, retest, bounce
[*stop and targets in R terms
Example: “ETHUSDT. H4 in an uptrend, H1 builds a range under resistance. Plan: long on breakout of the range, stop behind the opposite side, target 2–3R with partial exit on fresh high.”
An entry checklist keeps emotions in check.
$ trade goes with the higher-timeframe narrative
$ stop stands where the scenario breaks, not “somewhere safer”
$ position size matches the risk rules
$ trade is not revenge for a previous loss
If at least one line fails, entry is postponed. That small pause often saves the account from “just testing an idea”.
Post-session review: where real learning sits
The plan lives until the terminal closes. Then comes the review. Not a long essay, more like a short debrief.
Screenshots help a lot: entry, stop, exit marked on the chart, with a short note nearby.
was there a scenario beforehand
did the market behave close to the plan
which decisions looked strong
where emotions took over
Over several weeks, this archive turns into a mirror. Profitable setups repeat and form a core. Weak habits step into the light: size jumps after a loss, early exits on good trades, stop removal in the name of “room to breathe”.
Where indicators fit into this routine
None of this strictly requires complex tools. A clean chart and discipline already move the needle. Many traders still prefer to add indicators that highlight trend, zones, volatility and risk-to-reward, and ping them when price enters interesting regions. That kind of automation cuts down on routine work and makes it easier to follow the same checklist every day. The decision to trade still stays with the human, while indicators quietly handle part of the heavy lifting in the background.
Market insights

EcoByG Bitcoin Daily Analysis #8 — Daily BTC Market UpdateWelcome to My Analysis.
Bitcoin just printed another lower high and slipped under key moving averages — the short-term structure is still bearish.
Let’s break down what the charts are actually saying.
Market Structure Overview
Overall Market Structure
The short-term market structure remains bearish.
Why?
Lower Highs formed at 92,800 → 92,300, along with moving-average breakdowns.
Lower Lows formed around 90,000, with a lower shadow reaching ~89,400.
After a strong sell-off, price has entered a small consolidation range, meaning the market is pausing after the drop.
Current Price Position
Price is sitting between two key support zones:
Support Zone 1: 89,750 – 90,000
Major Support Zone 2: 88,700 – 88,200
Price bounced from the top of the first support zone,
but there is no sign of a sustained reversal yet.
A key point:
After the strong decline, price fell below the 50 and 100 MAs and has failed to reclaim them.
This confirms sellers still have more control.
➤ Sellers
The drop from 92,200 came with large bearish candles and strong volume → clear selling pressure.
The recent crash candle had a long lower wick (some buying),
but the bounce candle had significantly lower volume than the sell candles.
➤ Buyers
Buyers defended the 89,700 level (long lower wicks).
But the bounce was weak and lacked conviction.
Buyers are only holding the floor, not reversing the trend.
📌 Conclusion:
Sellers currently have the upper hand; buyers are only defending, not attacking.
RSI (1H)
RSI has entered or approached the oversold area.
However, its upward reaction is weak.
This means:
Selling pressure has slowed (RSI rising slightly),
But there is no strength in the reversal (RSI still below mid-range, weak angle).
📌 Interpretation:
Expect range-bound movement or compression, not a fast bullish reversal.
✅ Final Summary
🔻 Current Trend: Short-Term Bearish
As long as price remains below 91,300, and especially below 92,000,
sellers stay in control.
🔸 Support Levels
First support: 89,700
Major support: 88,700 – 88,200
A breakdown → increases the probability of a sell-off toward 87,700.
🔸 Neutrality Trigger
A close back above 91,300 – 91,500 returns the market to a neutral state.
🔸 Bullish Trend Trigger
For a real shift to bullish structure → Bitcoin must reclaim 92,300.
⚠️ Risk Alert ⚠️
Futures are not beginner-friendly. These triggers require solid experience.
Before using them, study risk management and practice with the learning content here.

$BTC is hanging out on 4h & 12h bullish OB! CRYPTOCAP:BTC is hanging out on 4h & 12h bullish OB (demand zone)
Full detailed chart update coming later… but for now, sleep mode activated 😴
Stay connected.

$BTC: Price Action Saved Us! The only reason i told you not to top-buy was this. Yes, news was bullish 25 bps rate cut, but even then crypto market showed clear manipulation.
Real question is: how did we stay safe? And how did i know that top buying was risky?
Answer is very simple price action warned us trend was bearish and entire crypto market was sitting in a supply zone. Until trend shifts bullish, staying out is always the safer option. “Charts don’t lie” 💯
Alhamdulillah based on this, I gave you all an early alert so you wouldn’t top buy and end up selling low.

Bitcoin is in a downtrend and Ascending wedgeBitcoin is in a clear downtrend and below key moving averages like 20 WEMA, 34WEMA and below EMA ribbon and below previous low which is 98k. Now it is forming and ascending wedge pattern on 4H time frame which is very bearish. Fundamentally DATs are cooked, No ETF inflows (Mainly outflows), Whales still selling, Gold took the crown of hedge for money printing and with tokenized gold it becomes clear bitcoins narrative has being proven wrong. Until people accept bitcoin as a proper hedge downtrend will continue. Probably can buy bitcoin once Strategy start selling.

BTCUSDT SHORT📌 BTCUSD — Institutional Daily Analysis (MPI + ICT Framework)
(Professional Smart Money Market Breakdown)
1️⃣ Higher Timeframe Context
Bitcoin is currently trading inside a bearish dealing range:
Range High: 107,448 (Buy-side liquidity)
Range Low: 80,600 (Sell-side liquidity)
Within this range, price is in a retracement phase, not a reversal.
2️⃣ Market Structure (HH → LH → LL → MSS)
The structure confirms a bearish environment:
HH → LH → LL = bearish sequence
Liquidity sweep below
Internal swing high taken → MSS (Market Structure Shift)
This MSS indicates the start of retracement — not a trend reversal.
3️⃣ Internal Liquidity (94k–96k)
Price cleaned internal liquidity inside the 94k–96k range and confirmed
the internal dealing model (IDM).
This created the engine for a move into premium.
4️⃣ Premium Retracement Targets (FVG + OTE)
Institutional order flow suggests price will seek higher inefficiencies:
0.618 retracement: 97,190
0.705 OTE (Institutional Entry): 99,533
Daily FVG #1: 98k–100k
Daily FVG #2: 101k–103k
Possible sweep zone: ~100k
These are liquidity magnets before any major reversal.
5️⃣ Rejection Zone — Institutional Selling Area
A high-probability sell setup sits in the premium zone:
Daily FVG
0.705 OTE
Old support → new resistance
Breaker + inefficiency cluster
This area is the most likely region for a bearish rejection.
6️⃣ Higher Timeframe Draw-on-Liquidity
Once rejection occurs, institutional flow favors lower targets:
TP1: 80,600 (Range Low)
TP2: 76,000 (HTF imbalance)
TP3: 72,300 (Weekly EQ Low – March 2024)
Sell-side liquidity zone: 72k–76k
This zone is the long-term liquidity objective.
7️⃣ Summary
📉 Trend remains bearish
📈 Current move = retracement into premium, not reversal
🎯 Premium zone (98k–103k) = institutional sell area
🔥 Long-term targets: 72k–76k sell-side liquidity
This structure follows the classic ICT + MPI roadmap:
Sweep → MSS → Retracement → Premium → Rejection → Expansion Lower

#BTC Global analysis of BTC. Correction and decline to 65kBYBIT:BTCUSDT
BYBIT:BTCUSDT.P
COINBASE:BTCUSD
Bitcoin is currently in an uncertain phase for everyone, so I have analyzed the most likely outcome of the price movement in my opinion.
On D1, we see a downtrend and a reaction from support levels. As a result, Bitcoin corrected to the 0.5 Fibonacci level, after which it did not reverse the trend but continued to test the 0.5 level.
The trend short line on H8-D1 was broken after several serious touches, and now I am waiting for a retest from the 0.618 Fibonacci level and a further correction to 98500-100000, where the 0.618 and 0.702 Fibonacci levels are also located.
This is a serious resistance level for the price and the place where the structure (BOS) was broken. The price usually returns to this place for further movement along the trend.
I expect this scenario, as I have not noticed that the main cryptocurrency has gathered enough liquidity to update its highs and a global long scenario.
At levels 98500 - 100000, I expect a short scenario to levels 65000 - 75000.
From there, Bitcoin will likely delight us with a long-term outlook and attract a large number of investors.
In addition to this, it is known that a large number of investors hold stablecoins and are ready to buy Bitcoin. Until this happens, we can assume that investors and funds are waiting for a suitable favorable price for the main asset.

Bitcoin Short Setup – Why It’s Still Early📝 Bitcoin BINANCE:BTCUSDT Short Setup – Why It’s Still Early
At the moment, opening a short position on Bitcoin is premature.
This does not signal a buying opportunity here — it simply highlights that short positions (especially with leverage) carry high risk from this zone.
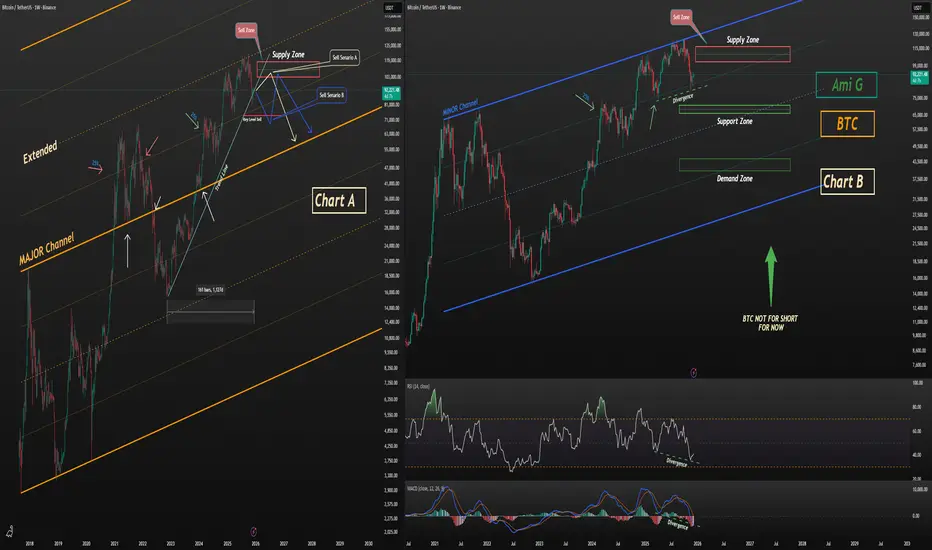
📊 Chart A – Major Channel Structure
Bitcoin is trading inside a major channel.
After breaking out of this structure and extending beyond it, price has shown clean and consistent reactions to the extended boundaries.
The latest rejection from the upper zone also aligns with the 50% mid-line, further confirming the significance of this major channel.
📊 Chart B – Short-Term Channel
The shorter-term channel also justifies the recent top.
However, shorting from the current zone is still too early, and here’s why:
Price has reached the 25% reaction zone on both charts
This level has repeatedly acted as a sensitive reaction point across multiple timeframes
Bitcoin is sitting on its 160-week trendline
Clear bullish divergence appears on both MACD and RSI
Given these factors, initiating a short here is high-risk and not technically justified yet.
📉 Short Scenarios (Only If Confirmed)
Scenario A — Chart A
Wait for price to revisit the marked supply zone, then short only with a clear trigger.
Scenario B — Chart B
A short becomes valid after breaking the key level, followed by a pullback into the supply zone.
📌 Outlook
My base view: Bitcoin is likely to correct toward the demand zone shown on Chart B.
📣 Final Note
Stay safe, trade smart.
Follow the profile so you don’t miss the daily live swing trades and day-trading setups shared here on TradingView.
Quarterly BTC Key levels (Q4 BTC)These are key BTC Quarterly levels , invalidation to these levels are good for trading BTC
BTCUSDTBitcoin Analysis
In the previous analysis, I mentioned that every time Bitcoin corrects more than 30% from its price top, it enters a downward phase.
Although the price dropped close to $80k (36%), it didn’t establish a solid consolidation there, so our scenario is still valid. With a confirmed consolidation below the $86k–$87k range, we would officially enter a bearish phase, with the first potential target around the $74k zone.
For now, the price is being held up well, and we need to see what tonight’s interest-rate decision and Jerome Powell’s remarks will signal for the market.
It’s also worth mentioning that we are in the final month of the calendar year, and historically, this month has consistently shown stronger selling pressure in previous years.
Even though the rate cut has already been priced in, the announcement itself could still generate demand in the market — unless Powell, in his speech afterward, tries to emphasize strengthening the U.S. dollar, which could create selling pressure across markets.
Overall, tonight will give us a much clearer direction for Bitcoin’s price action, and as always, we will move in sync with the market.

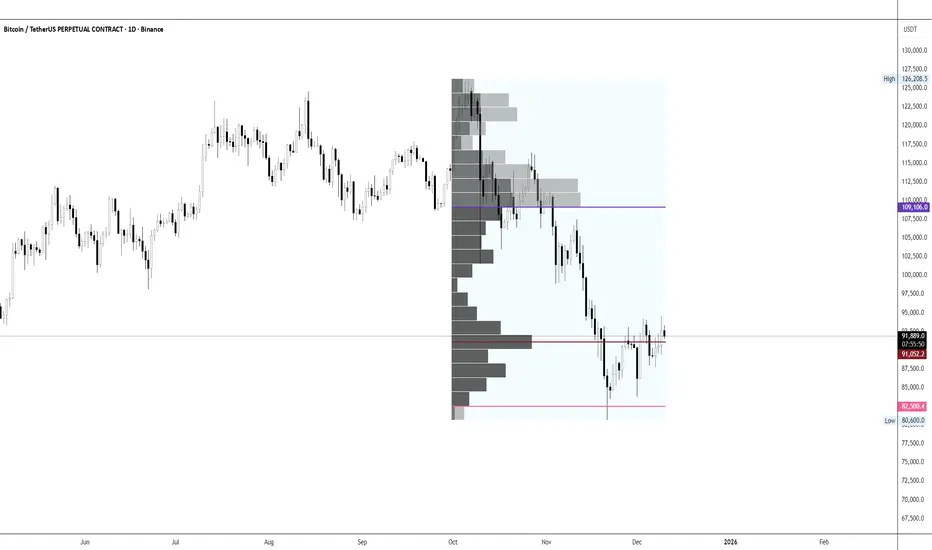
BTC/USDT Analysis. News-Driven Activity
Hello everyone! CryptoRobotics trader-analyst here, and this is the daily market analysis.
Yesterday, Bitcoin surged and reached our resistance zone at $94,000–$97,500 (volume area) after the release of positive U.S. labor market data.
At the moment, we are observing signs of buyer weakness: recent local highs are updated without momentum, and after testing the local support at $92,000 (pushing volume), the buyer is not showing initiative. Delta imbalance has shifted back toward sellers.
A key area to watch is around ~$93,500, where the highest concentration of absorbed spot-buying volume is located. If the price tests this level and reacts, we consider short positions targeting the 87,800–86,400 support.
An additional scenario is a repeated fake breakout of the local high. In this case, the downside potential remains the same.
Alternative scenario: a confident breakout of the current high. If this happens, the trading priority shifts fully to longs, and we will look for long setups on a retest, with targets above $100,000.
Buy Zones
• 87,800–86,400 (volume zone)
• $84,000–$82,000 (volume anomalies)
Sell Zones
• $94,000–$97,500 (volume zone)
• $101,000–$104,000 (accumulated volume)
• $105,800–$106,600 (local resistance)
This publication is not financial advice.

BTC USDT idea - Temporary (Christmas) bullish patternMy idea is based on my bias that we are in a range season and the upward movement is a correction. In other words, I take into account the liquidity zones left by previous POCs.
If it reaches 101 k at all, for me that's a dangerous zone where any unnecessary FOMO could turn into a trap. But if it breaks through, we'll see again. We're all hoping for a Christmas rally, right?

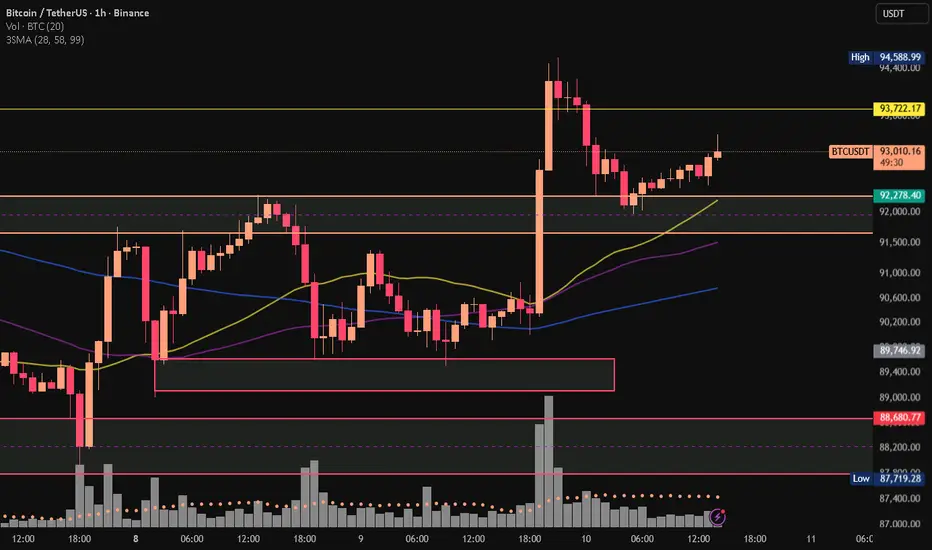
BITCOIN SELLING CONFIRM📉 Sell Trade Summary
Pair: BTC/USDT
Direction: Sell (Short)
Reason: Price swept the Buy-Side Liquidity Range, rejected from supply, and broke structure bearish.
Entry: Retest of the supply zone around $93.2K–$93.4K
Stop-Loss: Above liquidity sweep at $94.6K
Take-Profit: Demand zone at $89.5K–$90K
R:R: Approximately 1:3+
Bias: Bearish continuation toward lower demand.

BTC — My Plan: I am in the same position as in the previous reviBased on my previous idea, I am in a position with lower entry points. You can check my profile. I have already addressed part of it.
I expect something similar from BTC going forward. However, I do not rule out swings in different directions before the Fed. This is not financial advice, just my vision. Especially since I am in a position with lower entry points!

EcoByG Bitcoin Daily Analysis #7 — Daily BTC Market UpdateWelcome to My Analysis.
Now, let’s break down today’s Bitcoin structure.
Bitcoin is currently forming a range structure with a slight bullish bias.
After a strong upside spike, price has entered a compression phase, where candles are getting smaller and volume is dropping as the market “digests” the move.
The alignment of the moving averages shows that the market is slowly shifting out of indecision and leaning toward a mild bullish tendency.
Right now, price is trading exactly on the Equilibrium Zone following the major impulse move.
After being rejected from the 94K ceiling, Bitcoin is now testing whether it can break away from equilibrium and form a second bullish leg — or not.
Buyers vs. Sellers
Buyers
After the big upward spike, buying volume was clearly dominant in the bullish candles.
We still see soft defense around the 92,000 level.
Price holding above all three moving averages → buyers maintain light control.
Sellers
Strong selling pressure appeared at 93,200 – 93,700.
Upper wicks show sellers are preventing an easy breakout above this zone.
Overall: the market is balanced but slightly tilted toward buyers.
RSI
RSI is currently neither overbought nor oversold.
This means:
The market hasn’t chosen a clear direction yet.
The momentum from the previous bullish spike hasn’t fully faded.
But there isn’t enough energy for a strong breakout either.
In simple terms:
RSI says the market is in “waiting mode.”
Final Conclusion
The market is currently in:
“Range with Bullish Bias”
Bullish scenario
If Bitcoin stays above 92,000 → Next targets: 93,700, and if that breaks → 94,580.
Bearish scenario
If the 92,000 support breaks → Correction toward 91,450 is likely.
Breaking that → a deeper move back toward the heavy zone 89,800 – 88,700.
Dominant Scenario
A second bullish wave is possible if price stabilizes above 92,000, but the market has not yet gathered enough energy to break major resistances.
⚠️ Important Note:
The Federal Reserve has a meeting today and will announce the interest rate decision.
Trade cautiously — volatility may increase.
⚠️ Risk Alert ⚠️
Futures are not beginner-friendly. These triggers require solid experience.
Before using them, study risk management and practice with the learning content here.
#BTCUSDT.P 3H ChartPrice recently broke above the previous high as expected however it failed to tap into our POI beforehand. It also got rejected off the S/R Flip at $94k and it is currently ranging in an ascending triangle. We will be removing our limits and wait for the breakout for further confirmation before entering any new setup on #BTC.

BTC-USDTBitcoin, after breaking $90,000, as I mentioned in the last analysis 📊🕯, has taken a good trend and even rose to $94,200 🪙
Currently, Bitcoin's supports are at $92,000 and then $90,000 🔽🪙
For Bitcoin to rise again, it needs to break the $94,000 resistance, in which case it can rise to $95,800 without any problem 🔼✔️


Bitcoin to $100kBitcoin is ready to push one more time to reach a very important resistance area at $100k


Brainiak | Bitcoin in ConsolidationAfter projecting a move toward the 94,000 level, the market has now reached that target. The only concern is the sharp rejection that occurred immediately after the test. This kind of reaction suggests a high probability that the market may not be ready to break upward yet.
Here are the major zones, ranked by likelihood, based on how deep the pullback goes and how that affects the chance of continuation:
The strongest continuation zone is above 89,000. If the pullback stays within this area and shows a clear reversal signal .. without forming a fast, aggressive V-shape drop .. then the probability of a bullish continuation remains high. The decline should be relatively slow and controlled for this zone to hold.
The next area is around 86,000. This is still workable, but price action will likely begin forming more sideways structure, meaning the market may dip first before attempting another push upward.
The least likely bullish zone is around 84,000. If price tests this zone, fails to hold, and breaks below it, then the market would need to move lower before any meaningful bullish structure can form again.
For now, the only thing left is to wait for price to retest 94,000 .. and ideally break above it. The next move hinges on that retest.

$BTC Critical Phase Update! CRYPTOCAP:BTC got rejected from marked supply, and I’m staying flat for now. Until red box breaks, CRYPTOCAP:BTC is in a critical phase.
Remember: breaking red box doesn’t mean we go straight to ATH. It just means 4H trend turns bullish, and we might see some upside move.
“So don’t assume breakout = ATH”

FED RATE CUT idea - bull trapA head-and-shoulders setup suggesting a potential Fed rate cut on December 10, followed by a fake-out (bull trap).
