BTC Technical analysis 4H time frame📊 BTCUSDT 4H Analysis
Trend Analysis
BTC is still in a medium-term downtrend because price remains under the 4H EMA ribbon, especially the heavy red EMAs (bearish control).
But short-term trend has flipped bullish, as BTC is reclaiming the lower EMAs and pushing into the resistance cluster at $92,000 – $94,000.
Key Support & Resistance Levels
Resistance
4H R1: $92,200
4H R2: $93,000
4H R3 / Major Resistance Zone: $93,500 – $94,000 ← very strong supply
Support:
Major Support: $89,800 – $90,300
Critical Support: $86,000 – $87,000
Local ascending trendline support also aligns with the critical zone — strong confluence.
Candlestick Interpretation
Current candlestick structure shows a series of strong green-bodied candles approaching resistance. No reversal pattern yet.
BTC is attempting a controlled bullish continuation sequence, but confirmation requires a close above $92,300 to validate a trend reversal attempt.
Indicators & Oscillators
MACD crossed bullish
Histogram is increasing
Momentum is rising but still below the zero line → trend reversal not confirmed yet
EMA Ribbon- BTC is fighting the mid-band. A breakout above $93k would flip the ribbon bullish on 4H
Indicators show early bullish strength, not yet full trend reversal.
Volume Analysis
Volume increased on the bounce from $89k, but buying volume approaching resistance is not strong enough yet. For a breakout above $94k, we need volume expansion + long candle body closure
Wave Analysis (Simplified Elliott Structure)
Current move looks like a Wave B upward correction unless $94k breaks. A break above $94k activates Wave 3, targeting $98.2k–$100k. Failure below $92.3k leads into Wave C downward to $88.5k then $86k
Intraday Trading (4H)
Long after confirmed 4H close above $92,300
SL: $91,200
TP1: $93,000
TP2: $93,500–$94,000
OR
Short rejection at $93,500–$94,000
SL: $94,450
TP: $92,200 then $91,500
Swing Trading (Multi-day)
Swing long only after daily close above $94k
SL: $91,800
TP1: $97,500
TP2: $100,000
Swing short if price loses $89,800
SL: $91,300
TP: $87,000 → $85,500
***NOT Fianacial advice, just a technical ananlysis***
Market insights

EcoByG Bitcoin Daily Analysis #5 — Daily BTC Market UpdateWelcome to My Analysis.
Now, let’s break down today’s Bitcoin structure.
Bitcoin isn’t bullish yet — it’s just ranging inside a downtrend.
And unless one level breaks, the market is preparing for another move down.
Here’s the breakdown.
Market Structure
The primary trend is still bearish — price is trading below broken structures and several major resistances.
The current move is mostly a corrective rally inside the downtrend, not the start of a new uptrend.
Price action & candle behavior
Price is currently oscillating inside a tight range between 89,800 and 93,700.
The recent upward move is a correction wave inside the bearish structure.
The last pullback bounced exactly off 88.7K support, and price is now heading back toward the range top.
Volume
There was a strong volume spike at the 88.7K bottom → indicating buyer entry.
However, volume has declined during the recent rise, which shows the rally lacks full conviction.
RSI
RSI bounced from the range bottom (near 30).
A small bullish divergence is visible.
Still, RSI remains well below buyer power (below 70) → the upside is not yet fully confirmed.
Final summary
Overall structure: still bearish.
We are inside a corrective range within a downtrend.
93,700 is the key level for either breakout or reversal.
Until 93,700 is cleanly broken, the range continues and the probability of another drop back to 88.7K is high.
Deeper supports: 84K → 82K.
⚠️ Risk Alert ⚠️
Futures are not beginner-friendly. These triggers require solid experience.
Before using them, study risk management and practice with the learning content here.
How to choose what to invest inHow to choose what to invest in: a practical checklist for traders and investors
Many beginners start with the question “What should I buy today?” and skip a more important one: “What role does this money play in my life in the next years?”
That is how portfolios turn into random collections of trades and screenshots.
This text gives you a compact filter for picking assets. Not a magic list of tickers, just a way to check whether a coin, stock or ETF really fits your time horizon, risk and skill level.
Start from your life, not from the chart
Asset selection starts before you open a chart. First, you need to see how this money fits into your real life.
Three simple points help:
When you might need this money: in a month, in a year, in five years.
How painful a 10, 30 or 50 % drawdown feels for you.
How many hours per week you truly give to the market.
Example. Money is needed in six months for a mortgage down payment. A 15 % drawdown already feels terrible. Screen time is 2 hours per week. In this case, aggressive altcoins or heavy leverage look more like a stress machine than an investment tool.
Another case. Ten-year horizon, regular contributions, stable income from a job, 30 % drawdown feels acceptable. This profile can hold more volatile assets, still with clear limits on risk.
Filter 1: you must understand the asset
First filter is simple and strict: you should be able to explain the asset to a non-trader in two sentences.
The label is less important: stock, ETF, coin or future. One thing matters: you understand where the return comes from. Growth of company profit. Coupon on a bond. Risk premium on a volatile market. Fees and staking rewards in a network.
If your explanation sounds like “price goes up, everyone buys”, this is closer to magic than to a plan. Better to drop this asset from the list and move on to something more clear.
Filter 2: risk and volatility
The market does not care about your comfort. You can care about it by choosing assets that match your stress level.
Key checks:
Average daily range relative to price. For many crypto names, a 5–10 % daily range is normal. Large caps in stock markets often move less.
Historical drawdowns during market crashes.
Sensitivity to events: earnings, regulator news, large players.
The sharper the asset, the smaller its weight in the portfolio and the more careful the position size. The same asset can be fine for an aggressive profile and a disaster for a conservative one.
Filter 3: liquidity
Liquidity stays invisible until you try to exit.
Look at three things:
Daily traded volume. For active trading, it is safer to work with assets where daily volume is many times larger than your typical position.
Spread. Wide spread eats money on both entry and exit.
Order book depth. A thin book turns a big order into a mini crash.
Filter 4: basic numbers and story
Even if you are chart-first, raw numbers still help to avoid extremes.
For stocks and ETFs, it helps to check:
Sector and business model. The company earns money on something clear, not only on a buzzword in slides.
Debt and margins. Over-leveraged businesses with thin margins suffer in stress periods.
Dividends or buybacks, if your style relies on cash coming back to shareholders.
For crypto and tokens:
Role of the token. Pure “casino chip” tokens rarely live long.
Emission and unlocks. Large unlocks often push price down.
Real network use: transactions, fees, projects building on top.
Build your personal checklist
At some point it makes sense to turn filters into a short checklist you run through before each position.
Example:
Time. I know the horizon for this asset and how it fits my overall money plan.
Risk. Risk per position is no more than X % of my capital, portfolio drawdown stays inside a level I can live with.
Understanding. I know where the return comes from and what can break the scenario.
Liquidity. Volume and spread allow me to enter and exit without huge slippage.
Exit plan. I have a level where the scenario is invalid and levels where I lock in profit, partly or fully.
Connect it with the chart
On TradingView you have both charts and basic info in one place, which makes this checklist easier to apply.
A typical flow:
Use a screener to find assets that match your profile by country, sector, market cap, volatility.
Open a higher-timeframe chart and see how the asset behaved in past crashes.
Check liquidity by volume and spread.
Only then search for an entry setup according to your system: trend, level, pullback, breakout and so on.
Before clicking the button, run through your checklist again.
Common traps when choosing assets
A few classic traps that ruin even a good money management system:
Blindly following a tip from a chat without knowing what the asset is and why you are in it.
All-in on one sector or one coin.
Heavy leverage on short horizons with low experience.
Averaging down without a written plan and clear risk limits.
Ignoring currency risk and taxes.
This text is for educational purposes only and is not investment advice. You are responsible for your own money decisions.

Analytics: market overview and forecasts
WHAT HAPPENED?
Last week, for bitcoin, we reached the upper limit of a significant support zone and almost immediately received a powerful boost. This led to a change in the local trend to an upward one.
As part of the growth, the resistance of $94,000-$97,500 (volume zone) was reached, from which the correction began. Now we've pushed off from the support of $87,800-$86,400 (volume zone) and maintain the upward context.
WHAT WILL HAPPEN: OR NOT?
The movement potential is aimed at updating the local maximum. To fully reverse the trend, the buyer needs to demonstrate more strength.
The $94,000-$97,500 zone remains relevant, as a significant part of it hasn't been tested. The implementation of a positive scenario is possible both through a confident breakdown of this range, and through the formation of a weak correction in terms of volume and price action.
A negative factor for the development of the long rally this week is the selling pressure on the spot market, as seen by the cumulative delta. The situation is better in futures, but the market needs more "fuel" for a final turnaround.
Alternative scenario: with a strong defense of the nearest resistance, a sideways trend may form in the range of $84,000-$94,000.
Buy Zones
$87,800–$86,400 (volume zone)
$84,000–$82,000 (volume anomalies)
Sell Zones
$94,000–$97,500 (volume zone)
$101,000–$104,000 (accumulated volumes)
$105,800–$106,600 (local resistance)
IMPORTANT DATES
We're following these macroeconomic developments this week:
• Tuesday, December 9, 15:00 (UTC) — publication of the number of open vacancies in the labor market (JOLTS) USA for October;
• Wednesday, December 10, 2:45 (UTC) — announcement of Canada's interest rate decision;
• Wednesday, December 10, 19:00 (UTC) — US FOMC statement and economic forecasts, as well as the announcement of the US Federal Reserve interest rate decision;
• Wednesday, December 10, 19:30 (UTC) — US FOMC press Conference;
• Thursday, December 11, 9:00 (UTC) — press conference of the National Bank of Switzerland;
• Thursday, December 11, 13:30 (UTC) — publication of the number of initial applications for unemployment benefits in the United States for the week;
Friday, December 12, 7:00 (UTC) — publication of the UK GDP for October, as well as the German consumer price index for November.
*This post is not a financial recommendation. Make decisions based on your own experience.
#analytics

BTCUSDT Short-term bullish trend: Target - $94KTread with Caution with the market lacking volatility and the upcoming FOMC meeting. Use Stop Loss wisely.
The 15 min chart shows a triangle formation ready for a breakout with a potential target of $94K.
The 4hr chart shows a double bottom formation with a potential target also around $94K.
The previous FVG on the 4-hour chart also sits between the 94K-95K zone.
The market structure shows an uptrend with higher highs and lower lows recently and the prices sitting above the 20EMA.
The RSI and MACD are also trending upwards on the Daily, 4hr and 15min, indicating (for the moment) bullish trend.
Overall, gives enough data points to suggest a temporary uptick to $94K range.
As always, trade with strong risk management and adapt with the market direction.

Vanguard Turns Pro Crypto | Bitcoin Responds InstantlyBitcoin surged massively on Dec 2–3 after Vanguard ( a $11T asset manager long known for its anti-crypto stance ) opened its platform to spot ETFs for BTC, ETH, XRP, and SOL. This gives 50M+ traditionally conservative investors direct access to crypto products for the first time
The shift follows the appointment of new CEO Salim Ramji, formerly at BlackRock and involved in launching IBIT, a clear signal of strategic realignment
Market response was immediate:
- BTC jumped minutes after the U.S. open
- IBIT hit Billions $ in volume in the first few minutes
- Analysts noted a “ wave of Vanguard clients moving at once ”
Despite the Coinbase Premium Index still negative, U.S. spot demand is improving. A move back to neutral or positive premium could set up the next leg toward the $100K zone
With Vanguard now engaged, this is not a short-lived catalyst. Even a 0.5% allocation of its AUM would mean $55B in potential flows, larger than the entire first year inflow of the 2024 ETF cycle
Vanguard joining the market marks the true beginning of institutional scale crypto adoption

Bitcoin Analysis – Yesterday the Market Went Crazy Hey traders!
Let’s jump into today’s Bitcoin analysis.
Yesterday the market went full crazy mode
As I told you before, you could take both long and short positions from the extremes — and I did exactly that. Both directions activated ✔️
First things first, like always, the Fear & Greed Index:
24 — still in the Fear zone.
🔍 Quick Look at the Daily Timeframe
I want you to open your daily chart with ZERO indicators.
Just look at the structure.
The daily trend is still bearish, and right now we are simply in a correction of that bearish trend.
According to Dow Theory, if we consider the primary trend as down, then we’re currently in the secondary movement.
Keep that in mind — it matters.
🚀 Scenarios & Triggers
📈 Bullish Scenario (LONG)
If price wants to move up:
👉 Breaking 92,000 is my main LONG trigger.
I will definitely take a long there, especially if the move starts during the US session or if I see clean stepping volume.
You can also long from 91,500,
just wait for a clean 1-hour candle close.
📉 Bearish Scenario (SHORT)
For shorts on Bitcoin itself — honestly,
👉 there’s NOTHING until 89,200.
Market structure isn’t giving any short setup yet.
Until then:
🔸 either wait
🔸 or look for altcoins that are bearish against BTC — those can give great short setups.
🟢 About Yesterday’s Trades
Both trades activated:
Short → closed at 2R, solid.
Long → almost hit 2R, but because my entry was a bit far, price reversed and hit SL.
Totally normal when the market has no clear direction.
🎯 Final Notes
Keep the scenarios in mind.
Watch the volume.
And as always — risk management comes first.
Stay profitable 💚🔥

BTCUSDT BUY NOW!!!!!BTCUSDT Completed my last analysis predictions by meeting up 87k level with a sharp rejections on my recent previous post on btc am in on a buy right now to 94k then expecting to make a rejections off 100k level......

Wait for Nice!I placed an order with 25% cash on the price of $61,800.
After that, we will monitor the trend, volume and behavior of the market around this price.
Let's see what will happen!

Buy before Pump! BTCUSDTAccording to the areas, previous halving trends, and weekly candles, 2 points for step-by-step purchase of Bitcoin are identified in the chart.
Don't forget capital management! be profitable.

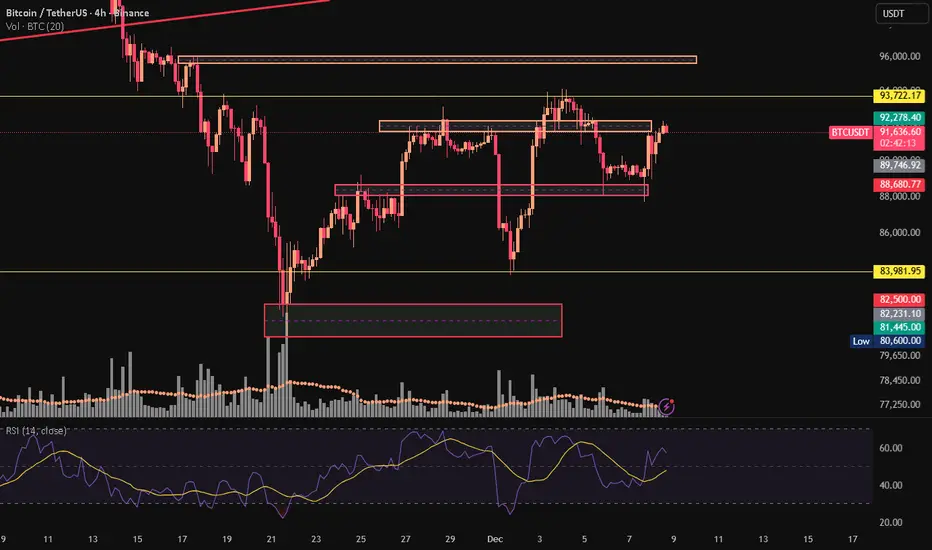
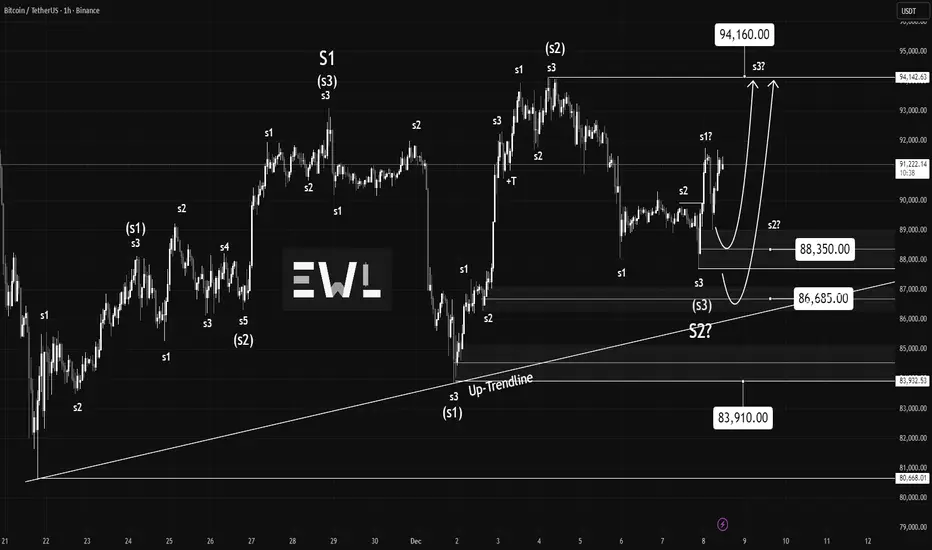
Brainiak | Bitcoin at an in-between stageBitcoin is showing a strong likelihood of pushing up to test the 94,160 level. It’s almost there already. Once price reaches that zone, the next thing to watch is whether it can hold above 94,160. Ideally, it should consolidate and continue higher... not break slightly above the level only to slam back down with force.
If that kind of rejection happens, price would likely swing inside the 94,160–83,910 range again, and that scenario isn’t very promising. The dominant trend that sent price down earlier was bearish, and the current structure is leaning more sideways than decisively bullish, which usually signals continuation to the downside.
But here’s the conflict: the current S1–S2 formation (large degree) is sitting right inside what can only be described as a true “buy the dip” zone .. the same large demand area that previously launched Bitcoin into its prior ATH. It’s a region where buyers naturally step in, and volume can spike hard. The long-term trend still favors the bulls.
This creates a tension between two forces:
- Short-term behavior and Sideways movement hinting at downward continuation.
- Macro context and Price sitting in a deep discount zone aligned with the major uptrend.
With the idea that trend is your friend, the primary bias leans toward looking for buy setups rather than sells .. even though the short-term structure looks messy.
There are three main buy zones I’m watching:
88,350
86,685
83,910
The second and third zones (86,685 and 83,910) are especially attractive because they sit deeper in the range .. meaning the reward-to-risk becomes heavily favorable if price bounces there.
But 88,350 also shouldn’t be ignored. Price could easily retest that level and rally straight from there. It’s a legitimate buy area as long as you keep a proper stop-loss.
If you want to be even more conservative, wait for the 15-minute structure to develop a bit more. The current small S1/S2 sequence on the far right looks a little compressed, and it may need more formation before a clean upward leg.
If price breaks below 83,910, step aside. Let it form a new structure.
Right now, trading within the range gives the most advantage: buy near the lower boundary and take profit near the top of the box around 94,160.
Another thing to note is the Up-Trendline. A trendline is just a guiding framework .. if it breaks, the probability of a continued move upward decreases, but it doesn’t drop to zero. It only becomes zero once price breaks below the key zone I mentioned earlier (83,910). If that level fails, I’ll step aside and wait, because sometimes it can still turn out to be a false break.
That’s the outlook for now.
Thanks to everyone who commented and showed support. I’ll keep updating the chart as things unfold.
BTCUSDT Buying IdeaThis area is identified as a strong buying zone, where price has historically found support and buyers have stepped in. The market shows signs of accumulation, indicating that bullish momentum may develop if the zone holds.
Traders should wait for a confirmation signal, such as a bullish candle or a shift in market structure, before entering long positions.
📍 Zone: Strong buying area
📍 Structure: Accumulation forming / higher lows
🎯 Bias: Bullish continuation potential
⚠️ Wait for confirmation before entry

88K IncomingA liquidity sweep under 88K is imminent. A lot of buy orders currently are likely to trigger a manipulation and a downtrend seeking the 88K region.

BTC/USDT 4H Chart 🔍 MARKET STRUCTURE
The chart shows a broad ascending channel in which BTC has been moving for several days:
Lower trend support: ~$87,500 – $88,000
Upper trend line: ~$94,500 – $95,000
The price has clearly rebounded from around $89,200, an important demand level.
📈 KEY LEVELS
Support
USD 89,284 – local support from which a rebound occurred
USD 87,804 – the next, much stronger support level consistent with the trendline
Resistance
USD 91,466 – currently being tested
USD 94,141 – key resistance and the upper band of the channel
📊 CHART SITUATION (4 hours)
1. Price action
The price has made a strong upward impulse from support at USD 89,280.
It is currently reaching local resistance at USD 91,450 – USD 91,700.
If this level is broken, the target is USD 94,000 – USD 94,500.
If it fails, a pullback to USD 90,200/USD 89,300 can be expected.
📉 MACD
Your MACD shows:
Bullish crossover – buy signal.
The histogram changes from red to green → momentum is increasing.
The curves are diverging, confirming the strength of the move.
This indicates that the short-term trend is turning bullish.
📌 TWO TRADING SCENARIOS
🟢 BULLISH Scenario (more likely)
Condition: H4 candle breakout and close above USD 91,700.
Targets:
TP1 → USD 92,800 – USD 93,200
TP2 → USD 94,000 – USD 94,500 (upper channel)
Stop-loss (if you were going long):
below USD 90,500
Safer below USD 89,280
MACD confirms this scenario.
🔴 BEARISH Scenario
Condition: rejection of USD 91,700 and a close below USD 90,500.
Targets:
TP1 → USD 89,300
TP2 → USD 87,800 (key trendline)
A drop to USD 87,800 would be an ideal place for large players to buy again.

Chapter II: Mirrors and Reflections The apprentice moved quickly, hands darting across wires and tools with impressive confidence. His speed was his pride... proof of his growing skill. Yet in the reflection of the tech’s watchful eyes, that very strength began to reveal its cracks.
What once seemed mastery now showed signs of haste: bolts tightened too fast, readings skimmed instead of studied, conclusions drawn before the silence of the machine had spoken. The mirror of his own reflection showed him not triumph, but fragility.
The tech did not scold. Instead, he recalled Terry...the mentor whose lessons were never rushed. Terry’s path was steady, deliberate, and patient. He taught that true understanding was not measured by speed, but by depth.
“Your quickness,” the tech said, “is a gift. But gifts can betray you if you lean on them too hard. Strength without patience becomes weakness. Terry knew this. He walked the slower road, and because of that, he saw further than most.”
The apprentice lowered his tools, realizing that reflection was not about seeing himself as he wished to be, but as he truly was. In the mirror of his mistakes, he found the lesson: patience is not the opposite of progress...it is the foundation of it.
“BTC Wave Check — Which Hits First: 100K or 75K?"🌪️📉📈 BTC Daily Update — Caught Between 85K Support & 100K Dreams 🌊🏄♂️
BTC is still riding that heavy downtrend wave after slipping out of the rising channel, and even though we just got a bounce off the 85K support zone, it doesn’t feel like a power move — more like BTC catching a quick breath before deciding its next paddle 🏄♂️😮💨.
Right now price is still sitting under broken market structure, and the short-term rising wedge forming on the chart is a classic bearish continuation setup. Bulls are pushing… but the candles aren’t showing confidence. No strong follow-through, no dominant volume — just a soft climb that feels fragile 😬📉.
If this wedge breaks down, the map below looks like this:
80K minor support 🌫️
A small patch of demand, but nothing major.
75K major liquidity zone 💧🔥
This is the big one — clean demand, strong memory, and the level where the chart would love to refill orders if this correction keeps flowing.
And honestly? When you read the structure and the slope of momentum, that 75K zone feels like the place the market wants to check before any real trend shift.
But here’s the flip side — the bullish escape route:
If BTC somehow gets momentum back and reclaims 90K → 95K, then the road to 100K opens again. That range is the key door. Crack it, hold it, and BTC can ride a fresh wave toward six-figure territory 🚀💛.
Meanwhile, RSI is sitting right in mid-range — not overheated, not oversold. Basically telling us the market hasn’t made up its mind yet. Momentum is neutral, waiting for a spark.
So here’s the million-dollar surf question:
Which comes first — the legendary 100K breakout or a deep dive to the 75K demand pool?
🤔💭🌊📊🔥
Your call, surfers — where’s this wave heading next?
💬 What do you think about this scenario? Only share your idea if you’ve got another opinion — otherwise just hit that button 👍
#BTC #Bitcoin #Crypto #Trading #TechnicalAnalysis


BTCUSDT – Final Liquidity Sweep Before a Push to 95–96K?DISCLAIMER:
Not Investment Recommendation or Financial Advice.
This analysis is purely for educational purposes and to test a trading strategy.
BTCUSDT – Final Liquidity Sweep Before a Push to 95–96K?
Bullish scenario forming on the 4H despite macro resistance
BTC continues its recovery from the strong correction that drove price from $125K down to $81K. Since that capitulation low, the market has been printing a sequence of higher highs and higher lows, forming a constructive 4H bullish structure.
After reaching a rebound high around $94K, BTC corrected again into the $88K zone, where liquidity was collected and buyers defended the level. Price is now consolidating near $89K, directly below key dynamic resistance.
🔥 Key Technical Factors
1. Weekly & Daily EMA-50 Acting as Dynamic Resistance
BTC is running out of time to break above the EMA 50 on both weekly and daily timeframes, a major level controlling the macro trend.
A confirmed break above this band would re-activate bullish continuation toward prior supply.
2. Higher-Timeframe Market Structure Remains Constructive
From the $81K low, BTC has developed:
Higher lows showing demand absorption
Higher highs confirming controlled bullish momentum
Well-defined liquidity zones above and below price
3. 4H Indicators Signaling Momentum Shift
Multiple 4H indicators are aligning:
MACD curling upward
Stochastics crossing up from oversold
ADX rising, indicating trend strength building
These signals support the potential for a bullish breakout.
4. Liquidity Mechanics
There is still untapped liquidity below the recent local low.
A final liquidity sweep into this area could be likely be the catalyst for the next upward leg.
🎯 Upside Target Zone: 95K–96K
BTC next logical targets based on:
liquidity heatmaps
volume profile gaps
prior breakdown levels
…are between $95,000 and $96,000.
Fundamentals may support this: the expected 25bps Fed rate cut this week could inject short-term bullish momentum into risk assets.
📌 Summary
BTC remains in a structural uptrend on the 4H chart.
The most probable sequence:
Sweep remaining downside liquidity
Bullish reversal confirmation
Continuation toward 95–96K
As long as $87.8K–$88K holds, the bullish setup remains intact.

BTC 88194.99K the point where time bows before structure Carved in Stone: The Point Where Time Bowing to Structure
🏷 BTC
🏷 17.11.2025
🏷 Capital Sector. Local price slice at a moment. System of intelligent anticipation.
🏷 88194.99 — The price is carved. As of publication, the level has not yet been reached.
November 17, 2025 — not a date, but a portal .
Within it, as within an ancient temple, the number is inscribed: 88194.99 . Not approximately. Not “around.”
Carved — without room for interpretation, without space for opinion.
This is not a signal. This is the establishment of reality within the Capital Sector. Here, speculation ends; architecture begins. Lower timeframes fall silent. The crowd remains in shadow. Only those who understand the language of price sectors and anticipatory structures can read what has already been written.
To this core is bound a minimum impulse of 7% — not an option, but a structural imperative. Price does not merely move: it must validate the integrity of the sector. Thus, the range of realization is not shaped by desire, but by inevitability.
International horizons have long been marked: not all may approach the source without being burned.
To outsiders — no entry. Not because it is forbidden, but because it is inaccessible . Reality here is constructed according to rules that are not debated — they are executed.
The point is not an invitation. The point is a test.
— The Architect

BTC at Critical Support — Bounce or Breakdown?BTC 4H Update
BTC is still moving in a controlled pullback after failing to break the 93,241 resistance. The rejection shows the market continues to respect this supply zone, and price is now hovering just above short-term support.
The key area to watch is the 88,850–89,200 support zone. If BTC can hold this level, a rebound toward 90,193 is likely, followed by another attempt to break the major resistance. A successful breakout would open the path toward the 98k–99.5k zone shown on the chart.
However, if this support breaks, price may slide into the OB 87,670–86,300 or even revisit the 85,650–85,000 support area — the same zone that created the recent higher low. Losing that level would weaken the bullish structure.
For now, structure is still intact, and BTC just needs a clean bounce to maintain upward momentum.

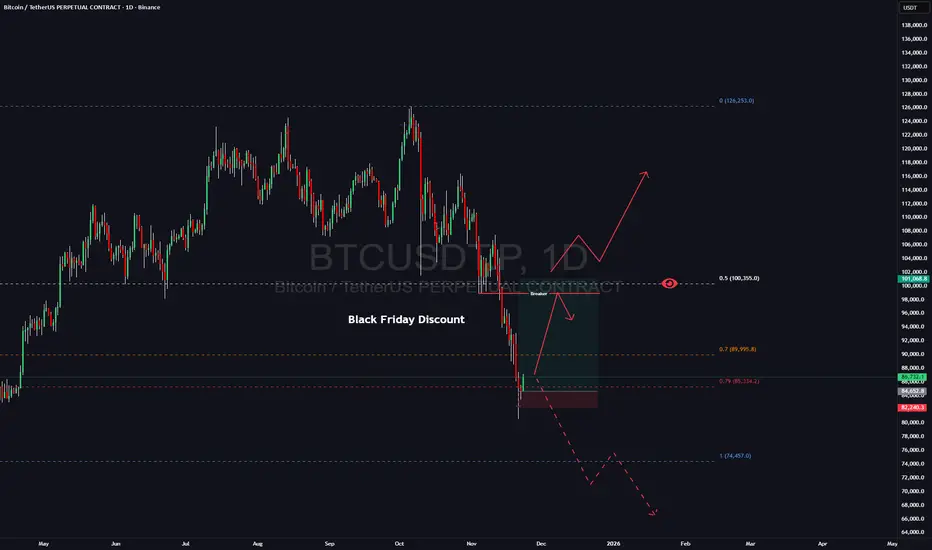
BTC Is Preparing Monster Move: My Bullish Roadmap to New High!A lot of people are already calling for the end of the BTC rally and welcoming a new bear market. Whether that’s true or not — the chart will show. I approach the market with a neutral mindset and let price action speak for itself.Plus dont forget we have Black Friday coming and probably crypto market decided to give you a nice discount)
From my perspective, Bitcoin has simply tapped the weekly discount zone. Historically, BTC often delivers a 20–30% corrective move, which is completely normal within a bullish cycle. And with Black Friday approaching, it seems the crypto market decided to offer its own “discount.”
I’ve taken a long position from this area, with my first target set at 94–96K, where I plan to secure the majority of my profits.
My stop is positioned around 82K — if the market goes against me, I’m fully comfortable with the risk.
I’ve also added some spot positions and will share detailed analysis on those in upcoming posts.
Once we reach the 94–96K zone, I’ll reassess the market. Price can shift in either direction from there, which is why that area is my main profit-taking zone while letting the remainder of the position run.
Follow me for further updates and trade breakdowns.
BTC SHORTBTCUSDT – Short Position Still Valid
Price continues to respect the bearish structure after the reversal.
We rejected the mitigation zone and stayed below the Alligator EMAs, confirming continuation.
• Short remains active
• Invalidation: Any 2H close above 89,632 – 89,892
• Structure: Lower highs + compression under resistance
• Expectation: Continuation lower after wedge breakdown
Targets:
1. 88,900
2. 87,700
3. 82,160 (main objective)
Still watching for a possible stop-hunt into the red zone, but bias remains bearish unless invalidated.

